

Long-term trends in the intensity and relative toxicity of herbicide use
- PMID: 28393866
- PMCID: PMC5394230
- DOI: 10.1038/ncomms14865
Long-term trends in the intensity and relative toxicity of herbicide use
Abstract
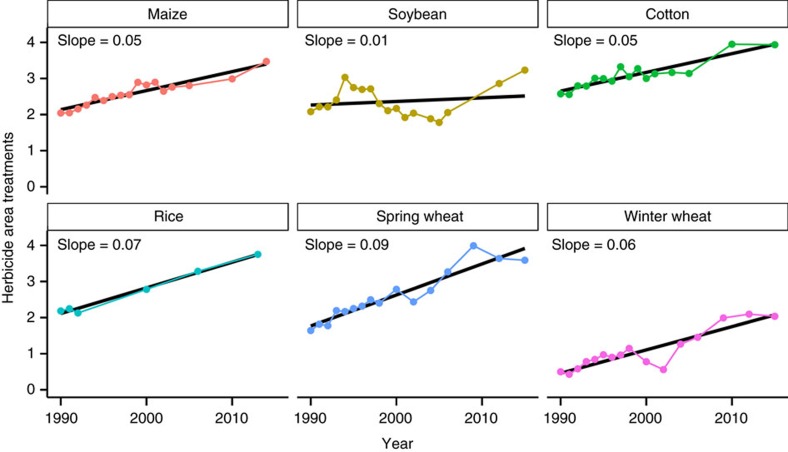
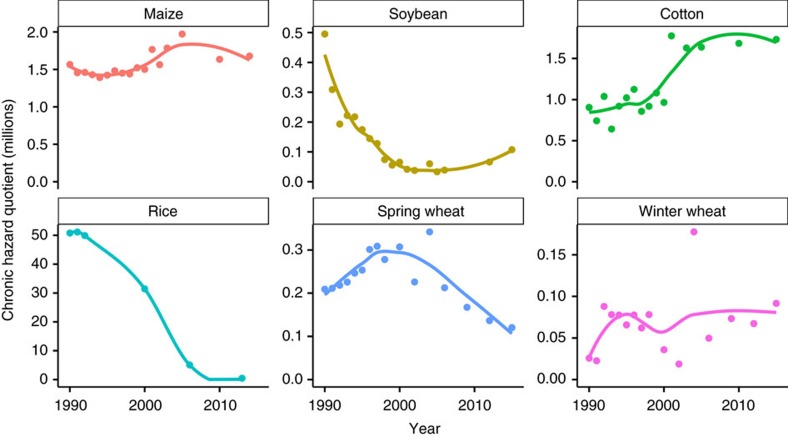
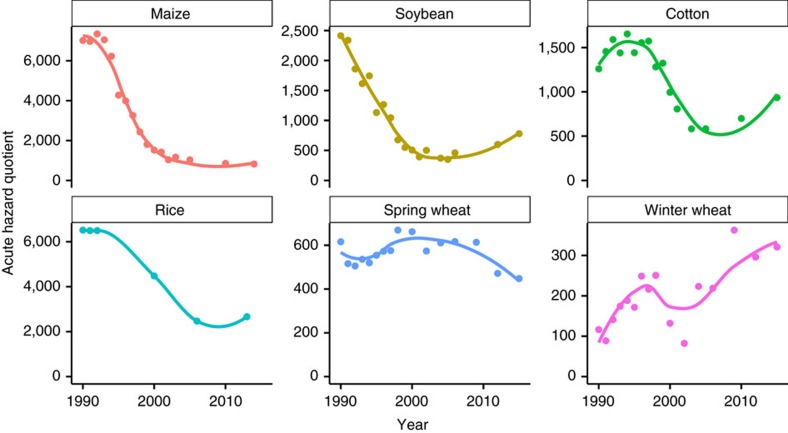
Herbicide use is among the most criticized aspects of modern farming, especially as it relates to genetically engineered (GE) crops. Many previous analyses have used flawed metrics to evaluate herbicide intensity and toxicity trends. Here, I show that herbicide use intensity increased over the last 25 years in maize, cotton, rice and wheat. Although GE crops have been previously implicated in increasing herbicide use, herbicide increases were more rapid in non-GE crops. Even as herbicide use increased, chronic toxicity associated with herbicide use decreased in two out of six crops, while acute toxicity decreased in four out of six crops. In the final year for which data were available (2014 or 2015), glyphosate accounted for 26% of maize, 43% of soybean and 45% of cotton herbicide applications. However, due to relatively low chronic toxicity, glyphosate contributed only 0.1, 0.3 and 3.5% of the chronic toxicity hazard in those crops, respectively.
Conflict of interest statement
No specific funding was received related to this manuscript. Funding has been provided to the University of Wyoming from the following sponsors in support of Dr Kniss's research and education program, either through unrestricted gifts, research contracts, or grants: Arysta LifeScience, BASF, Bayer CropScience, Dow AgroSciences, DuPont, FMC, Hatch Act Funds–USDA, Loveland Industries, Monsanto, NovaSource, Repar Corporation, StateLine Bean Cooperative, Syngenta, USDA National Institute for Food and Agriculture, University of Wyoming Department of Plant Sciences, University of Wyoming School of Energy Resources, Valent, Western Sugar Cooperative, Winfield Solutions, Wyoming Agricultural Experiment Station, Wyoming Crop Improvement Association, Wyoming Department of Agriculture, and Wyoming Seed Certification.
Figures
References
-
- Nehring R. Pesticide Use & Markets. USDA-ERS. URL http://www.ers.usda.gov/topics/farm-practices-management/chemical-inputs... Accessed 21-Jun-2016 (2012).
-
- Benbrook C. M. Impacts of genetically engineered crops on pesticide use in the US–the first sixteen years. Environ. Sci. Eur. 24, 24 (2012).
-
- Harker K. N. et al.. Our view. Weed Sci. 60, 143–144 (2012).
-
- Mortensen D. A., Egan J. F., Maxwell B. D., Ryan M. R. & Smith R. G. Navigating a critical juncture for sustainable weed management. BioScience 62, 75–84 (2012).
-
- Zimdahl R. L. Fundamentals of Weed Science 4th Edition 352Elsevier (2013).
Publication types
MeSH terms
Substances
LinkOut - more resources
Full Text Sources
Other Literature Sources
