VE-Cadherin Disassembly and Cell Contractility in the Endothelium are Necessary for Barrier Disruption Induced by Tumor Cells
- PMID: 28393886
- PMCID: PMC5385522
- DOI: 10.1038/srep45835
VE-Cadherin Disassembly and Cell Contractility in the Endothelium are Necessary for Barrier Disruption Induced by Tumor Cells
Abstract
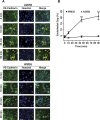
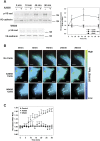
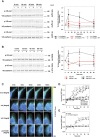
During metastasis, breakdown of the endothelial barrier is critical for tumor cell extravasation through blood vessel walls and is mediated by a combination of tumor secreted soluble factors and receptor-ligand interactions. However, a complete mechanism governing tumor cell transendothelial migration remains unclear. Here, we investigate the roles of tumor-associated signals in regulating endothelial cell contractility and adherens junction disassembly leading to endothelial barrier breakdown. We show that Src mediates VE-cadherin disassembly in response to metastatic melanoma cells. Through the use of pharmacological inhibitors of cytoskeletal contractility we find that endothelial cell contractility is responsive to interactions with metastatic cancer cells and that reducing endothelial cell contractility abrogates migration of melanoma cells across endothelial monolayers. Furthermore, we find that a combination of tumor secreted soluble factors and receptor-ligand interactions mediate activation of Src within endothelial cells that is necessary for phosphorylation of VE-cadherin and for breakdown of the endothelial barrier. Together, these results provide insight into how tumor cell signals act in concert to modulate cytoskeletal contractility and adherens junctions disassembly during extravasation and may aid in identification of therapeutic targets to block metastasis.
Conflict of interest statement
The authors declare no competing financial interests.
Figures


Similar articles
-
p38 MAP kinase is necessary for melanoma-mediated regulation of VE-cadherin disassembly.Am J Physiol Cell Physiol. 2010 May;298(5):C1140-50. doi: 10.1152/ajpcell.00242.2009. Epub 2010 Feb 24. Am J Physiol Cell Physiol. 2010. PMID: 20181932 Free PMC article.
-
Mutant B-Raf(V600E) Promotes Melanoma Paracellular Transmigration by Inducing Thrombin-mediated Endothelial Junction Breakdown.J Biol Chem. 2016 Jan 29;291(5):2087-106. doi: 10.1074/jbc.M115.696419. Epub 2015 Oct 26. J Biol Chem. 2016. PMID: 26504080 Free PMC article.
-
Actinomyosin contraction, phosphorylation of VE-cadherin, and actin remodeling enable melanoma-induced endothelial cell-cell junction disassembly.PLoS One. 2014 Sep 16;9(9):e108092. doi: 10.1371/journal.pone.0108092. eCollection 2014. PLoS One. 2014. PMID: 25225982 Free PMC article.
-
Dynamic Regulation of Vascular Permeability by Vascular Endothelial Cadherin-Mediated Endothelial Cell-Cell Junctions.J Nippon Med Sch. 2017;84(4):148-159. doi: 10.1272/jnms.84.148. J Nippon Med Sch. 2017. PMID: 28978894 Review.
-
Beyond vessels: occurrence and regional clustering of vascular endothelial (VE-)cadherin-containing junctions in non-endothelial cells.Cell Tissue Res. 2009 Jan;335(1):49-65. doi: 10.1007/s00441-008-0718-1. Epub 2008 Nov 11. Cell Tissue Res. 2009. PMID: 19002500 Review.
Cited by
-
Unveiling the intricate dynamics of the interplay between triple-negative breast cancer cells and the blood-brain barrier endothelium.Acta Neuropathol Commun. 2025 Aug 28;13(1):185. doi: 10.1186/s40478-025-01985-2. Acta Neuropathol Commun. 2025. PMID: 40877996 Free PMC article.
-
Cancer cells impact the microrheology of endothelial cells during physical contact or through paracrine signalling.Sci Rep. 2025 Mar 8;15(1):8064. doi: 10.1038/s41598-025-92422-w. Sci Rep. 2025. PMID: 40055419 Free PMC article.
-
Angiogenesis: Managing the Culprits behind Tumorigenesis and Metastasis.Medicina (Kaunas). 2018 Mar 25;54(1):8. doi: 10.3390/medicina54010008. Medicina (Kaunas). 2018. PMID: 30344239 Free PMC article. Review.
-
Breast Carcinoma: From Initial Tumor Cell Detachment to Settlement at Secondary Sites.Biomed Res Int. 2017;2017:8534371. doi: 10.1155/2017/8534371. Epub 2017 Jul 12. Biomed Res Int. 2017. PMID: 28785589 Free PMC article. Review.
-
Analysis of Differentially Expressed Genes in Endothelial Cells Following Tumor Cell Adhesion, and the Role of PRKAA2 and miR-124-3p.Front Cell Dev Biol. 2021 Feb 19;9:604038. doi: 10.3389/fcell.2021.604038. eCollection 2021. Front Cell Dev Biol. 2021. PMID: 33681194 Free PMC article.
References
-
- Unger R. E., Krump-Konvalinkova V., Peters K. & Kirkpatrick C. J. In vitro expression of the endothelial phenotype: comparative study of primary isolated cells and cell lines, including the novel cell line HPMEC-ST1.6R. Microvasc. Res. 64, 384–397 (2002). - PubMed
Publication types
MeSH terms
Substances
LinkOut - more resources
Full Text Sources
Other Literature Sources
Medical
Molecular Biology Databases
Miscellaneous

