. 2017 Apr 10:7:46187.
doi: 10.1038/srep46187.

Baculovirus LEF-11 Hijack Host ATPase ATAD3A to Promote Virus Multiplication in Bombyx mori cells

Affiliations

Baculovirus LEF-11 Hijack Host ATPase ATAD3A to Promote Virus Multiplication in Bombyx mori cells

Zhan-Qi Dong et al. Sci Rep. .

Abstract

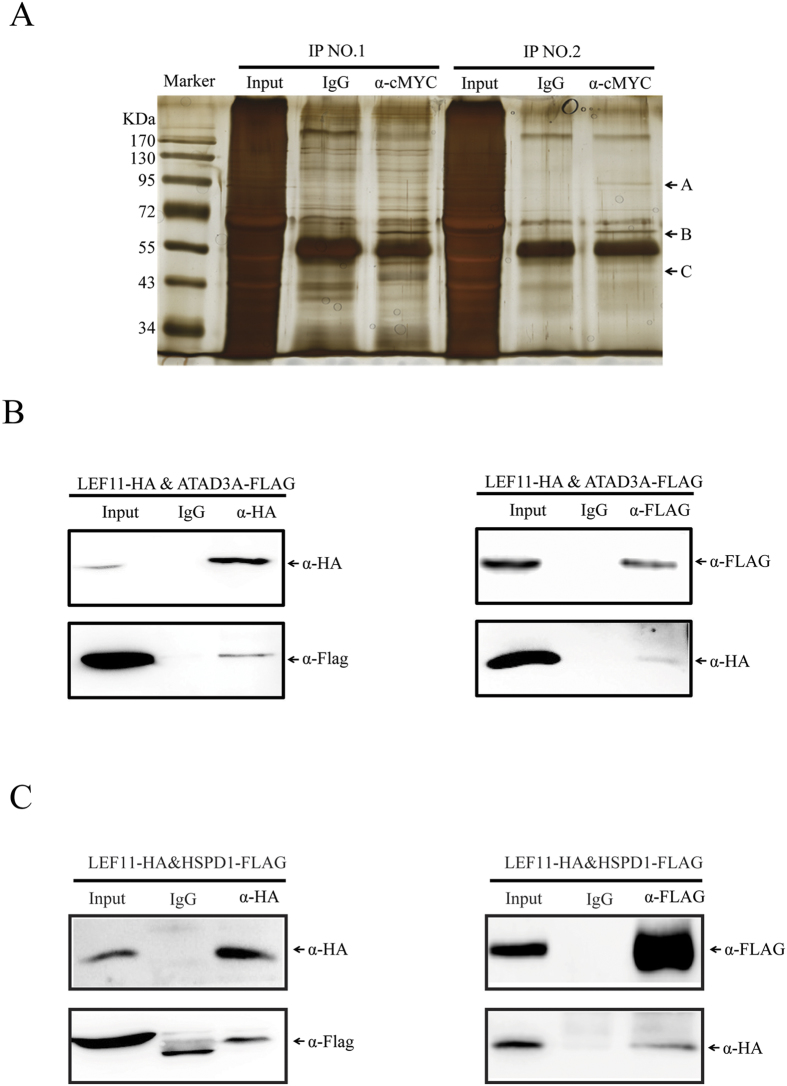
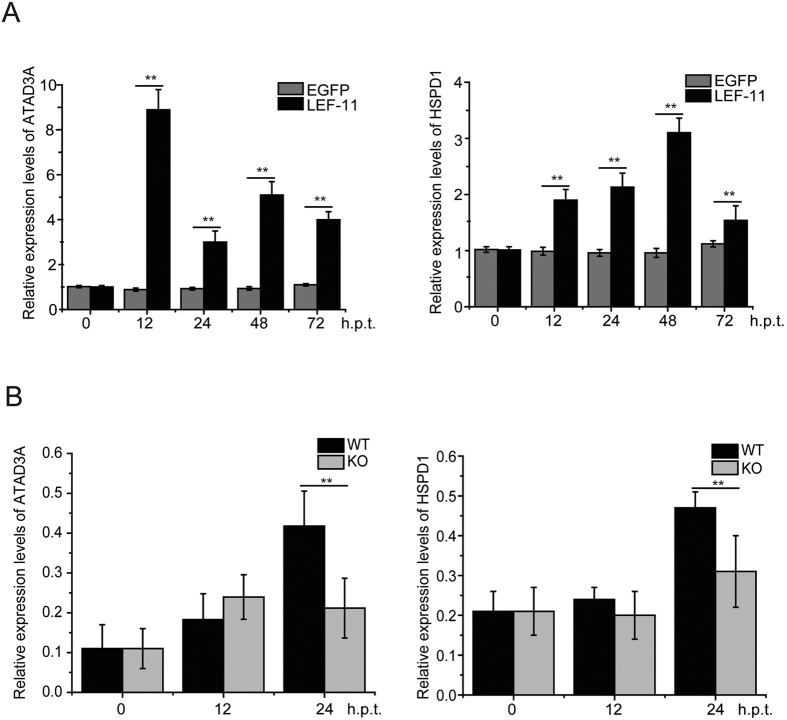
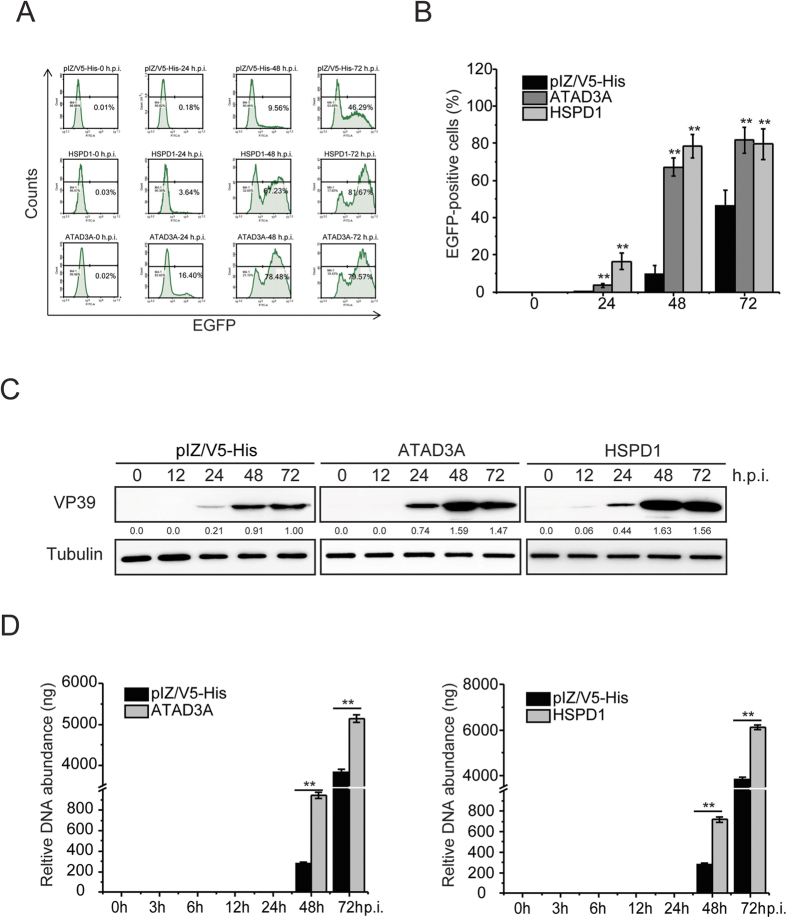
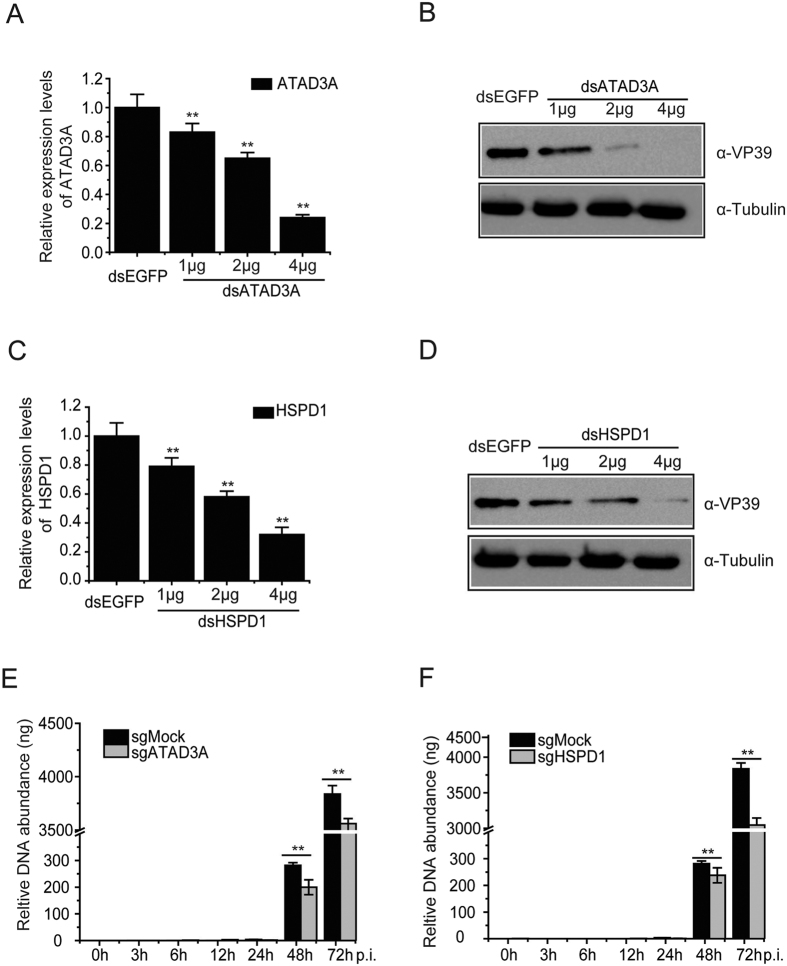
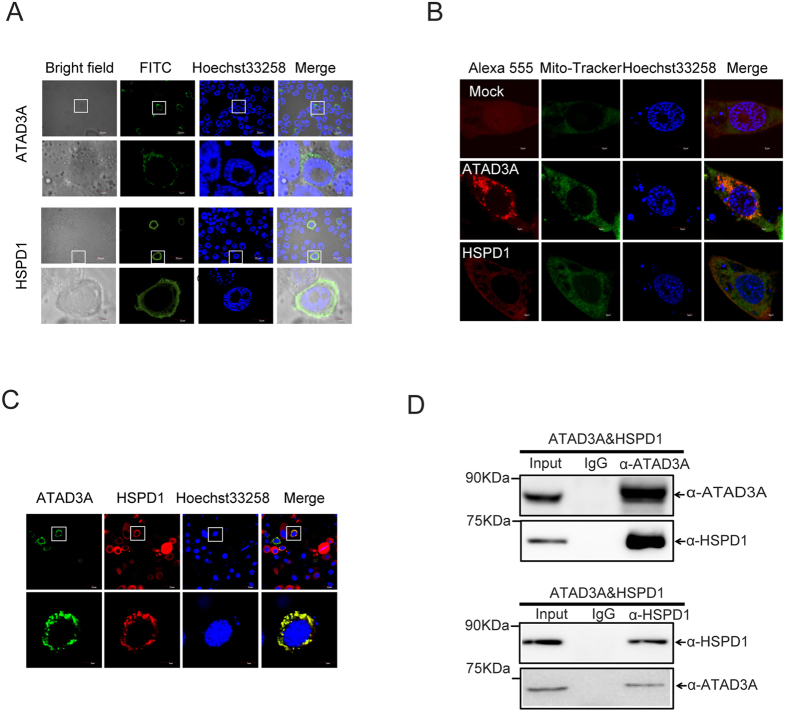
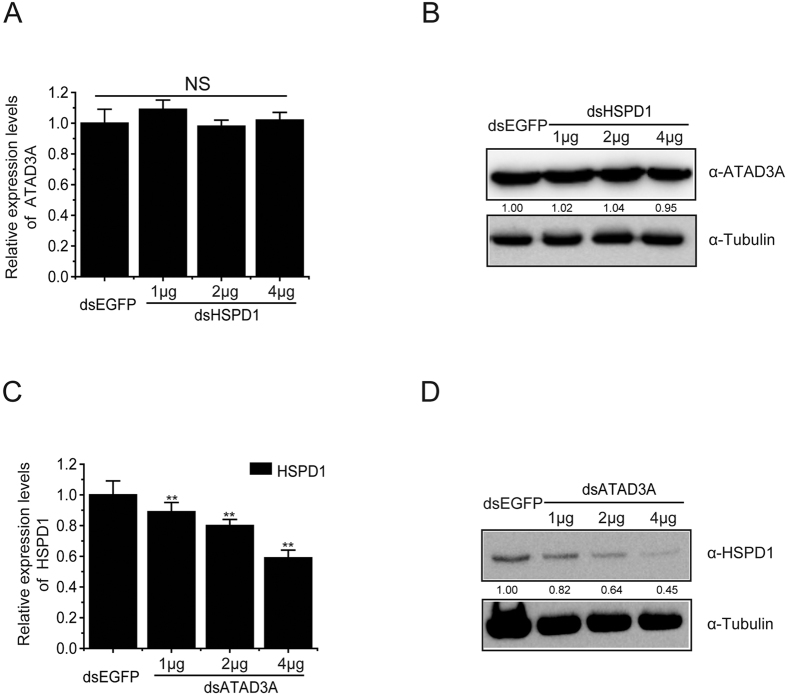
Research on molecular mechanisms that viruses use to regulate the host apparatus is important in virus infection control and antiviral therapy exploration. Our previous research showed that the Bombyx mori nucleopolyhedrovirus (BmNPV) LEF-11 localized to dense regions of the cell nucleus and is required for viral DNA replication. Herein, we examined the mechanism of LEF-11 on BmNPV multiplication and demonstrated that baculovirus LEF-11 interacts with Bombyx mori ATAD3A and HSPD1 (HSP60) protein. Furthermore, we showed that LEF-11 has the ability to induce and up-regulate the expression of ATAD3A and HSPD1, phenomena that were both reversed upon knockdown of lef-11. Our findings showed that ATAD3A and HSPD1 were necessary and contributed to BmNPV multiplication in Bombyx mori cells. Moreover, ATAD3A was found to directly interact with HSPD1. Interestingly, ATAD3A was required for the expression of HSPD1, while the knockdown of HSPD1 had no obvious effect on the expression level of ATAD3A. Taken together, the data presented in the current study demonstrated that baculovirus LEF-11 hijacks the host ATPase family members, ATAD3A and HSPD1, efficiently promote the multiplication of the virus. This study furthers our understanding of how baculovirus modulates energy metabolism of the host and provides a new insight into the molecular mechanisms of antiviral research.


Conflict of interest statement

The authors declare no competing financial interests.

Figures

Figure 1
Figure 1. Identification of LEF-11-associated proteins by Co-IP and mass spectrometry.
(A) Co-IP assays of LEF-11-associated protein analyzed by SDS-PAGE. Marker, protein molecular weight marker; Input, input cell lysates; IgG, IP with control mouse IgG; α-cMYC, IP with anti-cMYC antibody. The specific bands represented by the arrows. IP No.1 and IP No.2 is representative of two repeated experiments. (B) Co-immunoprecipitation of LEF-11 examined by Western blotting. BmN-SWU1 cells were co-transfected with LEF-11 and candidate protein. At 48 hours after transfection, cells were lysed and immunoprecipitation performed with α-FLAG/HA, and the bound of target protein using α-HA/FLAG to detected. The label on the top of each panel shows the antibodies used for immunoprecipitation. The labels on the right of each panel show the antibodies used for analysis of Western blotting. The apparent molecular size of each band is shown on the left of each panel.
Figure 2
Figure 2. LEF-11 induces the expression of ATAD3A and HSPD1.
(A) RT-PCR analysis of BmATAD3A or BmHSPD1 transcription in LEF-11 transfected cells. At the indicated time points, cells were harvested and total RNA was prepared and reverse transcription reactions were performed with SYBR Select Master Mix Reagent. (B) RT-PCR analysis of BmATAD3A or BmHSPD1 transcription in WT and KO transfected cells. Error bars indicate standard deviations from the mean. NS, not significant; **represents statistically significant differences at the level of P < 0.01.
Figure 3
Figure 3. ATAD3A and HSPD1 contribute to virus multiplication.
(A) BmNPV multiplication was measured on ATAD3A and HSPD1 overexpression cells by flow cytometric analysis and ATAD3A, HSPD1 and Mock were infected with BmNPV at different time-points. (B) Statistical analysis of the EGFP+ positive cells in the indicated stable cell lines after BmNPV infected at different time-points. **Represents statistically significant differences at the level of P < 0.01. (C) Western blotting analysis of VP39 protein synthesis after overexpression with ATAD3A, HSPD1 and Mock at different times in BmNPV-infected BmN-SWU1 cells. (D) BmN-SWU1 cells were treated with indicated plasmid and infected with BmNPV at MOI of 10. At 0, 3, 6, 12, 24, 48 and 72 h.p.i., total intracellular DNA was extracted from infected cells. BmNPV copy numbers were determined by qPCR. Each data point was determined from the mean of three independent replicates. NS, not significant. **Represents statistically significant differences at the level of P < 0.01.
Figure 4
Figure 4. ATAD3A and HSPD1 are required for virus multiplication.
(A) Knockdown of ATAD3A in BmN-SWU1 cells was confirmed by RT-PCR. BmN-SWU1 cells were transfected with dsRNA for dsEGFP (2 μg), dsATAD3A (1 μg), dsATAD3A (2 μg) and dsATAD3A (4 μg). After 48 h.p.t., the transcript levels of ATAD3A were examined by RT-PCR. (B) Effect of dsATAD3A mediated knockdown of BmATAD3A on BmNPV VP39 protein expression. After 48 h.p.t., BmN-SWU1 cells were infected with BmNPV at MOI of 1, and VP39 and Tubulin expression levels was assessed. (C) Effect of dsHSPD1 mediated knock down of BmHSPD1 on HSPD1 transcription level. BmN-SWU1 cells were transfected with dsRNA for dsEGFP (2 μg), dsHSDP1 (1 μg), dsHSPD1 (2 μg) and dsHSDP1 (4 μg). After 48 h.p.t., the transcript levels of HSPD1 were examined by RT-PCR. (D) After 48 h.p.t., the expression levels of VP39 were examined by Western blotting. Tubulin expression levels as control was assessed. (E) Effects of viral DNA replication of knockout ATAD3A on CRISPR/Cas9 system. Transfection with CRISPR/Cas9 system and infected with BmNPV at MOI of 1. (F) Effects of viral DNA replication of knockout HSPD1 on CRISPR/Cas9 system. Transfection with CRISPR/Cas9 system and infected with BmNPV at MOI of 1. At different time-points, total DNA was isolated from knockout cell and quantified by Q-PCR. **P < 0.01.
Figure 5
Figure 5. ATAD3A interacts with HSPD1.
(A) Subcellular localization of ATAD3A and HSPD in BmN-SWU1 cells. ATAD3A and HSPD1 were stained with FITC-labeled and Hoechst33258 at 48 h post-transfection in BmN-SWU1 cells. Green fluorescence represents fluorescent represent ATAD3A and HSPD1, blue fluorescence represents the nucleus. Scale bar: 5 μm. (B) Mitochondria co-location of ATAD3A and HSPD1 in BmN-SWU1 cells. ATAD3A and HSPD1 were stained with Alexa 555-labeled, mitochondria-tracker and Hoechst33258 at 48 h post-transfection in the BmN-SWU1 cells. Red fluorescence represents ATAD3A and HSPD1, Green fluorescence represents Mito-Tracker, and blue fluorescence represents the nucleus. Scale bar: 5 μm. (C) Co-localization of ATAD3A and HSPD1 in BmN-SWU1 cells. ATAD3A and HSPD1 stained with Alexa 555-labeled anti-HSPD1, FITC-labeled anti-ATAD3A and Hoechst33258 at 48 h post-transfection in the BmN-SWU1 cells. Red fluorescence represents HSPD1, Green fluorescence represents ATAD3A, and blue fluorescence represents the nucleus. Scale bar: 5 μm. (D) Co-immunoprecipitation of ATAD3A and HSPD1 examined by Western blotting. The label on the top of each panel shows the antibodies used for immunoprecipitation. The labels on the right of each panel shows the antibodies used for analysis of Western blotting. The apparent molecular size of each band is shown on the left of each panel.
Figure 6
Figure 6. ATAD3A mediates HSPD1 protein stability.
(A) Effect of dsATAD3A mediated knockdown of BmATAD3A on HSPD1 transcription level. BmN-SWU1 cells were transfected with dsRNA for dsEGFP (2 μg), dsATAD3A (1 μg), dsATAD3A (2 μg) and dsATAD3A (4 μg). After 48 h.p.t., the transcript levels of HSPD1 were examined by RT-PCR. (B) After 48 h.p.t., the expression levels of HSPD1 were examined by Western blotting. Tubulin expression levels as control was assessed. (C) Effect of dsHSPD1 mediated knockdown of BmHSPD1 on ATAD3A transcription level. BmN-SWU1 cells were transfected with dsRNA for dsEGFP (2 μg), dsHSPD1 (1 μg), dsHSPD1 (2 μg) and dsHSPD1 (4 μg). After 48 h.p.t., the transcript levels of ATAD3A were examined by RT-PCR. (D) After 48 h.p.t., the expression levels of ATAD3A were examined by Western blotting. Tubulin expression levels as control was assessed.

Similar articles

Cited by

References

    1. Shekhar M. S. & Ponniah A. G. Recent insights into host-pathogen interaction in white spot syndrome virus infected penaeid shrimp. Journal of fish diseases 38, 599–612, doi: 10.1111/jfd.12279 (2015). - DOI - PubMed
    1. Hily J. M., Poulicard N., Mora M. A., Pagan I. & Garcia-Arenal F. Environment and host genotype determine the outcome of a plant-virus interaction: from antagonism to mutualism. The New phytologist 209, 812–822, doi: 10.1111/nph.13631 (2016). - DOI - PubMed
    1. Culver J. N. & Padmanabhan M. S. Virus-induced disease: altering host physiology one interaction at a time. Annual review of phytopathology 45, 221–243, doi: 10.1146/annurev.phyto.45.062806.094422 (2007). - DOI - PubMed
    1. Berenguer M. Outcome of posttransplantation hepatitis C virus disease–is it the host, the virus, or how we modify the host and/or the virus? Liver transplantation : official publication of the American Association for the Study of Liver Diseases and the International Liver Transplantation Society 8, 889–891, doi: 10.1053/jlts.2002.35841 (2002). - DOI - PubMed
    1. Herniou E. A., Olszewski J. A., Cory J. S. & O’Reilly D. R. The genome sequence and evolution of baculoviruses. Annual review of entomology 48, 211–234, doi: 10.1146/annurev.ento.48.091801.112756 (2003). - DOI - PubMed

Publication types