. 2017 Jun;20(6):845-853.
doi: 10.1038/nn.4543. Epub 2017 Apr 10.

Sharp wave ripples during learning stabilize the hippocampal spatial map

Affiliations

Sharp wave ripples during learning stabilize the hippocampal spatial map

Lisa Roux et al. Nat Neurosci. 2017 Jun.

Abstract

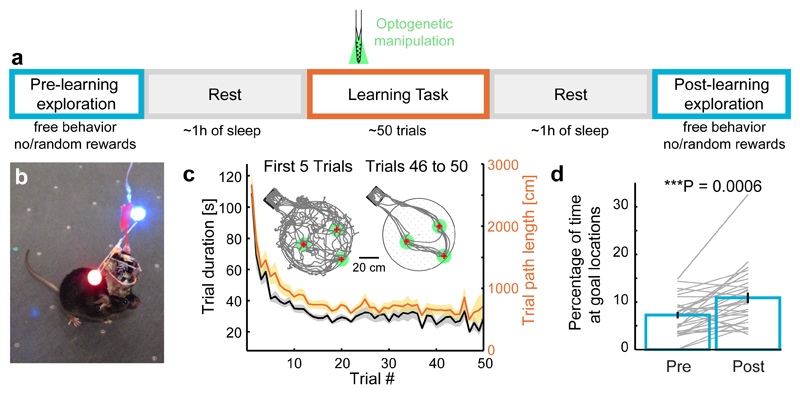
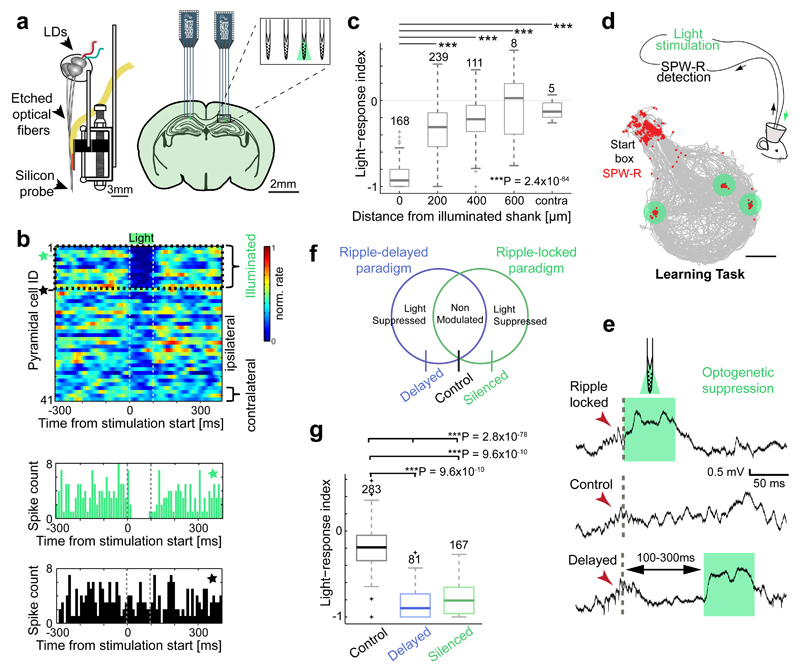
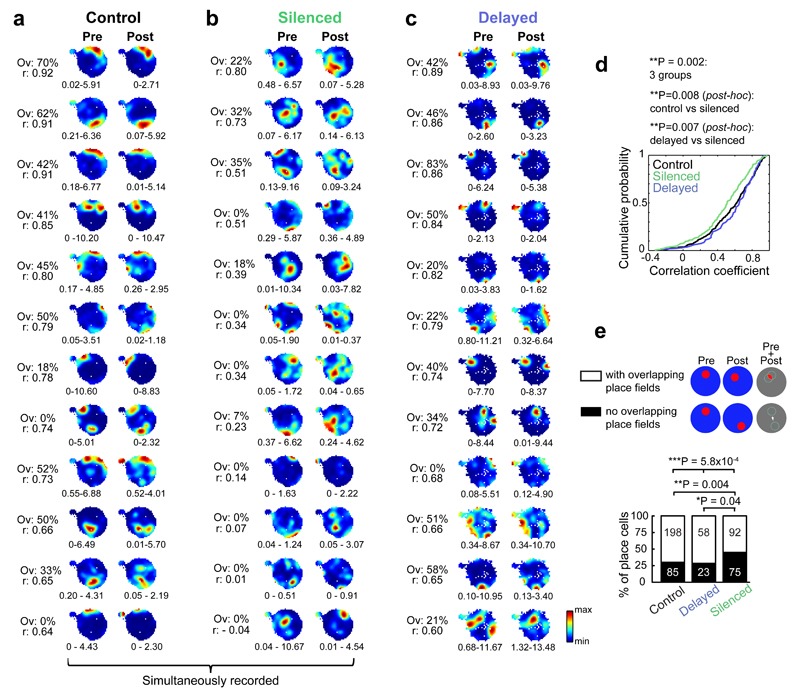
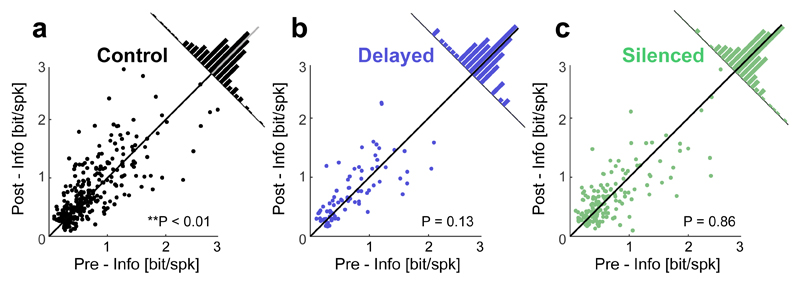
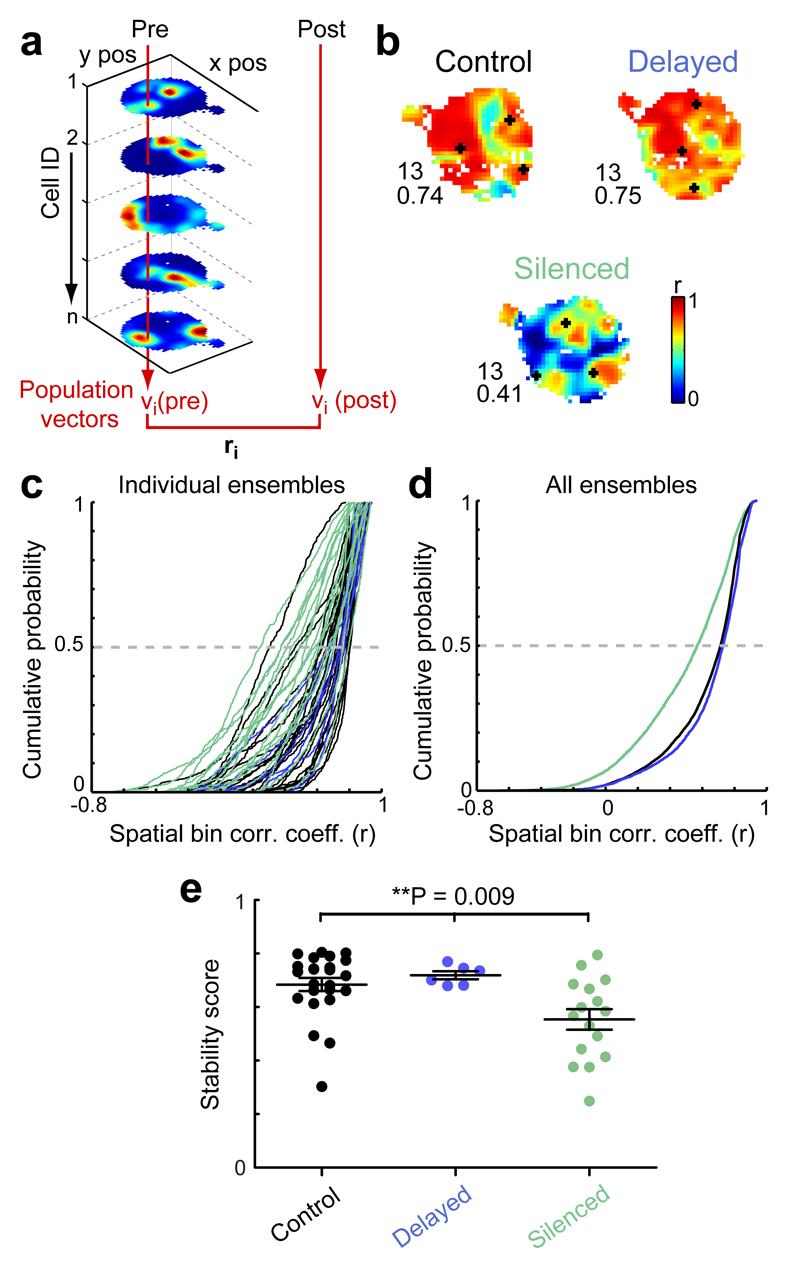
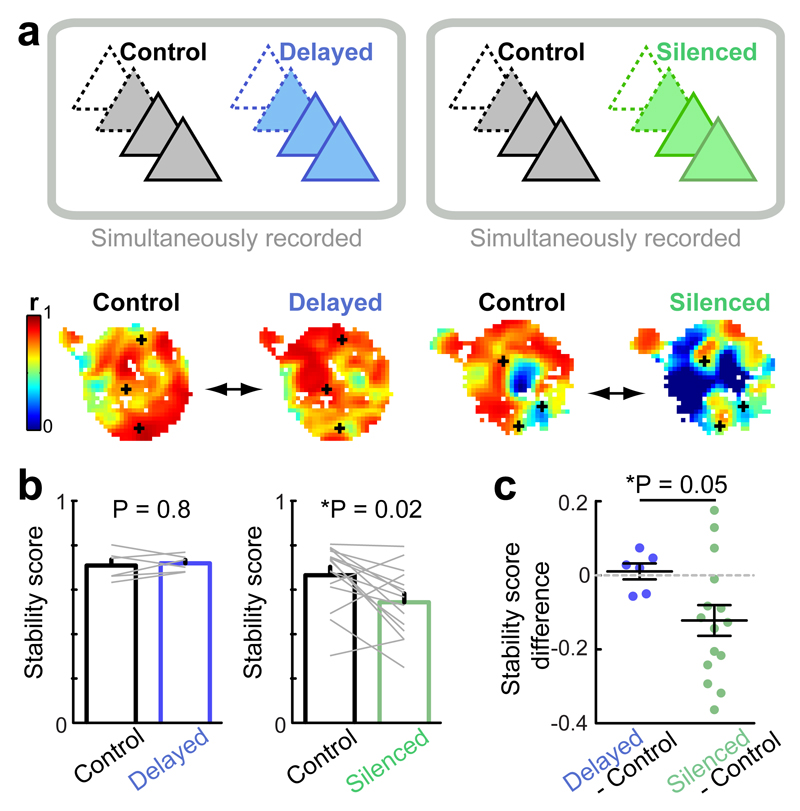
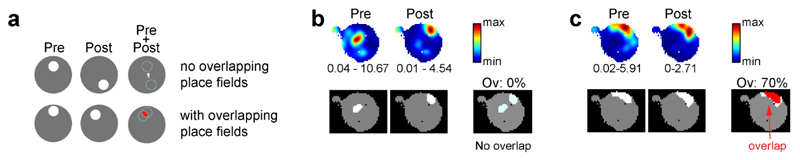
Cognitive representation of the environment requires a stable hippocampal map, but the mechanisms maintaining a given map are unknown. Because sharp wave-ripples (SPW-R) orchestrate both retrospective and prospective spatial information, we hypothesized that disrupting neuronal activity during SPW-Rs affects spatial representation. Mice learned new sets of three goal locations daily in a multiwell maze. We used closed-loop SPW-R detection at goal locations to trigger optogenetic silencing of a subset of CA1 pyramidal neurons. Control place cells (nonsilenced or silenced outside SPW-Rs) largely maintained the location of their place fields after learning and showed increased spatial information content. In contrast, the place fields of SPW-R-silenced place cells remapped, and their spatial information remained unaltered. SPW-R silencing did not impact the firing rates or proportions of place cells. These results suggest that interference with SPW-R-associated activity during learning prevents stabilization and refinement of hippocampal maps.


Figures

Figure 1
Figure 1. Daily spatial learning of hidden reward locations on the cheeseboard maze.
(a) Five steps constituting a daily recording session: (1) pre-learning exploration epoch, (2) rest epoch in home cage, (3) learning task, (4) rest epoch in home cage and (5) post-learning exploration epoch. Optogenetic manipulations were conducted during the learning task. (b) Implanted mouse equipped with blue and red LEDs allowing real-time position tracking. (c) Learning performance during the task. A new set of three baited wells was randomly selected every day but stayed fixed within a given day. Lines with shaded areas show mean ± SEM for n = 29 sessions in 5 mice. (d) Mice spent consistently more time at the goal locations during the first 10 min of the post-learning exploration epoch, compared to the first 10 min of the pre-learning exploration epoch (7.2 ± 0.7 and 10.8 ± 1.1 % of the time for pre and post, respectively; ***P = 0.0006, Wilcoxon’s paired signed rank test, n = 29 sessions in 5 mice).
Figure 2
Figure 2. Closed-loop focal optogenetic silencing of pyramidal cells contingent upon SPW-R detection at goal locations.
(a) Left: Schematic of a diode-probe mounted on a movable drive. Right: Diode-probes were implanted uni- or bilaterally in the dorsal CA1 hippocampal region. (b) Peristimulus histogram (PSTH) for a population of simultaneously recorded pyramidal cells, illustrating the local silencing effect provided by focal light delivery: units recorded on the illuminated shank (top; black dotted line box) are strongly suppressed during illumination. Below are shown examples of PSTHs for a light-suppressed (green star in top panel) and a control (black star in top panel) pyramidal cell. (c) Light response indices as a function of distance from illuminated shank. The number of place cells recorded at each distance is shown above boxes. Indices: -0.88 ± 0.01 (0 µm), -0.34 ± 0.02 (200 µm); -0.24 ± 0.02 (400 µm); -0.06 ± 0.15 (600 µm); -0.11 ± 0.05 (contralateral hemisphere). Kruskall Wallis test: ***P = 2.4 x 10-64; Tukey’s post-hoc tests: neurons from illuminated shank versus 200 µm neurons, ***P = 9.91 x 10⁻⁹; versus 400 µm neurons, ***P = 9.91 x 10⁻⁹ ; versus 600 µm neurons, ***P = 1.05 x 10⁻⁷ ; versus contralateral neurons, ***P = 2.00 x 10⁻⁵; P > 0.05 for all other comparisons; n = 531 place cells. (d) Offline detected SPW-Rs (red dots) are displayed on top of the animal trajectory (gray) for an example learning session. Note that SPW-Rs mainly occur at the goal locations (green disks) and in the start box. 86 ± 2% of all SPW-Rs occurred in the start box (where the mouse stayed mostly immobile) (n = 7 sessions). Light stimuli (60ms) were only triggered by SPW-Rs in the goal areas (green disks). (e) Light stimuli aborted ripples locally (top) but had no effect in the control (non-illuminated shank, middle) and delayed (bottom) condition. The positive deflections in the extracellular signal during light stimuli reflect physiological neuronal hyperpolarization. (f) Schematic illustrating place cell classification into three categories based on experimental paradigm (optogenetic stimulation triggered with or without delay relative to SPW-R detection) and their firing rate modulation by light (see online Methods). (g) Optogenetic silencing effect in the three groups of place cells. Indices: -0.20 ± 0.01 (control), -0.84 ± 0.02 (delayed); -0.78 ± 0.02 (silenced). Kruskall Wallis test: ***P = 2.6 x 10-78. Tukey’s post-hoc tests: control versus delayed, P = 0.52; control versus silenced, ***P = 9.56 x 10⁻¹⁰; delayed versus silenced, ***P = 9.56 x 10⁻¹⁰; n = 283, 81,167 control, delayed and silenced place cells.
Figure 3
Figure 3. Silencing neurons during SPW-Rs impairs place map stability of place cells.
(a-c) Examples of firing rate maps obtained from the pre- and post-learning exploration epochs in example sessions for individual control (a), silenced (b) and delayed (c) place cells. The correlation coefficient (r), calculated by comparing firing rate maps in pre and post-learning exploration epochs, and the percentage of overlap (Ov) between the place fields detected in these two epochs, is shown for each place cell on the left. 0% overlap indicates shifting place fields (“no overlapping place fields” in e). Twelve place cells with the highest r values in each category are depicted. Control and silenced place cells (a and b) were recorded during the same session. (d) Cumulative distributions of the r values obtained for individual place cells in the three groups. Kruskall Wallis test: **P = 0.002; Tukey’s post-hoc tests: **P = 0.008 (control vs silenced), **P = 0.007 (delayed vs silenced), P = 0.62 (control vs delayed); n = 283 control, n = 81 delayed and n = 167 SPW-R silenced place cells. (e) Proportions of place cells with shifting fields (no overlapping place fields, black) or overlapping place fields (white) in the three groups of place cells. The number of cells in each category is indicated on the bars. χ2 test: ***P = 5.8 x 10⁻⁴; post-hoc two-sided Fisher’s exact tests followed by Bonferroni correction: **P = 0.004 (control vs silenced), *P = 0.04 (delayed vs silenced), P = 1 (control vs delayed).
Figure 4
Figure 4. SPW-R silencing impact information measures of place cells.
(a-c) Distributions of “information content” values carried by place cells during pre- and post-learning exploration epochs. The information content of silenced place cells (c) remained similar across pre- and post-learning exploration epochs (0.68 ± 0.04 and 0.67 ± 0.04 bit/spk for pre and post, respectively; Wilcoxon’s paired signed rank test: P = 0.86; n = 167 SPW-R silenced place cells) while control place cells (a) showed an increased information content (control group: 0.74 ± 0.03 and 0.80 ± 0.03 bit/spk for pre and post, respectively; delayed group: 0.70 ± 0.05 and 0.75 ± 0.05 bit/spk; P = 0.007, P = 0.13 for control and delayed groups, respectively; n = 283 control, n = 81 delayed silenced place cells). Two outlier values in the silenced and control groups are not displayed but included in the statistical analyses (their exclusion does not affect the conclusions).
Figure 5
Figure 5. Silencing neurons during SPW-Rs impairs place map stability of place cell ensembles.
(a) Schematic illustrating population vector analysis method. For each spatial bin i, a population vector vi was constructed containing the rates in the bin i of each cell of the ensemble. This was done for all spatial bins, separately for the rate maps of the pre- and post-learning exploration epochs. Then, for each spatial bin i, the Pearson correlation (ri) between vi(pre) and vi(post) was computed. ri indicates the stability of the ensemble spatial representation at pixel i. Correlation maps were constructed by assigning the r values to their respective positions in x and y. (b) Examples of correlation maps obtained for ensembles of control, delayed and silenced place cells. Correlation values of individual spatial bins (r) are color coded. The number of cells part of the ensemble and the stability score, defined as the median of all bins’ correlation values (r), are indicated on the left of each map. Goal locations are indicated by black crosses. (c) Cumulative distribution of population correlation values across spatial bins for individual ensembles of place cells. n = 24 control (black), 6 delayed (blue) and 16 silenced ensembles of place cells (green). (d) Cumulative distributions of the correlation values accumulated for all ensembles of place cells from the three groups. (e) Stability scores for the individual ensembles of place cells shown in (c). Kruskall Wallis test: **P = 0.009; Tukey’s post-hoc tests: *P = 0.013 (control vs silenced), P = 0.94 (control vs delayed), P = 0.068 (delayed vs silenced).
Figure 6
Figure 6. SPW-R silenced ensembles of place cells show destabilized spatial representation as compared to simultaneously recorded control ensembles.
(a) Top: Schematic illustrating the method used for within-session comparison of place cell ensemble pairs. Bottom: Examples of correlation maps for pairs of ensembles, simultaneously recorded within the same session (left, ensembles of control and delayed place cells; right, ensembles of control and silenced place cells) (b) Left: Ensembles of delayed place cells show similar stability scores to their matched control from the same recording session (score: 0.71 ± 0.03 and 0.72 ± 0.02 for control and delayed ensembles, respectively; Wilcoxon’s paired signed rank test: P = 0.84, n = 6 pairs). Right: In contrast, ensembles of silenced place cells show a lower stability score compared to their matched control ensembles (score: 0.67 ± 0.04 and 0.54 ± 0.04 for control and silenced ensembles, respectively; *P = 0.015, n = 15 pairs). (c) Within-session differences between the stability scores of optogenetically manipulated ensembles and their matched control ensembles (0.01 ± 0.02 for delayed-control pairs and -0.12 ± 0.04 for silenced-control pairs). Mann-Whitney U test: *P = 0.047. Dashed grey line indicates zero level (no difference).
Method Figure 1
Method Figure 1. Place field overlap calculation method and examples.
a. Schematic illustrating the method used to compute place field overlap for a place cell with non-overlapping place fields (top) and a place cell with overlapping place fields (bottom). b-c. Examples of place cells with non-overlapping (b) and overlapping (c) place fields. Firing rate maps are shown for the pre- and post-exploration epochs (top; minimum and maximum rates are indicated below each map) with their corresponding detected place fields (white areas) below. The sum of the ‘pre’ and ‘post’ place fields, with (b) or without (b) overlap (red), is depicted on the right.

References

    1. O'Keefe J, Nadel L. Book The Hippocampus as a Cognitive Map. Oxford University Press; 1978.
    1. Wilson MA, McNaughton BL. Dynamics of the hippocampal ensemble code for space. Science. 1993;261:1055–1058. - PubMed
    1. Trouche S, Perestenko PV, van de Ven GM, Bratley CT, McNamara CG, et al. Recoding a cocaine-place memory engram to a neutral engram in the hippocampus. Nat Neurosci. 2016;19:564–567. - PMC - PubMed
    1. Buzsaki G, Leung LW, Vanderwolf CH. Cellular bases of hippocampal EEG in the behaving rat. Brain Res. 1983;287:139–171. - PubMed
    1. Wilson MA, McNaughton BL. Reactivation of hippocampal ensemble memories during sleep. Science. 1994;265:676–679. - PubMed

LinkOut - more resources