. 2017 May;49(5):780-788.
doi: 10.1038/ng.3838. Epub 2017 Apr 10.

Spatial heterogeneity in medulloblastoma

A Sorana Morrissy  1   2 Florence M G Cavalli  1   2 Marc Remke  1   2   3   4   5 Vijay Ramaswamy  1   2   6 David J H Shih  1   2   7 Borja L Holgado  1   2 Hamza Farooq  1   2   7 Laura K Donovan  1   2 Livia Garzia  1   2   8 Sameer Agnihotri  9 Erin N Kiehna  10 Eloi Mercier  11 Chelsea Mayoh  11 Simon Papillon-Cavanagh  12 Hamid Nikbakht  12 Tenzin Gayden  12 Jonathon Torchia  2   6   7 Daniel Picard  3   4   5 Diana M Merino  2   6   13 Maria Vladoiu  1   2 Betty Luu  1   2 Xiaochong Wu  1   2 Craig Daniels  1 Stuart Horswell  14 Yuan Yao Thompson  1   2   7 Volker Hovestadt  15 Paul A Northcott  16 David T W Jones  16 John Peacock  1   2   7 Xin Wang  1   2   7 Stephen C Mack  1   2   7 Jüri Reimand  17   18   19 Steffen Albrecht  20 Adam M Fontebasso  21 Nina Thiessen  11 Yisu Li  11 Jacqueline E Schein  11 Darlene Lee  11 Rebecca Carlsen  11 Michael Mayo  11 Kane Tse  11 Angela Tam  11 Noreen Dhalla  11 Adrian Ally  11 Eric Chuah  11 Young Cheng  11 Patrick Plettner  11 Haiyan I Li  11 Richard D Corbett  11 Tina Wong  11 William Long  11 James Loukides  2 Pawel Buczkowicz  22 Cynthia E Hawkins  2   22 Uri Tabori  2   6 Brian R Rood  23 John S Myseros  24 Roger J Packer  25 Andrey Korshunov  26 Peter Lichter  15   27 Marcel Kool  16 Stefan M Pfister  16   27   28 Ulrich Schüller  29   30   31 Peter Dirks  2   10 Annie Huang  2   6 Eric Bouffet  2   6 James T Rutka  2   7   10 Gary D Bader  19 Charles Swanton  32   33 Yusanne Ma  11 Richard A Moore  11 Andrew J Mungall  11 Jacek Majewski  21 Steven J M Jones  11   34   35 Sunit Das  1   2   36 David Malkin  6 Nada Jabado  21 Marco A Marra  11   34 Michael D Taylor  1   2   7
Affiliations

Spatial heterogeneity in medulloblastoma

A Sorana Morrissy et al. Nat Genet. 2017 May.

Abstract

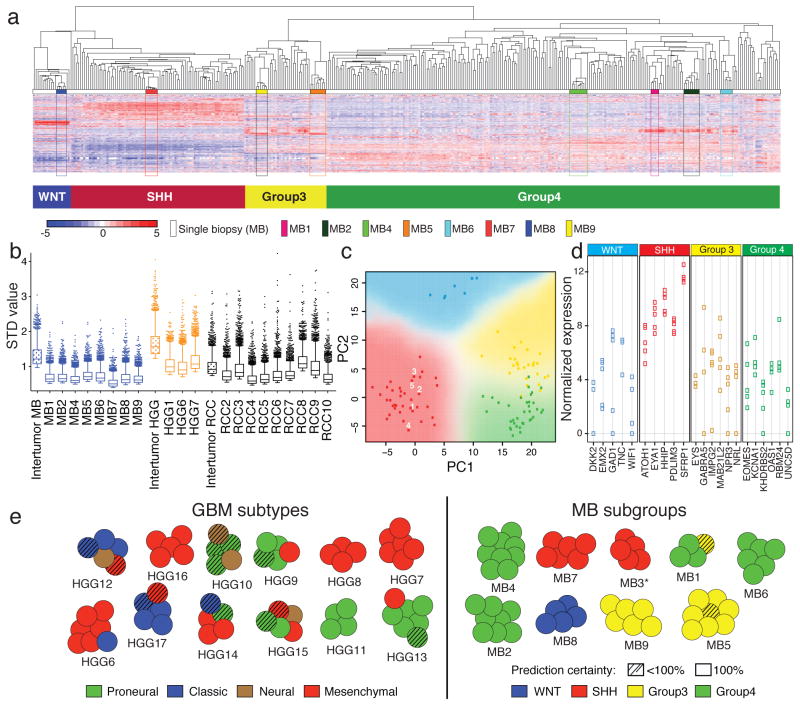
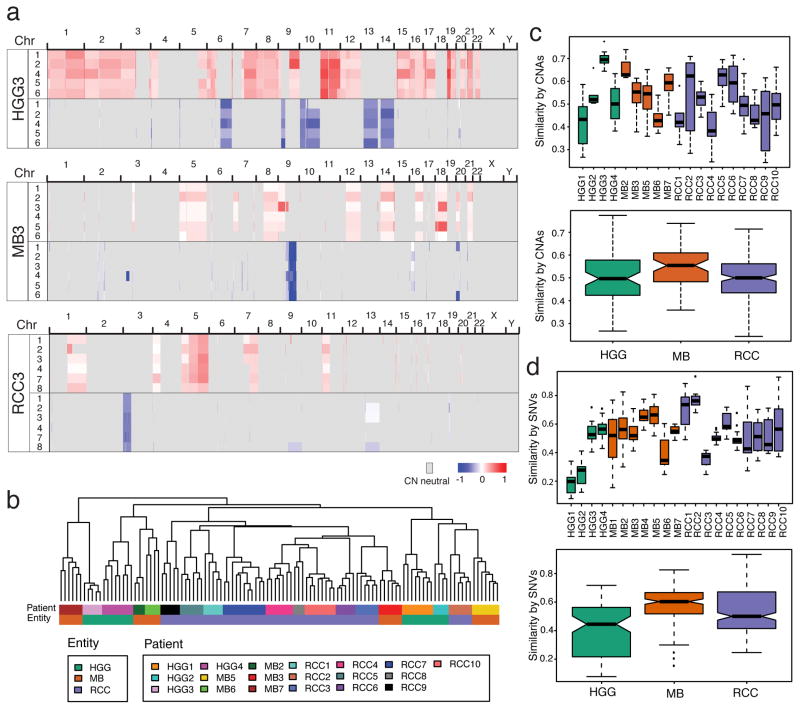
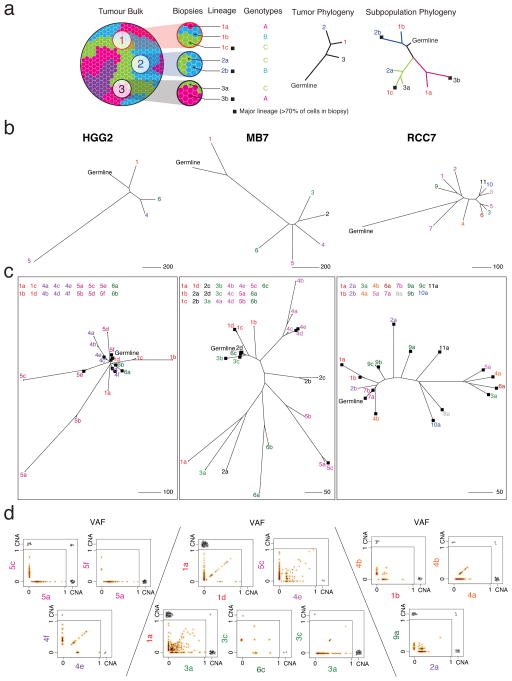
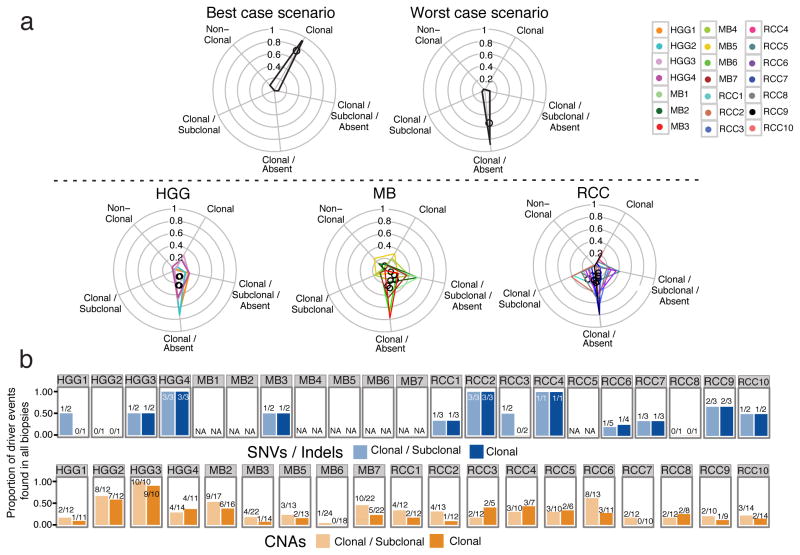
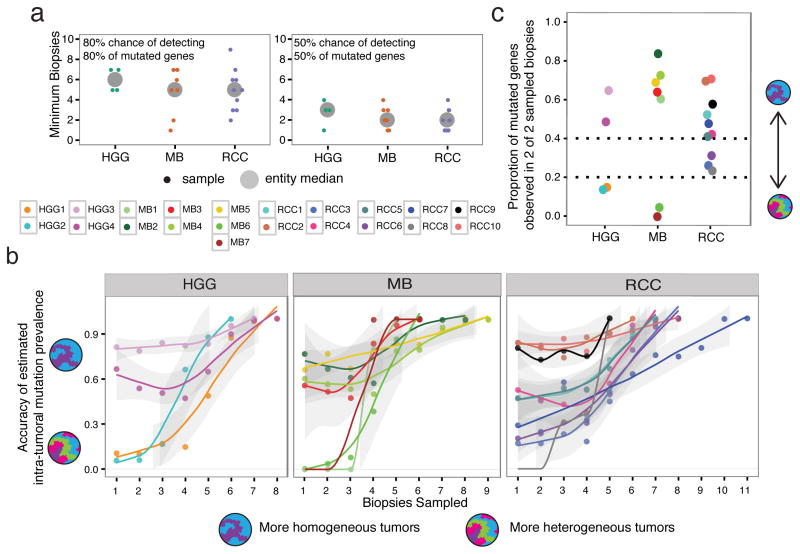
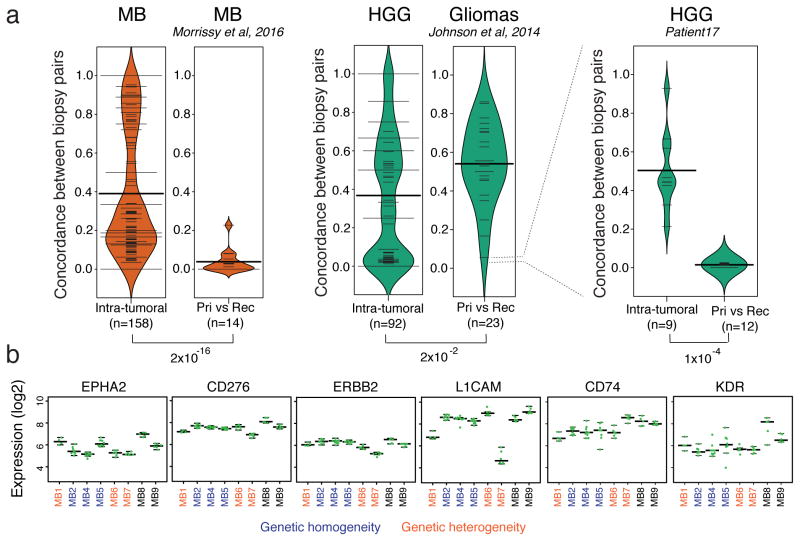
Spatial heterogeneity of transcriptional and genetic markers between physically isolated biopsies of a single tumor poses major barriers to the identification of biomarkers and the development of targeted therapies that will be effective against the entire tumor. We analyzed the spatial heterogeneity of multiregional biopsies from 35 patients, using a combination of transcriptomic and genomic profiles. Medulloblastomas (MBs), but not high-grade gliomas (HGGs), demonstrated spatially homogeneous transcriptomes, which allowed for accurate subgrouping of tumors from a single biopsy. Conversely, somatic mutations that affect genes suitable for targeted therapeutics demonstrated high levels of spatial heterogeneity in MB, malignant glioma, and renal cell carcinoma (RCC). Actionable targets found in a single MB biopsy were seldom clonal across the entire tumor, which brings the efficacy of monotherapies against a single target into question. Clinical trials of targeted therapies for MB should first ensure the spatially ubiquitous nature of the target mutation.


Conflict of interest statement

Conflict of Interest: The authors declare no conflicts of interest.

Competing Financial Interests

The authors declare no competing financial interests.

Figures

Figure 1
Figure 1. Medulloblastomas, but not glioblastomas, show reliable transcriptome-based subgroup prediction
(a) Unsupervised HCL using 1,000 high–SD transcripts of eight multi-region medulloblastoma (MB) samples combined with single biopsies (n=334) demonstrates tight clustering of matched multi-region MB samples across subgroups. (b) Box plot of the top 2000 SD-transcript values determined on an intra- and inter-tumor level in MB, HGG and RCC. (c) Principal component analysis (PCA) using 22 MB subgroup marker genes confirms a low degree of transcriptional intra-tumoral heterogeneity exemplified in MB3. Multi-region biopsy numbers of MB3 are indicated, and PCA was conducted with 103 single biopsy samples analyzed by NanoString. (d) Dot plot illustrating highly comparable marker gene expression in all multi-region biopsies for MB3. (e) Illustration showing GBM subtype and MB subgroup predictions based on Predictive Analysis of Microarrays (PAM) results. SHH subgroup affiliation of MB3 (marked with a *) was inferred based on NanoString results. Hashed circles are biopsies with <100% prediction confidence.
Figure 2
Figure 2. Variable intra-tumoral heterogeneity of somatic aberrations in all tumor entities
Genome wide analysis of copy number aberrations does not recapitulate the striking expression-based spatial homogeneity of MBs. (a) Copy number segments of gain (red) or loss (blue) are shown across the genome of three individual patients for each biopsy. (b) Unsupervised HCL of copy number segments show tight clustering of individual biopsies across all tumors in the cohort. Intra-tumoral heterogeneity measured from CNA’s (c) or SNVs (d), both in individual patients (top panels) and summarized by entity (lower panels) shows that tumors in all entities range from high spatial similarity (e.g. HGG3, MB2) to low (e.g. HGG1, RCC3). Similarity is measured as the binary distance between all pairs of tumor-matched biopsies.
Figure 3
Figure 3. Spatial intermixing of clonal lineages
(a) Example cartoon of a tumor with four clonal lineages that are spatially dispersed (blue, green, pink, purple) demonstrates how data from three biopsies are used to build a typical biopsy-level phylogenetic tree as well as a subpopulation-level tree reflecting inter-mixing of the three detected genetic lineages. Branch tips are colored according to biopsy number and labeled according to biopsy number (1,2,3…) and clonal lineage (a,b,c…). Branch colors correspond to the cellular genotype; black squares indicate major cellular lineages (>70% of tumor cells in the biopsy, scaled by the largest detectable population). Note that the number of biopsies may not be sufficient to ‘discover’ all distinct clonal lineages (e.g. purple clone). (b) Biopsy-level trees of three representative tumors; MB7, HGG2, and RCC7. (c) Subpopulation-level trees reveal that some cellular lineages have high similarity to lineages in other biopsies, suggesting spatial intermixing (e.g. MB7 biopsy 1,2,3; RCC7 biopsy 4). Conversely, some biopsies harbor >1 distinct lineage (e.g. HGG2 biopsy 5). (d) Variant allele frequency (VAF) of mutations are shown along with copy number aberrations exclusive to or shared by pairs of biopsies or subpopulations. VAF scatter plots have a smoothed color density; black dots represent individual mutations. CNA events (black triangles) are displayed (with some jitter) if present in either compartment, or shared.
Figure 4
Figure 4. Genetically distinct clonal lineages yield ON/OFF mutation patterns between spatially separated biopsies
(a) Non-synonymous mutations are binned into 5 categories: those clonal in all biopsies (Clonal); clonal in some biopsies and sub-clonal in others (Clonal/Subclonal); clonal in some biopsies and completely absent in others (Clonal/Absent); clonal in some biopsies, sub-clonal in others, and absent in others (Clonal/Subclonal/Absent); and those never detected as clonal (Non-Clonal). Upper panel: illustration of the most favorable clinical scenario in which most mutations are clonal across all biopsies (left), and the worst-case scenario where mutations are clonal in some biopsies but absent in others (right). Lower panel: Mutation patterns follow a worst-case scenario across tumor types. Tumor-specific polygons on radial plots indicate the proportion of mutations on each of the 5 axes, with polygon centers marked by a black circle. (b) Barplots of the proportion of driver mutations/indels (top panel) or CNAs (lower panel) that are found in every biopsy of a given tumor (i.e. trunk events) when considering the clonal and subclonal or only clonal driver events. The absolute numbers are shown above the bars.
Figure 5
Figure 5. Quantification of variable genetic heterogeneity across tumor entities
(a) Considering all mutated genes (from the list of actionable targets) identified in each tumor across all biopsies, individual tumors require an average of 5 biopsies to have an 80% likelihood of recovering 80% of the known mutated genes (top panel). At least 2 biopsies are required to achieve a 50% likelihood of recovering 50% of mutated genes (bottom panel). Small points: individual samples; large points: tumor entity median. (b) The likelihood of correctly inferring the frequency of a mutation in the whole tumor depends on the number of biopsies sampled, and whether the tumor is more or less genetically homogeneous. The accuracy of frequency prediction for brain tumors shows a bi-modal pattern, with low genetic variance tumors having a higher accuracy (>0.6) even with few biopsies, while high genetic variance tumors require at least 5 biopsies to achieve the same confidence (HGG and MB panels). RCC tumors additionally show an intermediate pattern. Accuracy is measured as the proportion of times that a gene’s observed frequency in a selection of biopsies is within 10% of the known frequency across all biopsies. Lines represent a Loess fit to the points per tumor, with a 95% confidence interval (grey outline). (c) Considering a random selection of 2 biopsies, patients are ranked using the proportion of mutated genes (from the actionable target list) that are present in both biopsies. Patients with genetically heterogeneous tumors have median values <0.2. Points represent the median value of all possible biopsy pairs per patient.
Figure 6
Figure 6. Genetic heterogeneity at recurrence greatly exceeds spatial heterogeneity in MB
(a) The genetic concordance of pre- vs post-therapy biopsies (from Morrissy et al, 2016) is an order of magnitude lower than up-front genetic spatial heterogeneity, in MB samples (p<10−16; Welch two sample t-test; n=14 primary-recurrence pairs; n=158 spatial comparisons from 7 tumors). HGG tumors in our cohort showed a similar overall distribution of spatial heterogeneity (n=92 comparisons from 4 tumors), and not dramatically different compared to the low concordance of low-grade gliomas (LGG) to HGG post-therapy (n=23 glioma primary-relapse pairs, Johnson et al, 2014). One LGG relapse to HGG exhibited post-therapeutic genetic concordance values on par with MBs (p<10−4; Welch two sample t-test; n=12 primary-relapse comparisons from Patient17; n=9 spatial comparisons). Concordance is measured as the proportion of clonal somatic mutations in common between a pair of biopsies given the total number of clonal somatic mutations in the two samples. Width of bean plots scale with the number of measurements with a similar y-value, showing data distribution. Thin horizontal lines indicate individual observations; multiple observations with the same value are added together to form wider lines; thick horizontal black bars indicate averages. (b) Low expression variance is observed across multi-region biopsies of cell surface molecules with immunotherapies currently in clinical trials. This indicates that tumors with high genetic spatial heterogeneity may respond well to CAR T-cell or antibody-based therapy. Green points mark expression of target genes in individual biopsies; long horizontal lines: median expression per tumor; lower and upper short horizontal lines: 25th and 75th percentiles of expression per tumor.

References

    1. Northcott PA, et al. Medulloblastoma Comprises Four Distinct Molecular Variants. J Clin Oncol. 2011;29:1408–1414. doi: 10.1200/JCO.2009.27.4324. - DOI - PMC - PubMed
    1. Kleinman CL, et al. Fusion of TTYH1 with the C19MC microRNA cluster drives expression of a brain-specific DNMT3B isoform in the embryonal brain tumor ETMR. Nature genetics. 2014;46:39–44. doi: 10.1038/ng.2849. - DOI - PubMed
    1. Versteege I, et al. Truncating mutations of hSNF5/INI1 in aggressive paediatric cancer. Nature. 1998;394:203–206. doi: 10.1038/28212. - DOI - PubMed
    1. Pietsch T, et al. Prognostic significance of clinical, histopathological, and molecular characteristics of medulloblastomas in the prospective HIT2000 multicenter clinical trial cohort. Acta neuropathologica. 2014 doi: 10.1007/s00401-014-1276-0. - DOI - PMC - PubMed
    1. Remke M, Ramaswamy V, Taylor MD. Medulloblastoma molecular dissection: the way toward targeted therapy. Current opinion in oncology. 2013;25:674–681. doi: 10.1097/CCO.0000000000000008. - DOI - PubMed

MeSH terms