. 2017 Jun;28(6):713-722.
doi: 10.1177/0956797617693004. Epub 2017 Apr 10.

Predicting Ideological Prejudice

Affiliations

Predicting Ideological Prejudice

Mark J Brandt. Psychol Sci. 2017 Jun.

Abstract

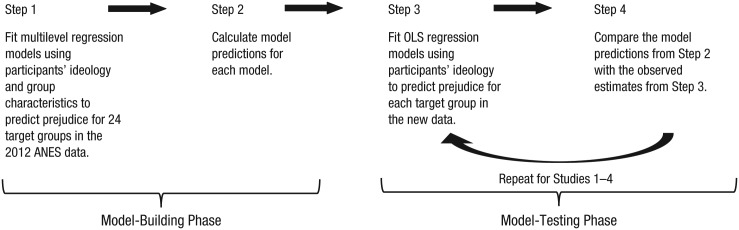
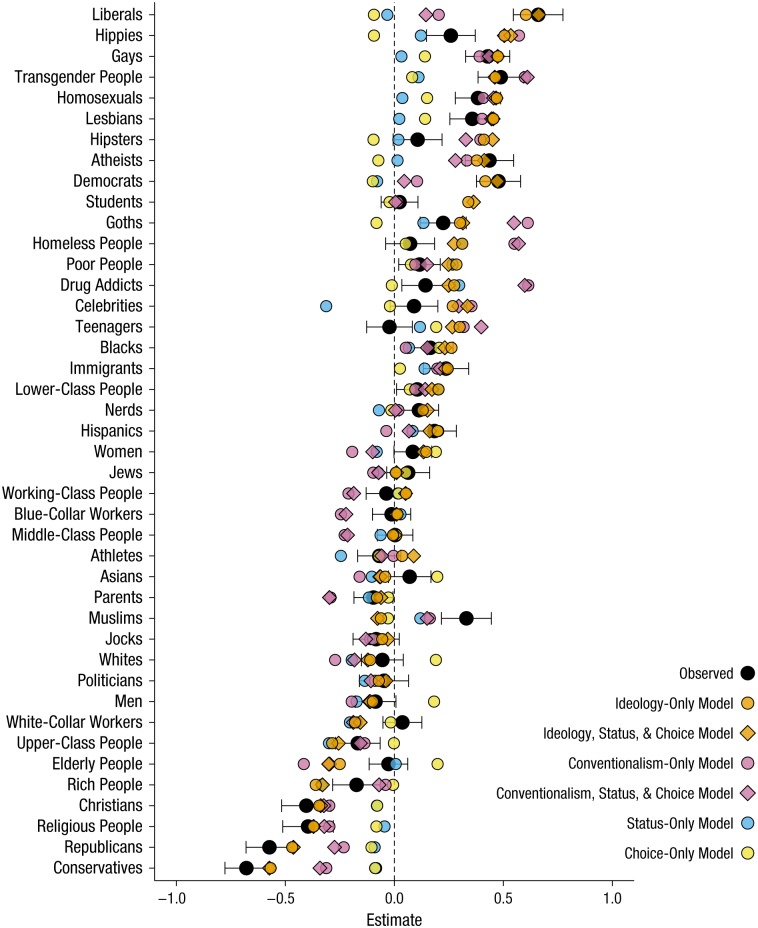
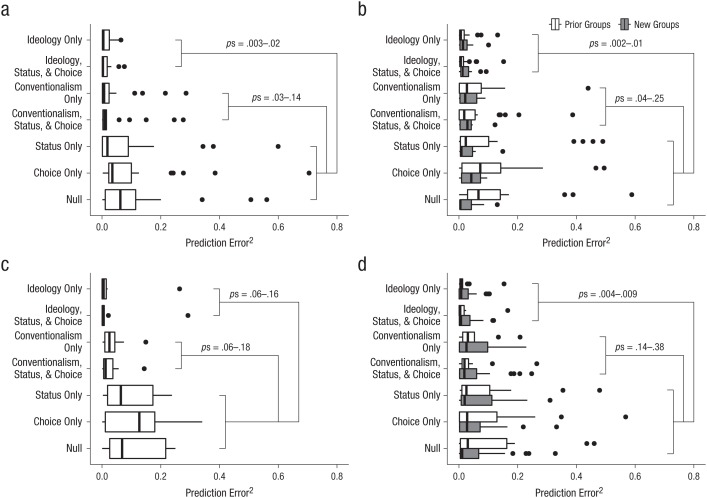
A major shortcoming of current models of ideological prejudice is that although they can anticipate the direction of the association between participants' ideology and their prejudice against a range of target groups, they cannot predict the size of this association. I developed and tested models that can make specific size predictions for this association. A quantitative model that used the perceived ideology of the target group as the primary predictor of the ideology-prejudice relationship was developed with a representative sample of Americans ( N = 4,940) and tested against models using the perceived status of and choice to belong to the target group as predictors. In four studies (total N = 2,093), ideology-prejudice associations were estimated, and these observed estimates were compared with the models' predictions. The model that was based only on perceived ideology was the most parsimonious with the smallest errors.

Keywords: ideology; intergroup dynamics; open data; open materials; prejudice; preregistered; stereotyped attitudes.


Conflict of interest statement

Declaration of Conflicting Interests: The author declared that he had no conflicts of interest with respect to his authorship or the publication of this article.

Figures

Fig. 1.
Fig. 1.
Summary of the procedure. In the model-building phase, multilevel regression models were used to estimate the association between participants’ ideology and their prejudice against each of 24 target groups. The data for this phase came from the 2012 Times Series Study of the American National Elections Studies (ANES). In the model-testing phase, ordinary least squares (OLS) regression was used to model the association between participants’ ideology and their prejudice against various target groups. The observed estimates obtained from these models in four studies were compared with the predictions from the original model.
Fig. 2.
Fig. 2.
Comparison of the predicted and observed estimates for the association between ideology and prejudice toward the target groups in Study 4. The observed estimates were obtained using ordinary least squares regression, adjusting for age, gender, education, income, and race-ethnicity. The predicted estimates were obtained from the models described in Table 1. The dashed vertical line represents the predictions of the null model. All variables were coded to have a range of 1. Error bars represent 95% confidence intervals. The target groups are ordered from the group perceived as most liberal (top) to the group perceived as most conservative (bottom).
Fig. 3.
Fig. 3.
Box plots of the seven models’ squared prediction error in (a) Study 1 (23 target groups), (b) Study 2 (35 target groups), (c) Study 3 (9 target groups), and (d) Study 4 (42 target groups). For Studies 1, 2, and 4, results are shown separately for new and original target groups, but because of the small number of target groups in Study 3, results for new and original target groups are combined. In each plot, the right and left edges of the box indicate the 75th and 25th percentiles, respectively, and the black line near the middle of the box is the 50th percentile. The whiskers represent the lowest and highest data points within 1.5 times the interquartile range of the lowest quartile and the highest quartile, respectively. The circles represent outliers. The ranges of p values indicate the values obtained when the two ideology models and the two conventionalism models were compared individually with the status-only, choice-only, and null models.

References

    1. American National Election Studies. (2015). The ANES 2012 Time Series Study [Data file]. Stanford University and the University of Michigan; (Producers). Retrieved from http://www.electionstudies.org/studypages/anes_timeseries_2012/anes_time...
    1. American National Election Studies. (2016). The ANES 2016 Pilot Study [Data file]. Stanford University and the University of Michigan; (Producers). Retrieved from http://www.electionstudies.org/studypages/anes_pilot_2016/anes_pilot_201...
    1. Bates D., Maechler M., Bolker B., Walker S. (2015). Fitting linear mixed-effects models using lme4. Journal of Statistical Software, 67, 1–48.
    1. Berinsky A. J., Huber G. A., Lenz G. S. (2012). Evaluating online labor markets for experimental research: Amazon.com’s Mechanical Turk. Political Analysis, 20, 351–368.
    1. Brandt M. J., Crawford J. T. (2016). Answering unresolved questions about the relationship between cognitive ability and prejudice. Social Psychological and Personality Science, 7, 884–892.

LinkOut - more resources