. 2017 Apr 10;12(4):e0175142.
doi: 10.1371/journal.pone.0175142. eCollection 2017.

Exploring binaural hearing in gerbils (Meriones unguiculatus) using virtual headphones

Affiliations

Exploring binaural hearing in gerbils (Meriones unguiculatus) using virtual headphones

Sandra Tolnai et al. PLoS One. .

Abstract

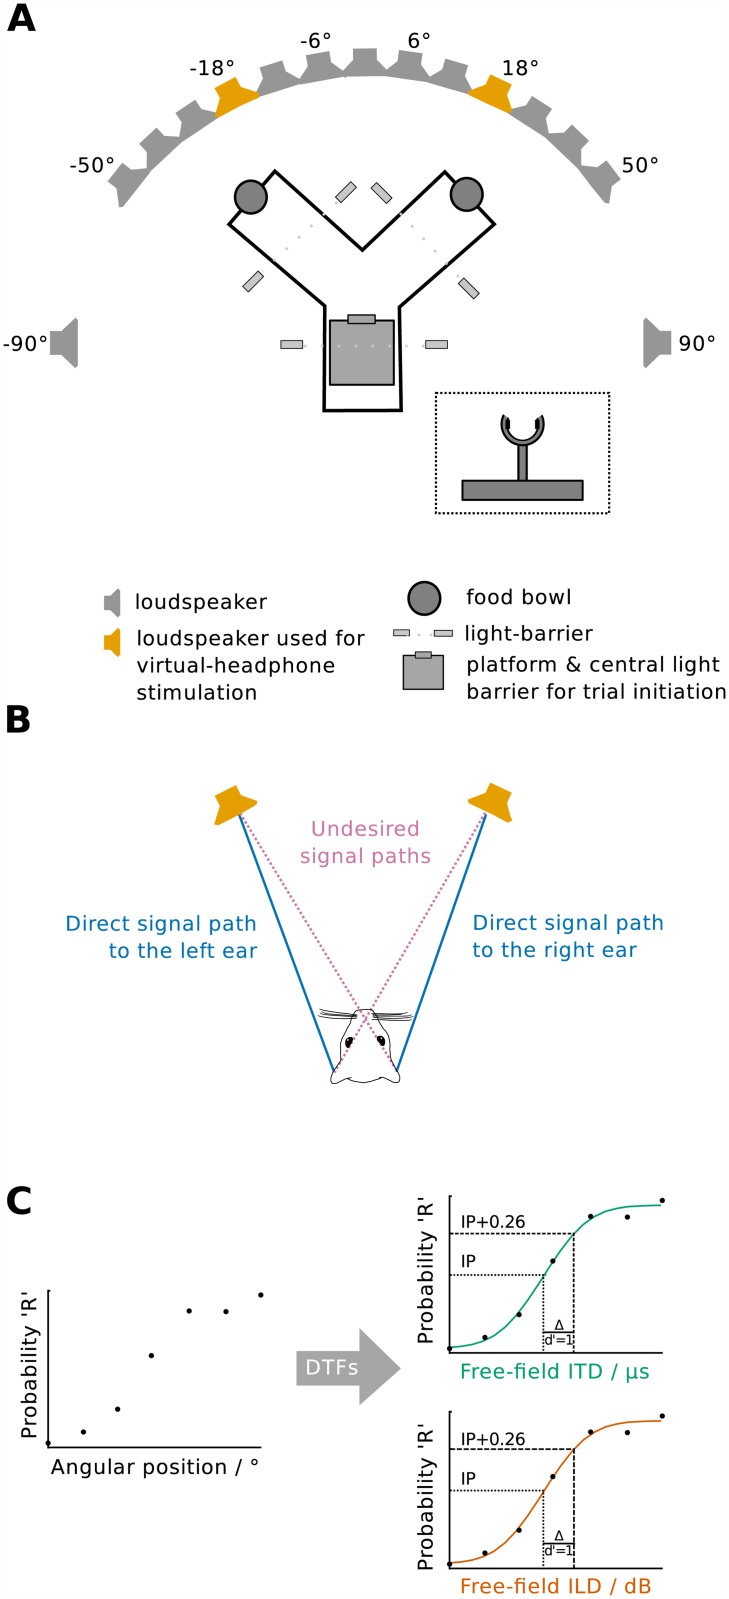
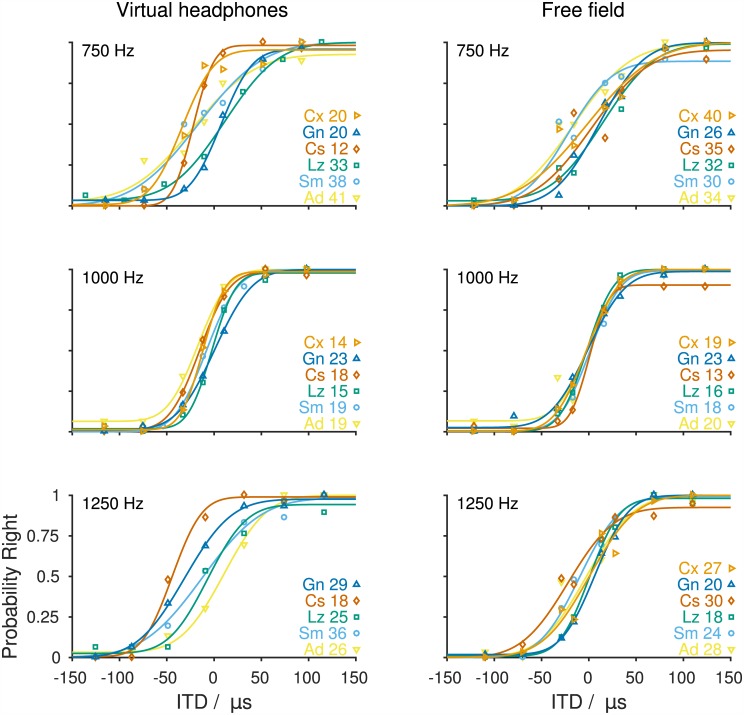
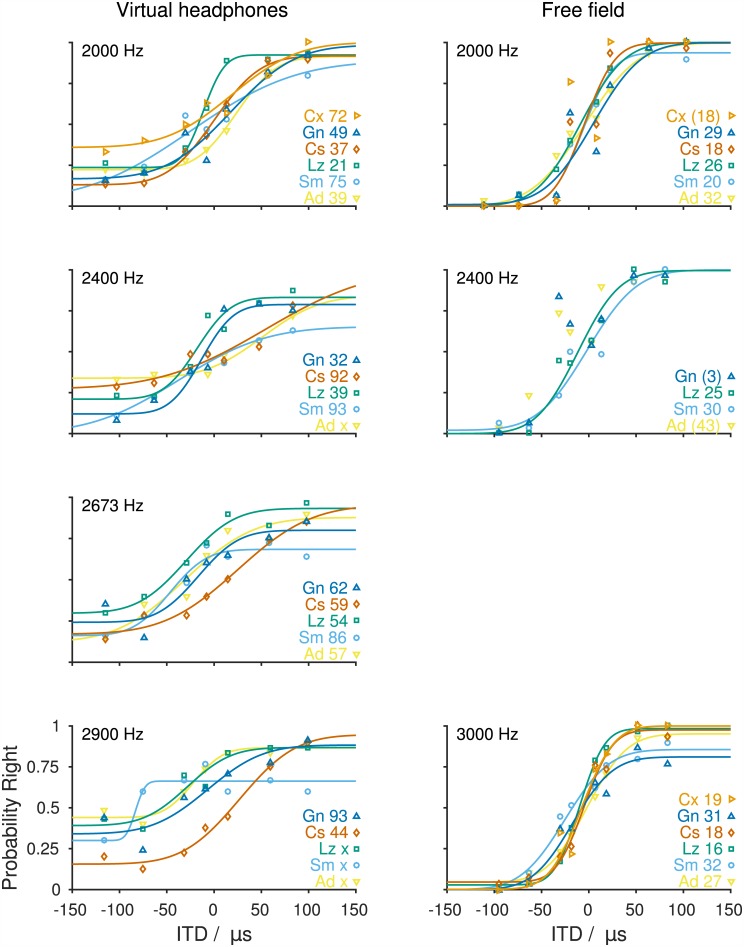
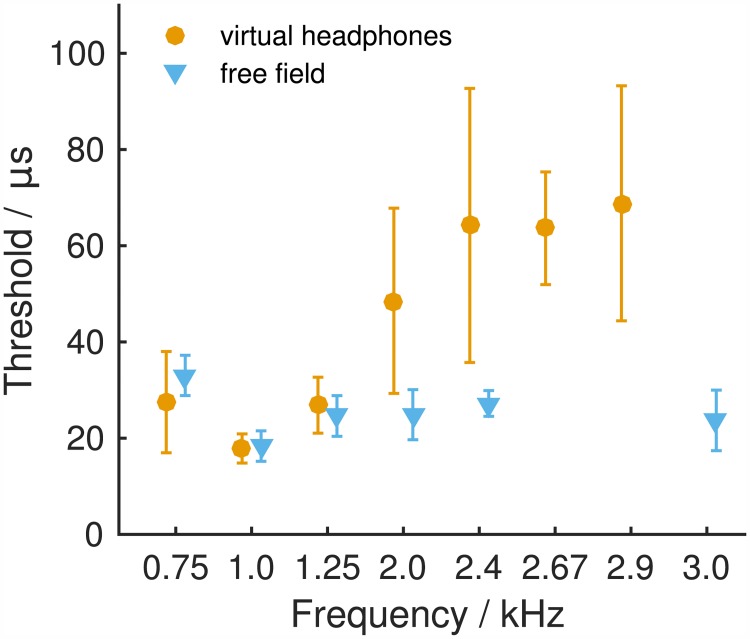
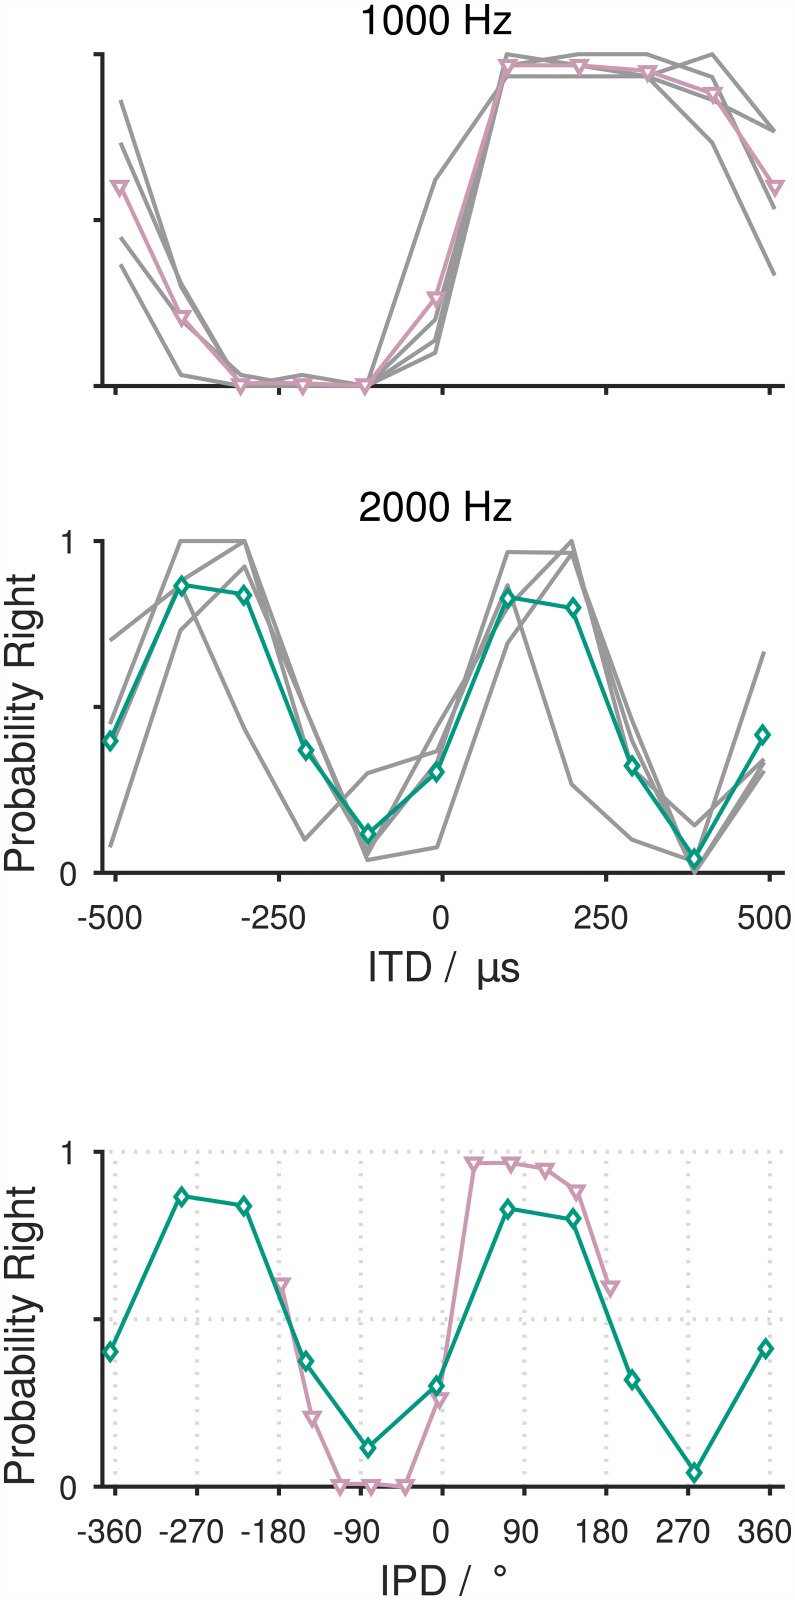
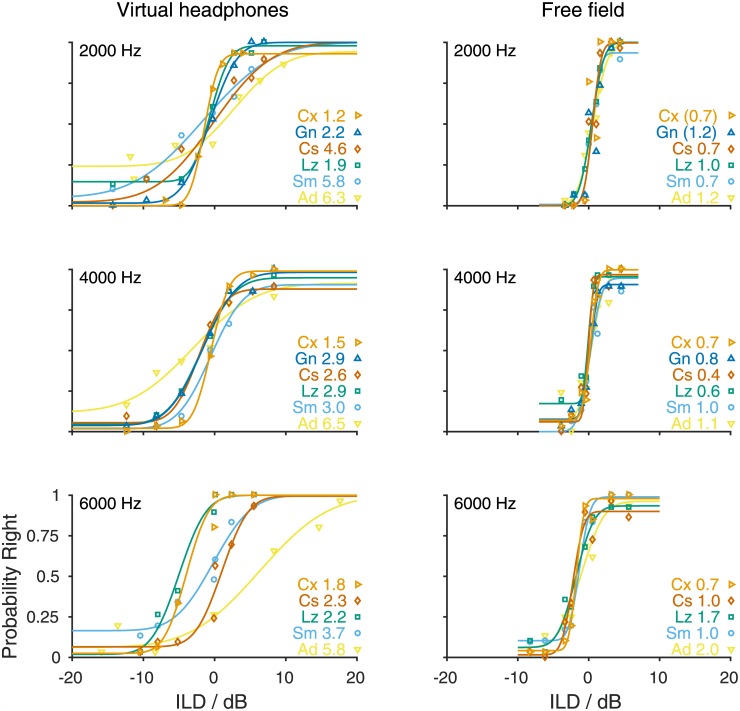
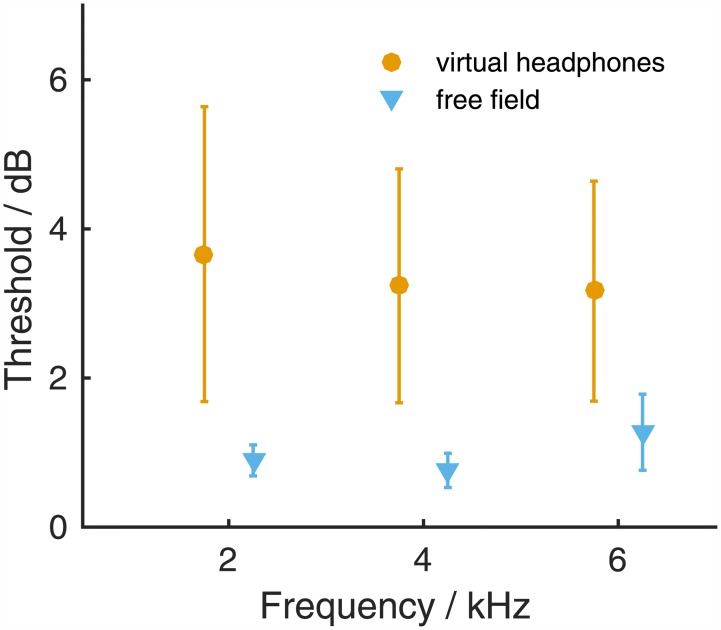
The Mongolian gerbil (Meriones unguiculatus) has become a key species in investigations of the neural processing of sound localization cues in mammals. While its sound localization has been tested extensively under free-field stimulation, many neurophysiological studies use headphones to present signals with binaural localization cues. The gerbil's behavioral sensitivity to binaural cues, however, is unknown for the lack of appropriate stimulation paradigms in awake behaving gerbils. We close this gap in knowledge by mimicking a headphone stimulation; we use free-field loudspeakers and apply cross-talk cancellation techniques to present pure tones with binaural cues via "virtual headphones" to gerbils trained in a sound localization task. All gerbils were able to lateralize sounds depending on the interaural time or level difference (ITD and ILD, respectively). For ITD stimuli, reliable responses were seen for frequencies ≤2.9 kHz, the highest frequency tested with ITD stimuli. ITD sensitivity was frequency-dependent with the highest sensitivity observed at 1 kHz. For stimuli with ITD outside the gerbil's physiological range, responses were cyclic indicating the use of phase information when lateralizing narrow-band sounds. For ILD stimuli, reliable responses were obtained for frequencies ≥2 kHz. The comparison of ITD and ILD thresholds with ITD and ILD thresholds derived from gerbils' free-field performance suggests that ongoing ITD information is the main cue for sound localization at frequencies <2 kHz. At 2 kHz, ITD and ILD cues are likely used in a complementary way. Verification of the use of the virtual headphones suggests that they can serve as a suitable substitute for conventional headphones particularly at frequencies ≤2 kHz.


Conflict of interest statement

Competing Interests: The authors have declared that no competing interests exist.

Figures

Fig 1
Fig 1. Methods and procedures.
(A) Schematic of the experimental setup. Free-field stimuli were presented from a subset of an array of 15 loudspeakers distributed between -90° and 90° (gray and orange). Virtual-headphone stimuli were presented from the loudspeakers positioned at ±18° (orange). Animals moved on a Y-shaped platform and initiated trials by disrupting a light-barrier in a half-ring-shaped poke-hole (inset) with their nose. Animals' movements and responses were monitored by further light-barriers. Correct responses were rewarded by dispensing food rewards into food bowls from dispensers (not shown) fixed on the ceiling of the sound-attenuated booth. (B) Sketch illustrating the generation of virtual-headphone stimuli using cross-talk cancellation. The undesired signal paths (pink) between the loudspeakers and the respective contralateral ears are eliminated by destructive interference in the ears resulting in only the direct signal paths (blue) remaining present at the ears. (C) The free-field performance measured as probability of an approach to the right was transformed to free-field interaural level difference (ILD) and free-field interaural time difference (ITD) performance by extracting ITD and ILD values from the directional transfer functions (DTFs) obtained for the angular positions tested. Thresholds were then calculated by fitting a cumulative normal distribution function (green and red lines) to the raw data (circles) and determining the difference in ITD or ILD at the inflection point of the function (IP, dotted line) and 0.26 above the inflection point (IP+0.26, dashed line), thus corresponding to a d’-value of 1.
Fig 2
Fig 2. Probability of responses to the right as a function of ITD at 750, 1000, and 1250 Hz. The left column shows the performance using virtual headphones. The right column shows the free-field performance depending on the ITDs occurring in the free-field experiments.
Symbols indicate individual performance of animals [750 Hz: n = 6 (vhp, free-field), 1000 Hz: n = 6 (vhp, free-field), 1250 Hz: n = 5 (vhp) and 6 (free-field)]. Lines represent the cumulative normal distribution functions with four parameters (slope, inflection point, offset from 0, offset from 1) fitted to the raw data of individual animals. Identical colors and symbols represent data and fit of the same individual animal in the different panels. Thresholds (in μs) and identifiers of individual animals are given on the right.
Fig 3
Fig 3. Probability of responses to the right as a function of ITD at frequencies ≥2000 Hz. The left column shows the performance using virtual headphones. The right column shows the free-field performance depending on the ITDs occurring in the free-field experiments.
Tones with frequencies of 2000 [n = 6 (vhp, free-field)], 2400 [n = 5 (vhp) and 4 (free-field)], 2673 (n = 5, vhp only), 2900 Hz (n = 5, vhp only), and 3000 Hz (n = 6, free-field only) were presented. Symbols and lines as in the previous figure. Thresholds (in μs) and identifiers of individual animals are given on the right. ‘x’ indicates that no threshold could be determined because the threshold criterion was not reached. Thresholds in brackets were derived from cumulative normal distribution functions that yielded R2<0.875 with the raw data and not used in further analyses; such cumulative normal distribution functions are not shown.
Fig 4
Fig 4. Mean ITD thresholds measured under virtual-headphone stimulation (vhp, orange) and derived from free-field stimulation (ff, blue).
Only threshold values calculated from cumulative normal distribution functions that yielded an R2>0.875 with the raw data were included in the calculation of the average threshold values (S3 and S4 Tables, Figs 2 and 3). Error bars show standard deviations.
Fig 5
Fig 5. Behavioral responses to tones with ITD outside the naturally occurring range.
(A) Probability of responses to the right as a function of ITD measured at 1000 and 2000 Hz for an ITD range between -510 and 510 μs. Responses of four animals are shown in grey. The mean responses at 1000 and 2000 Hz are depicted in purple (triangles) and green (diamonds), respectively. (B) Probability of response to the right as a function of IPD measured at 1000 Hz (purple) and 2000 Hz (green).
Fig 6
Fig 6. Probability of responses to the right as a function of ILD obtained with tones of 2000, 4000, and 6000 Hz.
Symbols show individual performance of animals (2000 Hz: n = 6, 4000 Hz: n = 6, 6000 Hz: n = 5). Lines represent the cumulative normal distribution functions fitted to the raw data of individual animals. Identical colors and symbols represent data and fit of the same individual animal in the different panels. Thresholds (in dB) and identifiers of individual animals are given on the right.
Fig 7
Fig 7. Mean ILD thresholds measured under virtual-headphone stimulation (vhp, orange) or derived from free-field stimulation (ff, blue).
Thresholds calculated from cumulative normal distribution functions that reached R2>0.875 with the raw data were included in the calculation of average thresholds. Error bars show standard deviations.

Similar articles

Cited by

References

    1. Franken TP, Roberts MT, Wei L, Golding NL, Joris PX. In vivo coincidence detection in mammalian sound localization generates phase delays. Nat Neurosci. 2015;18: 444–452. 10.1038/nn.3948 - DOI - PMC - PubMed
    1. Gai Y, Kotak VC, Sanes DH, Rinzel J. On the localization of complex sounds: temporal encoding based on input-slope coincidence detection of envelopes. J Neurophysiol. 2014;112: 802–813. 10.1152/jn.00044.2013 - DOI - PMC - PubMed
    1. Klinge A, Beutelmann R, Klump GM. Effect of harmonicity on the detection of a signal in a complex masker and on spatial release from masking. PloS One. 2011;6: e26124 10.1371/journal.pone.0026124 - DOI - PMC - PubMed
    1. Laumen G, Tollin DJ, Beutelmann R, Klump GM. Aging effects on the binaural interaction component of the auditory brainstem response in the Mongolian gerbil: Effects of interaural time and level differences. Hear Res. 2016;337: 46–58. 10.1016/j.heares.2016.04.009 - DOI - PMC - PubMed
    1. Stange A, Myoga MH, Lingner A, Ford MC, Alexandrova O, Felmy F, et al. Adaptation in sound localization: from GABA(B) receptor-mediated synaptic modulation to perception. Nat Neurosci. 2013;16: 1840–1847. 10.1038/nn.3548 - DOI - PubMed

LinkOut - more resources