. 2017 Sep:20:84-93.
doi: 10.1016/j.epidem.2017.03.003. Epub 2017 Mar 12.

The impact of stratified immunity on the transmission dynamics of influenza

Affiliations

The impact of stratified immunity on the transmission dynamics of influenza

Hsiang-Yu Yuan et al. Epidemics. 2017 Sep.

Abstract

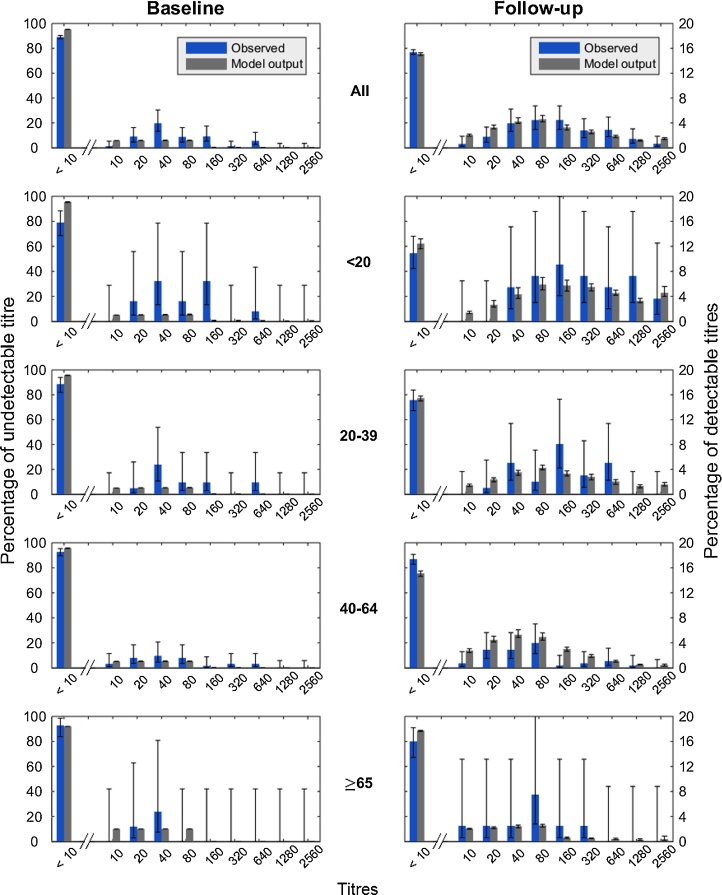
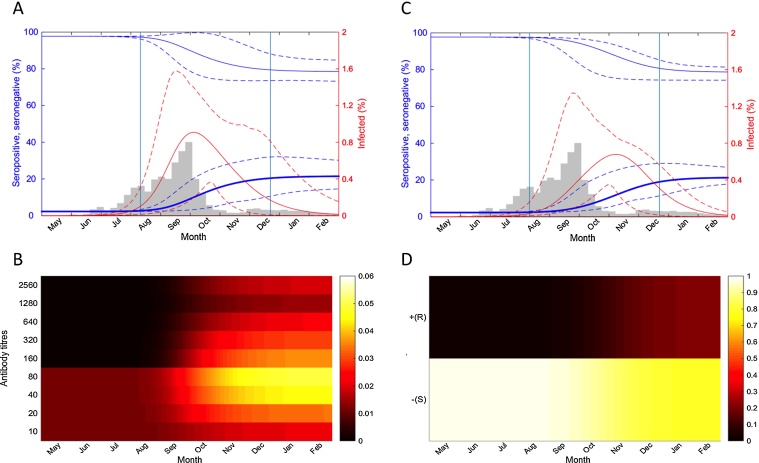
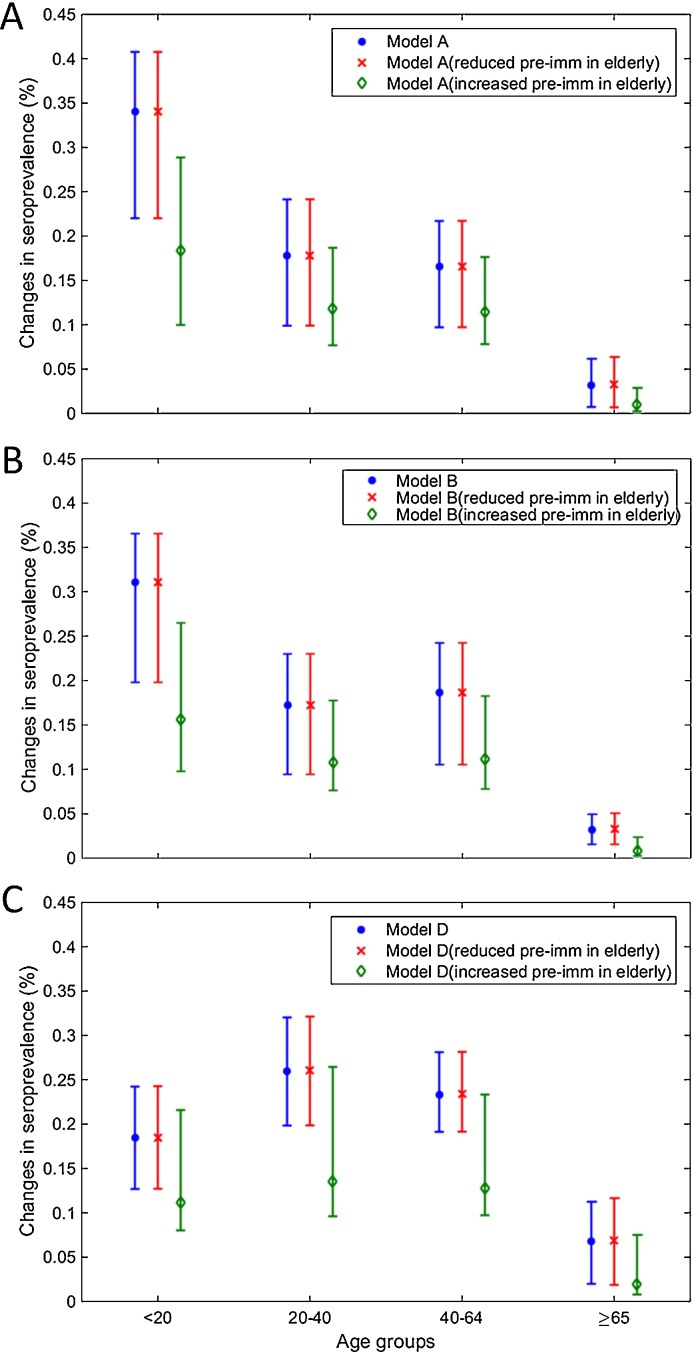
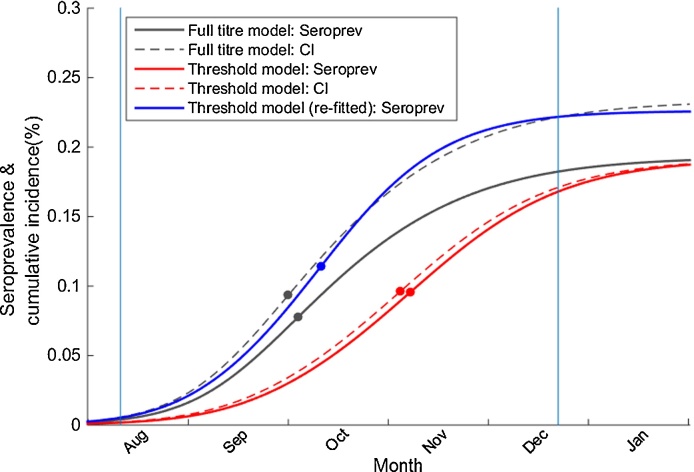
Although empirical studies show that protection against influenza infection in humans is closely related to antibody titres, influenza epidemics are often described under the assumption that individuals are either susceptible or not. Here we develop a model in which antibody titre classes are enumerated explicitly and mapped onto a variable scale of susceptibility in different age groups. Fitting only with pre- and post-wave serological data during 2009 pandemic in Hong Kong, we demonstrate that with stratified immunity, the timing and the magnitude of the epidemic dynamics can be reconstructed more accurately than is possible with binary seropositivity data. We also show that increased infectiousness of children relative to adults and age-specific mixing are required to reproduce age-specific seroprevalence observed in Hong Kong, while pre-existing immunity in the elderly is not. Overall, our results suggest that stratified immunity in an aged-structured heterogeneous population plays a significant role in determining the shape of influenza epidemics.

Keywords: Age-specific seroprevalence; Antibody responses; Epidemic model; Inferring transmission dynamics; Influenza; Stratified immunity.


Figures

Fig. 1
Fig. 1
Comparison of titre model fit (gray) and observed (blue) age-stratified data for baseline and follow-up surveys. The top row describes the pattern for the entire population, while the bottom four rows describe patterns for specific age groups. Vertical bars indicate 95% binomial confidence intervals (observed) and 95% region of posterior credibility (model). Left y-axis indicates the percentage with undetectable titre. Right y-axis indicates percentages in other titre classes. Note left and right y-axis are different scales. (For interpretation of the references to colour in this figure legend, the reader is referred to the web version of the article.)
Fig. 2
Fig. 2
Disease and serological dynamics of the titre model simulation. Dynamics were reconstructed using 400 random samples from the posterior distributions of the parameters. (A) The disease dynamics calculated using the titre model. Bold blue, seropositive individuals, defined as individuals with titres ≥40. Thin blue, seronegative individuals, defined as individuals with titres <40. Solid lines give the posterior mean, while dashed lines give 95% credible intervals. The percentage of the infected individuals is shown in red. Vertical lines indicate average recruiting time T1 and T2 during the periods of baseline and follow-up surveys. Gray bars represent the weekly number of laboratory confirmed cases of 2009 pandemic in Hong Kong. (B) The serological dynamics simulated during the outbreak using the titre model. Darker colour represents a lower proportion and lighter represents a higher proportion of the population with a given antibody titre. (C) The disease dynamics calculated with the threshold model using the classic definition of seropositivity (1:40). Colours are the same as in (A). (D) The serological dynamics simulated during the outbreak using the threshold model. Darker colour represents a lower proportion and the lighter one represents a higher density in the population. Note that the average of the peak time obtained from the posterior sampling is slightly different from the peak of the average incidence as shown in (A) and (C). (For interpretation of the references to colour in this figure legend, the reader is referred to the web version of the article.)
Fig. 3
Fig. 3
Changes in age-specific seroprevalence under different assumptions on antibody boosting and the relative infectivity of children. (A) Changes in seroprevalence calculated using the titre model with full parameter sets (model A) from the first day of the pandemic until the follow-up recruiting time T2. Blue, the titre model with pre-existing immunity in the elderly set to twice that of other age groups (default setting). Red, the titre model with reduced pre-existing immunity in the elderly and all age groups have the same seroprevalence. Green, the titre model with higher pre-existing immunity in the elderly set to 4 times that of other age groups. (B) Changes of the seroprevalence calculated using the titre model with the same antibody boosting among different age groups (model B). Colours are the same as in (A). (C) Changes of the seroprevalence calculated, using the titre model without the increased relative infectivity of children (model C). Colours are the same as in (A). Note that the changes in seroprevalence in model C were measured from the first day of the pandemic until the follow-up recruiting time T2 plus additional 60 days to adjust for the delay of the peak. Similar patterns of seroprevalence were able to be produced if T2 was used instead of T2 plus 60 days. (For interpretation of the references to colour in this figure legend, the reader is referred to the web version of the article.)
Fig. 4
Fig. 4
The seroprevalence and cumulative incidence by time reconstructed from the models outputs. Gray, solid and dashed lines represent seroprevalence and cumulative incidence produced by the full titre model (model A). Red, solid and dashed lines represent seroprevalence and cumulative incidence produced by the threshold model (model E). The slight difference between cumulative incidence and the seroprevalence in the threshold model is caused by the assumption that only healthy persons (individuals not in infected status), would participate in the serosurveillance survey. The blue line represents the seroprevalence produced by re-fitting the threshold model to the cumulative incidence generated from the full titre model at T2. The dot represents the time when the maximum slope is achieved, corresponding to the peak of the respected epidemic curve. (For interpretation of the references to colour in this figure legend, the reader is referred to the web version of the article.)
Fig. 5
Fig. 5
Comparison of the effective reproductive numbers between the titre and threshold models. Blue, the 95% credible interval of the reproductive number RB estimated from the titre model with age-specific serological parameters. Red, the 95% credible interval of the reproductive number RC estimated from the threshold model with the same age mixing effect. Bolded lines represent the mean values. (For interpretation of the references to colour in this figure legend, the reader is referred to the web version of the article.)

References

    1. Achonu C., Rosella L., Gubbay J.B., Deeks S., Rebbapragada A., Mazzulli T., Willison D., Foisy J., McGeer A., Johnson I., LaFreniere M., Johnson C., Willmore J., Yue C., Crowcroft N.S. Seroprevalence of pandemic influenza H1N1 in Ontario from January 2009–May 2010. PLoS ONE. 2011;6(11) - PMC - PubMed
    1. Allen L.J.S., Lahodny G.E. Extinction thresholds in deterministic and stochastic epidemic models. J. Biol. Dyn. 2012;6(2):590–611. - PubMed
    1. Baguelin M., Hoschler K., Stanford E., Waight P., Hardelid P., Andrews N., Miller E. Age-specific incidence of A/H1N1 2009 influenza infection in England from sequential antibody prevalence data using likelihood-based estimation. PLoS ONE. 2011;6(2):e17074. - PMC - PubMed
    1. Baguelin M., Flasche S., Camacho A., Demiris N., Miller E., John Edmunds W. Assessing optimal target populations for influenza vaccination programmes: an evidence synthesis and modelling study. PLoS Med. 2013;10(10) - PMC - PubMed
    1. Birrell P., Ketsetzis G., Gay N., Cooper B., Presanis A., Harris R., Charlett A., Zhang X.-S., White P., Pebody R., De Angelis D. Bayesian modeling to unmask and predict influenza A/H1N1pdm dynamics in London. Proc. Natl. Acad. Sci. U. S. A. 2011;108:18238–18243. - PMC - PubMed