. 2017 Jun 2;292(22):9294-9304.
doi: 10.1074/jbc.M116.773069. Epub 2017 Apr 10.

Photoaffinity labeling with cholesterol analogues precisely maps a cholesterol-binding site in voltage-dependent anion channel-1

Affiliations

Photoaffinity labeling with cholesterol analogues precisely maps a cholesterol-binding site in voltage-dependent anion channel-1

Melissa M Budelier et al. J Biol Chem. .

Abstract

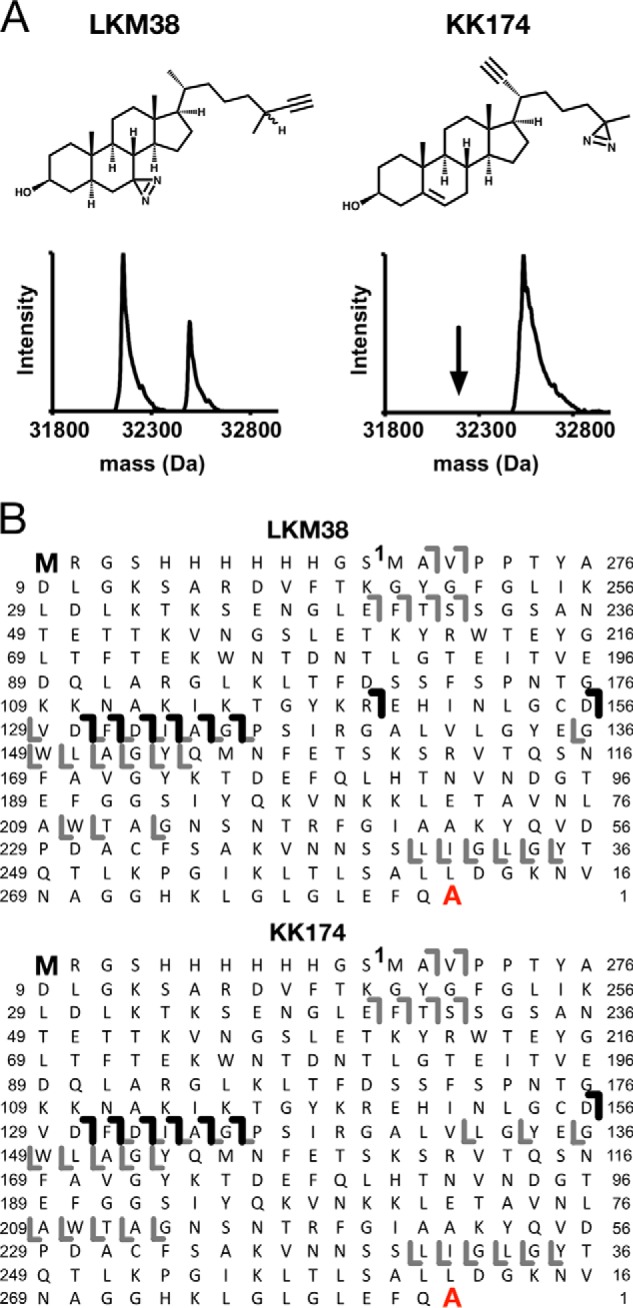
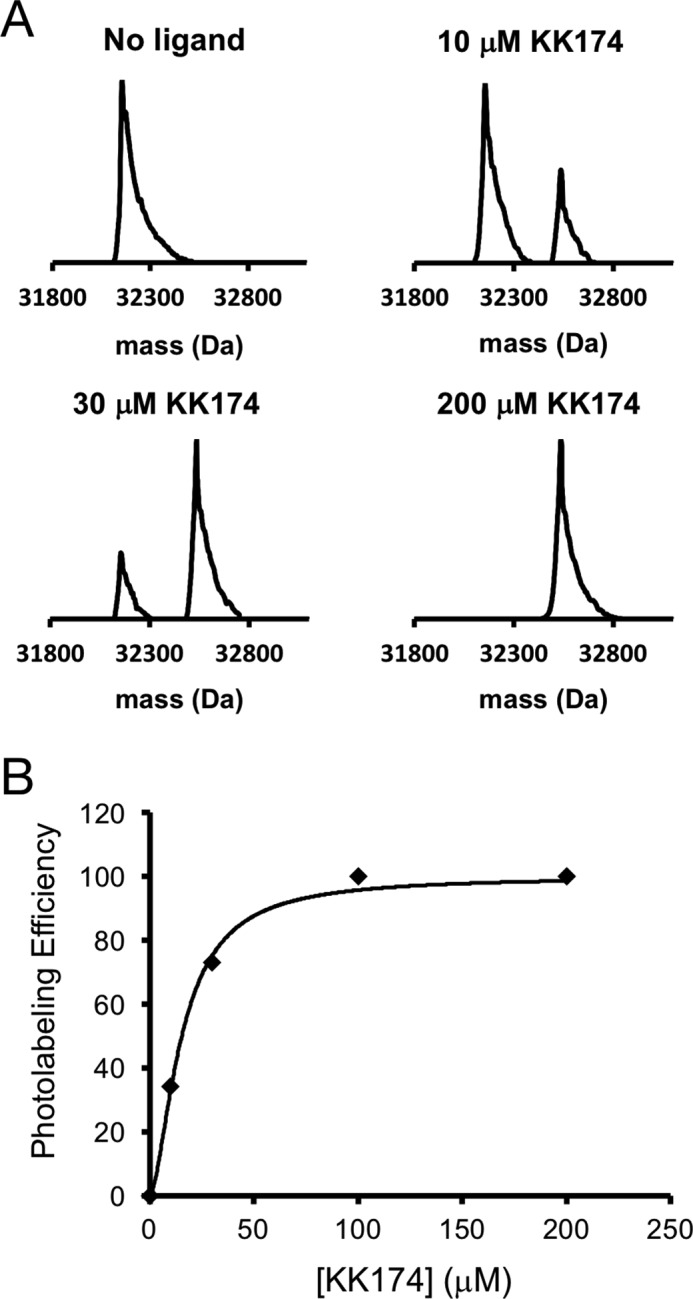
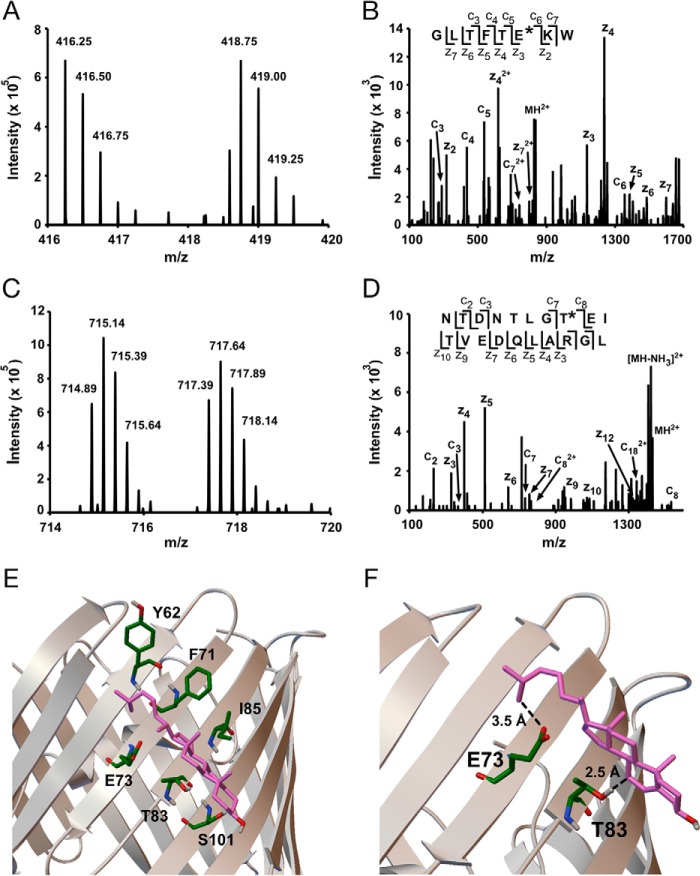
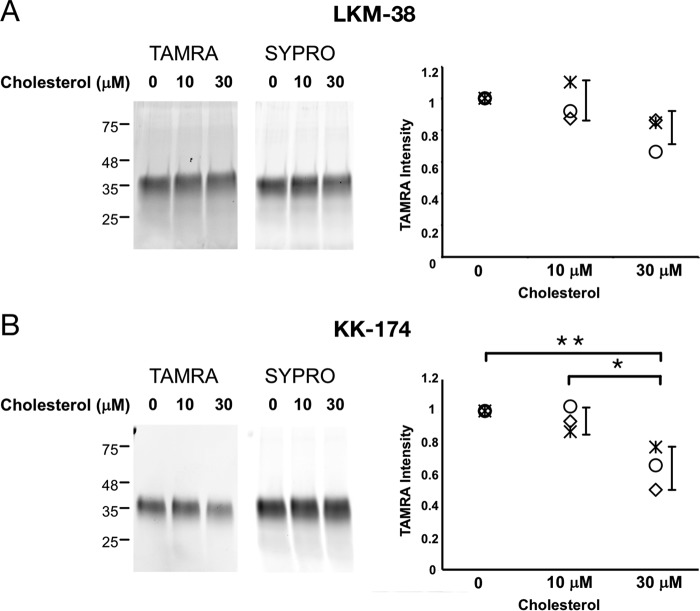
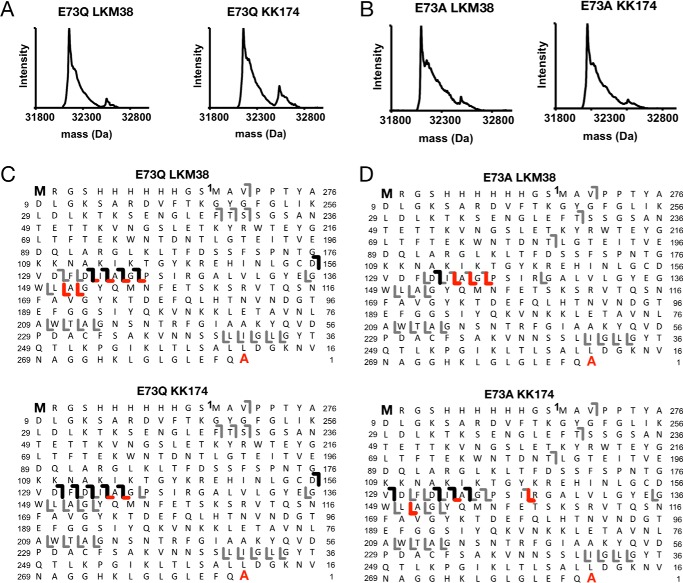
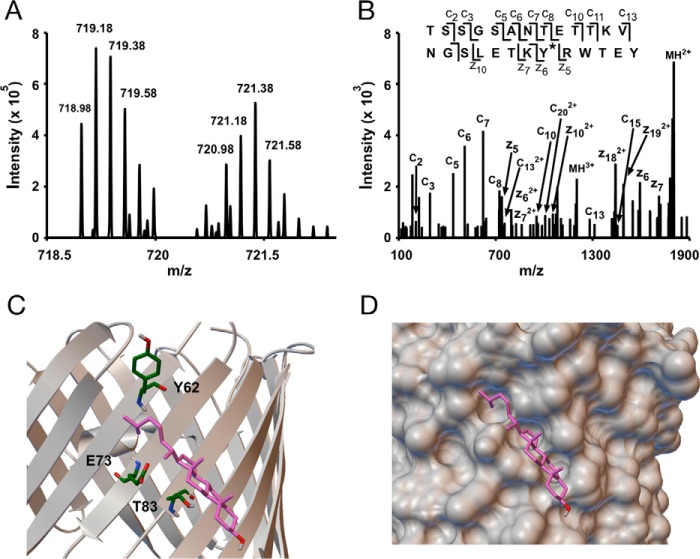
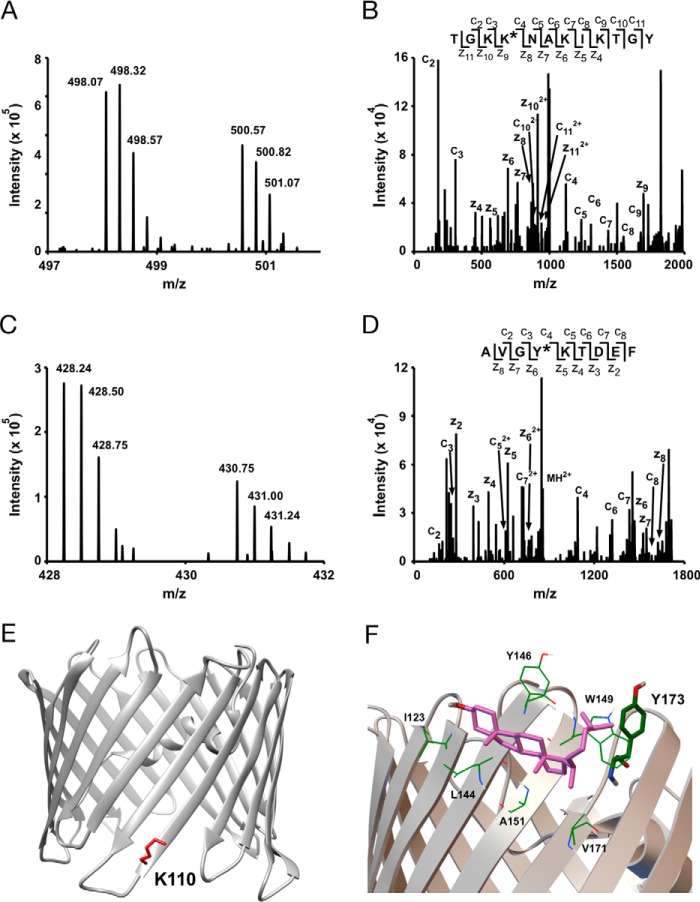
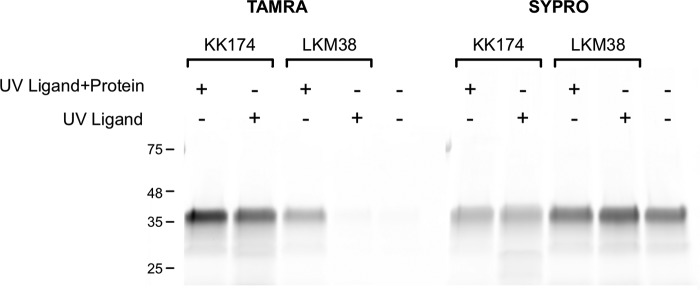
Voltage-dependent anion channel-1 (VDAC1) is a highly regulated β-barrel membrane protein that mediates transport of ions and metabolites between the mitochondria and cytosol of the cell. VDAC1 co-purifies with cholesterol and is functionally regulated by cholesterol, among other endogenous lipids. Molecular modeling studies based on NMR observations have suggested five cholesterol-binding sites in VDAC1, but direct experimental evidence for these sites is lacking. Here, to determine the sites of cholesterol binding, we photolabeled purified mouse VDAC1 (mVDAC1) with photoactivatable cholesterol analogues and analyzed the photolabeled sites with both top-down mass spectrometry (MS), and bottom-up MS paired with a clickable, stable isotope-labeled tag, FLI-tag. Using cholesterol analogues with a diazirine in either the 7 position of the steroid ring (LKM38) or the aliphatic tail (KK174), we mapped a binding pocket in mVDAC1 localized to Thr83 and Glu73, respectively. When Glu73 was mutated to a glutamine, KK174 no longer photolabeled this residue, but instead labeled the nearby Tyr62 within this same binding pocket. The combination of analytical strategies employed in this work permits detailed molecular mapping of a cholesterol-binding site in a protein, including an orientation of the sterol within the site. Our work raises the interesting possibility that cholesterol-mediated regulation of VDAC1 may be facilitated through a specific binding site at the functionally important Glu73 residue.

Keywords: cholesterol; lipid binding protein; photoaffinity labeling; protein drug interaction; voltage-dependent anion channel (VDAC).


Conflict of interest statement

The authors declare that they have no conflicts of interest with the contents of this article

Figures

Figure 1.
Figure 1.
Top-down MS of mVDAC1 photolabeled with cholesterol analogues. A, chemical structures of cholesterol analogues, and associated deconvoluted spectra of mVDAC1 photolabeled with LKM38 and KK174. For LKM38, two peaks in the deconvoluted spectrum represent unlabeled and singly labeled mVDAC1 at 32,157 and 32,553 Da, respectively. For KK174, the one peak represents singly labeled mVDAC1 at 32,537 Da. B, HCD fragment ion assignments obtained by isolating the LKM38- and KK174-photolabeled species, respectively. Amino acids are numbered to exclude the first 12 residues in the N terminus that comprise the affinity tag. The gray lines represent b and y ions that do not contain a ligand adduct. The black lines represent b ions that do contain a ligand adduct and were identified by searching the fragmentation data against a database in which the ligand mass was added to the N-terminal methionine. The absence of red lines indicates an absence of y ions identified by searching against a database in which the ligand mass was added to the C-terminal alanine.
Figure 2.
Figure 2.
Concentration-dependent photolabeling of mVDAC1 by KK174 demonstrates saturation and a stoichiometry of one. A, deconvoluted spectra of mVDAC1 photolabeled with KK174 at 0, 10, 30, and 200 μm. The theoretical average masses of unlabeled mVDAC1, singly labeled mVDAC1, and doubly labeled mVDAC1 are 32,154, 32,534, and 32,914 Da, respectively. B, scatter plot of the photolabeling efficiency of mVDAC1 by KK174. Data are fit with a four-parameter logistic equation, which yields an apparent EC50 of 15.3 μm and Hill slope of 1.6.
Figure 3.
Figure 3.
Bottom-up MS of mVDAC1 photolabeled with cholesterol analogues maps a cholesterol-binding site. A, representative MS1 doublet corresponding to the peptide GLTFTEKW labeled with KK174 (z = 4) and coupled to light and heavy FLI-tag. B, fragmentation (ETD) spectra corresponding to the heavy feature in A. The site defining ions localize KK174 labeling to Glu73. C, a representative MS1 doublet corresponding to the peptide NTDNTLGTEITVEDQLARGL labeled with LKM38 (z = 4) and coupled to light and heavy FLI-tag. D, fragmentation (ETD) spectra corresponding to the light feature in C. Site defining ions localize LKM38 labeling to Thr83. E, a cholesterol-binding pose from AutoDock bound by Tyr62, Phe71, Glu73, Thr83, Ile85, and Ser101. F, same cholesterol binding pose as in E showing the aliphatic tail 3.5 Å from Glu73 and the 7 position 2.5 Å from Thr83, consistent with KK174 and LKM38 labeling of these residues.
Figure 4.
Figure 4.
Competitive inhibition of LKM38 and KK174 photolabeling of mVDAC1 by cholesterol. SDS-PAGE of WT mVDAC1 photolabeled for 1 min with 1 μm LKM38 (A) or KK174 (B) in the absence and presence of 10 or 30 μm cholesterol. The gel bands on the left show fluorescence signal with TAMRA or SYPRO Ruby. The scatter plots on the right show densitometry measurements of TAMRA signal from three separate experiments. Error bars indicate S.D. * indicates p < 0.05 and ** p < 0.01 based on an analysis of variance with Tukey HSD test.
Figure 5.
Figure 5.
Top-down MS of E73Q and E73A mVDAC1 photolabeled with cholesterol analogues. A, deconvoluted spectra of E73Q mVDAC1 photolabeled with LKM38 and KK174. For LKM38, the two peaks represent unlabeled and singly labeled E73Q at 32,153 and 32,550 Da, respectively. For KK174, the two peaks represent unlabeled and singly labeled E73Q at 32,153 and 32,493 Da, respectively. B, same as A for E73A mVDAC1. For LKM38, the two peaks represent unlabeled and singly labeled E73A at 32,097 and 32,493 Da, respectively. For KK174, the two peaks represent unlabeled and singly labeled E73A at 32,097 and 32,477 Da, respectively. C, HCD fragment ion assignments obtained by isolating the LKM38- and KK174-E73Q photolabeled species, respectively. The gray lines represent b and y ions that do not contain a ligand adduct. The black lines represent b ions that contain ligand adduct identified by searching against a database in which the ligand mass was added to the N-terminal methionine. The red lines represent y ions that contain ligand adduct identified by searching against a database in which the ligand mass was added to the C-terminal alanine. D, same as C for E73A mVDAC1.
Figure 6.
Figure 6.
Photolabeling a third residue, Tyr62, in the cholesterol binding pocket in E73Q mVDAC1. A, an MS1 doublet corresponding to the peptide TSSGSANTETTKVNGSLETKYRWTEY from E73Q mVDAC1 photolabeled with KK174 (z = 5) and coupled to light and heavy FLI-tag. B, fragmentation (ETD) spectra corresponding to the feature in A. Site defining ions localize KK174 photolabeling to Tyr62. C, the same cholesterol binding pose as in Fig. 2E showing Tyr62, Glu73, and Thr83. D, space filling view of the binding pocket mapped by KK174 and LKM38.
Figure 7.
Figure 7.
Additional sites of KK174 photolabeling in E73Q mVDAC1. A, an MS1 doublet corresponding to the peptide TGKKNAKIKTGY labeled with KK174 (z = 4) and coupled to light and heavy FLI-tag. B, fragmentation (ETD) spectra corresponding to the heavy feature in A. Site defining ions localize KK174 labeling to Lys110. C, an MS1 doublet corresponding to the peptide AVGYKTDEF labeled with KK174 (z = 4) and coupled to light and heavy FLI-tag. D, fragmentation (ETD) spectra corresponding to the light feature in C. Site defining ions localize KK174 labeling to Tyr173. E, mVDAC1 crystal structure (PDB code 3emn) highlighting the photolabeled residue Lys110. F, a cholesterol binding pose from Autodock located within a previously identified cholesterol binding pocket (8) formed by Val171, Ala151, Leu144, Ile123, Tyr146, and Trp149. The aliphatic tail of cholesterol in this pose is near Tyr173, consistent with KK174 labeling of this residue in E73Q mVDAC1.
Figure 8.
Figure 8.
Formation of a long-lived reactive intermediate for KK174 but not LKM38. SDS-PAGE of mVDAC1 photolabeled with 30 μm KK174 and LKM38. KK174 and LKM38 were UV irradiated for 1 min in the presence of mVDAC1 (UV Ligand + Protein), or in the absence of mVDAC1 followed by immediate mixing with mVDAC1 (UV Ligand). The gel bands show fluorescence signal with TAMRA (left) or SYPRO Ruby (right).

Similar articles

Cited by

References

    1. McCommis K. S., and Baines C. P. (2012) The role of VDAC in cell death: friend or foe? Biochim. Biophys. Acta 1818, 1444–1450 - PMC - PubMed
    1. Colombini M. (2012) VDAC structure, selectivity, and dynamics. Biochim. Biophys. Acta 1818, 1457–1465 - PMC - PubMed
    1. Rostovtseva T. K., Kazemi N., Weinrich M., and Bezrukov S. M. (2006) Voltage gating of VDAC is regulated by nonlamellar lipids of mitochondrial membranes. J. Biol. Chem. 281, 37496–37506 - PubMed
    1. Betaneli V., Petrov E. P., and Schwille P. (2012) The role of lipids in VDAC oligomerization. Biophys. J. 102, 523–531 - PMC - PubMed
    1. Hiller S., Garces R. G., Malia T. J., Orekhov V. Y., Colombini M., and Wagner G. (2008) Solution structure of the integral human membrane protein VDAC-1 in detergent micelles. Science 321, 1206–1210 - PMC - PubMed

Publication types

Associated data