. 2017 Apr 25;114(17):4324-4329.
doi: 10.1073/pnas.1612147114. Epub 2017 Apr 10.

Subduction zone forearc serpentinites as incubators for deep microbial life

Affiliations

Subduction zone forearc serpentinites as incubators for deep microbial life

Oliver Plümper et al. Proc Natl Acad Sci U S A. .

Abstract

Serpentinization-fueled systems in the cool, hydrated forearc mantle of subduction zones may provide an environment that supports deep chemolithoautotrophic life. Here, we examine serpentinite clasts expelled from mud volcanoes above the Izu-Bonin-Mariana subduction zone forearc (Pacific Ocean) that contain complex organic matter and nanosized Ni-Fe alloys. Using time-of-flight secondary ion mass spectrometry and Raman spectroscopy, we determined that the organic matter consists of a mixture of aliphatic and aromatic compounds and functional groups such as amides. Although an abiotic or subduction slab-derived fluid origin cannot be excluded, the similarities between the molecular signatures identified in the clasts and those of bacteria-derived biopolymers from other serpentinizing systems hint at the possibility of deep microbial life within the forearc. To test this hypothesis, we coupled the currently known temperature limit for life, 122 °C, with a heat conduction model that predicts a potential depth limit for life within the forearc at ∼10,000 m below the seafloor. This is deeper than the 122 °C isotherm in known oceanic serpentinizing regions and an order of magnitude deeper than the downhole temperature at the serpentinized Atlantis Massif oceanic core complex, Mid-Atlantic Ridge. We suggest that the organic-rich serpentinites may be indicators for microbial life deep within or below the mud volcano. Thus, the hydrated forearc mantle may represent one of Earth's largest hidden microbial ecosystems. These types of protected ecosystems may have allowed the deep biosphere to thrive, despite violent phases during Earth's history such as the late heavy bombardment and global mass extinctions.

Keywords: deep biosphere; forearc; serpentinization; subduction zone.


Conflict of interest statement

The authors declare no conflict of interest.

Figures
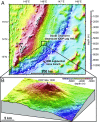
Fig. 1.
Fig. 1.
Location of the South Chamorro serpentinite mud volcano and the Izu–Bonin–Mariana (IBM) subduction zone (modified from ref. 11). (A) Bathymetry map of the Mariana arc-basin system displaying the location of the South Chamorro Seamount (Leg 195) in relation to the volcanic islands such as Guam. Approximately 50 km south of the seamount the water depth exceeds 8 km highlighting the trench of the IBM subduction zone that runs approximately north to southwest. (B) Three-dimensional view of the South Chamorro Seamount, depicting the location of ODP Site 1200. The subducting Pacific slab beneath the serpentinite mud volcano is in ∼20-km depth.
Fig. 2.
Fig. 2.
Organic matter within mesh-textured serpentinite clasts. (A and B) Backscattered electron images of a clast cross-section from 28.70 mbsf (1200E-007H-02WR-130-140). Dashed square in A depicts magnified area in B. (C–E) ToF-SIMS maps of a core–rim region in a clast from 14.80 mbsf (1200E-004-02WR-130-140) showing that the mesh core is enriched in (C2H3)+, (C2H5S)+, and (C4H5O)+. (F) Raman spectra obtained from an area in B (dashed rectangle) and a clast from 110.07 mbsf (1200A-013R-02W-40877) show organic molecules. (G) Hyperspectral Raman imaging (dashed rectangle in B) reveals organic material in the mesh cores and no organics within the rims, consistent with C–E.
Fig. 3.
Fig. 3.
Distribution of redox-sensitive transition metals in a mesh-textured serpentinite clast. (A and B) Backscattered electron images and (C) high-angle annular dark-field scanning transmission electron microscope (HAADF-STEM) image showing nanosized awaruite grains in the vicinity of mesh cores (bright spots in B; arrowhead). Mesopores (arrowhead in C) surrounding awaruite grains and extending across the rim–core interface could potentially allow gaseous exchange between nanograin surfaces and serpentinite mesh cores. A and B are images from samples retrieved from 14.80 and 110.07 mbsf, respectively. ToF-SIMS maps in D show elevated concentrations of redox-active metal ions encompassing the organic-rich mesh core shown in Fig. 2C.
Fig. 4.
Fig. 4.
Porosity within an organic-bearing, mesh-textured serpentinite clast. (A) Three-dimensional visualization of a FIB-SEM nanotomography volume (14.8 × 11.05 × 5.3 µm) showing that mesh cores consist of an extensive network of aligned mesopores (green), whereas the rims (blue) are mainly characterized by individual micrometer-sized pores (arrowheads) as shown in HAADF-STEM image (B). (C) HAADF-STEM image of the interface between the mesh rim and the core (white rectangle in B). Note the pore size difference between mesh rim and core and the complex contrast in the core indicating nanoscale pore connectivity.
Fig. S1.
Fig. S1.
Epoxy-normalized Raman spectrum of sample E7H2-5 (28.70 mbsf). All spectra were normalized to highest intensity epoxy Raman mode (815 cm−1), showing that epoxy does not contribute to the observed Raman spectra of the identified organic molecules.
Fig. S2.
Fig. S2.
Representative Raman spectra of the mesh core and rim region taken from the area in which hyperspectral imaging was performed. Bands marked with an asterisk belong to lizardite/chrysotile. All other bands reflect complex organic material (see main text and Table S1).
Fig. S3.
Fig. S3.
Representative Raman spectra of OH-stretching modes, fingerprinting lizardite and chrysotile (e.g., ref. 64) typically found in the mesh rim and core regions, respectively, of the serpentinite clasts.
Fig. S4.
Fig. S4.
(A) Backscattered electron image showing the location of the Raman map. (B) Shown is the distribution of organics within the mesh core and rim. Iorg and Iserp are the integrated intensities of the bands near 639 and 690 cm−1, respectively.
Fig. S5.
Fig. S5.
Raman spectrum as shown in Fig. S2 from the mesh core, but with reduced intensities R(ω) that were obtained by correcting the measured intensities for the instrumental response function, temperature effects, the excitation frequency dependence, and background (for more details, see Methods in the main text). Also shown is the deconvolution of the spectrum obtained from least-squares fitting individual Gauss–Lorentzian functions (gray curves) to the data. The red curve represents the sum curve. The residuals of the fitting procedure are also shown.
Fig. S6.
Fig. S6.
A is a backscattered electron (BSE) image taken in a scanning electron microscope showing the distribution of opaque minerals (high backscattering intensity). B is a high-angle annular dark-field (HAADF) image taken with transmission electron microscope in scanning mode. The corresponding EDX analysis of a nanosized awaruite grain is shown in C. The Cu Kβ peaks originates from the FIB section sample holder. The Mg Kα, Si Kα, and Ο Kα peaks are a minor contribution from the surrounding serpentine grains.
Fig. 5.
Fig. 5.
Conceptual model of a deep biosphere environment within the IBM subduction zone forearc with limit for serpentinization-fueled microbial life estimated at 10,000 mbsf based on the known upper temperature limit for life (122 °C) (34) and our heat conduction model. A shows a cross-sectional sketch of the IBM forearc. Fluid release from the subducting plate results in partial forearc mantle serpentinization. Tectonic activity causes mud–rock mixture to rise buoyantly in conduits along fault planes until it protrudes onto the seafloor to form massive serpentinite mud volcanoes (up to 50-km diameter and >2 km above the surrounding seafloor). The sketch in B displays a conceptual serpentinization evolution model and the depth range for possible subsurface microbial colonization. C and D show results of the one-dimensional heat conduction model (SI Estimation of the Maximum Depth for the Current Temperature Limit for Life), where C shows the maximum depth as a function of surface heat flow at constant thermal conductivity (partially serpentinized peridotite) below which microbial life is theoretically possible. D displays the influence of surface heat flow and thermal conductivity, at an average depth of 12,000 mbsf, on the upper temperature limit for life.
Fig. S7.
Fig. S7.
Sketch of the one-dimensional steady state heat conduction model (modified after ref. 34).

References

    1. Schrenk MO, Brazelton WJ, Lang SQ. Serpentinization, carbon, and deep life. Rev Mineral Geochem. 2013;75:575–606.
    1. McCollom TM, Bach W. Thermodynamic constraints on hydrogen generation during serpentinization of ultramafic rocks. Geochim Cosmochim Acta. 2009;73:856–875.
    1. Ohara Y, et al. A serpentinite-hosted ecosystem in the Southern Mariana Forearc. Proc Natl Acad Sci USA. 2012;109:2831–2835. - PMC - PubMed
    1. Brazelton WJ, Nelson B, Schrenk MO. Metagenomic evidence for H2 oxidation and H2 production by serpentinite-hosted subsurface microbial communities. Front Microbiol. 2012;2:268. - PMC - PubMed
    1. Curtis AC, Wheat CG, Fryer P, Moyer CL. Mariana forearc serpentinite mud volcanoes harbor novel communities of extremophilic archaea. Geomicrobiol J. 2013;30:430–441.

Publication types

Substances