. 2017 Apr 25;114(17):4519-4524.
doi: 10.1073/pnas.1617249114. Epub 2017 Apr 10.

Selective entrainment of gamma subbands by different slow network oscillations

Affiliations

Selective entrainment of gamma subbands by different slow network oscillations

Weiwei Zhong et al. Proc Natl Acad Sci U S A. .

Abstract

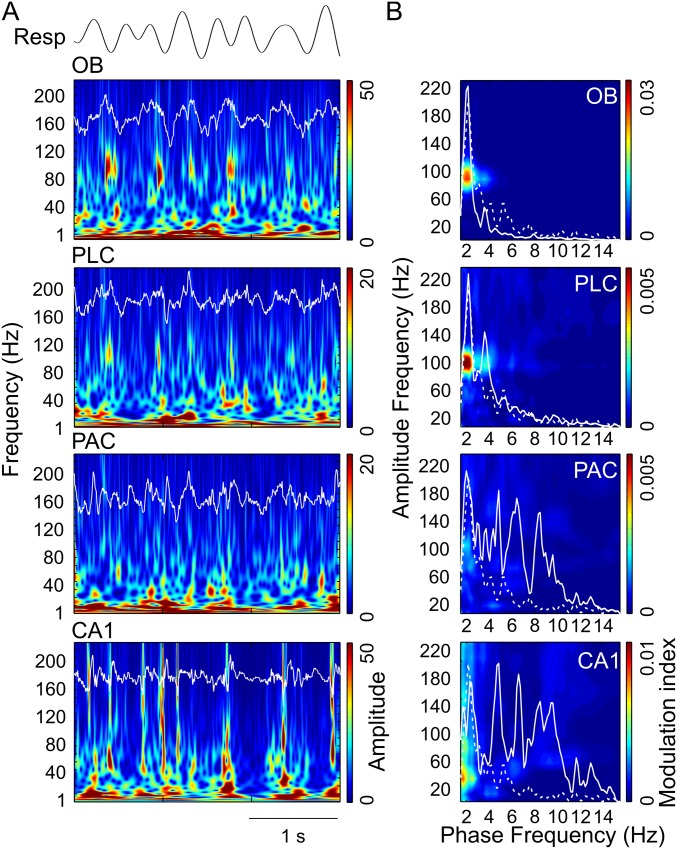
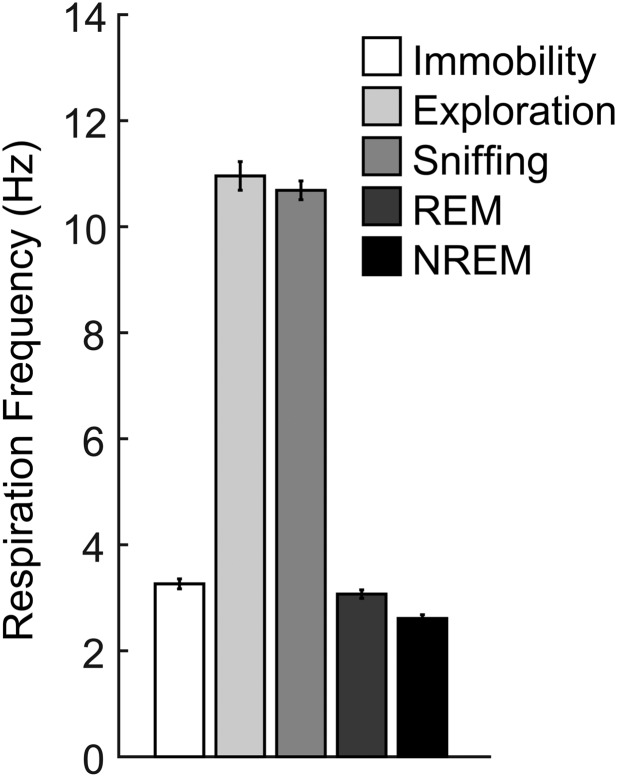
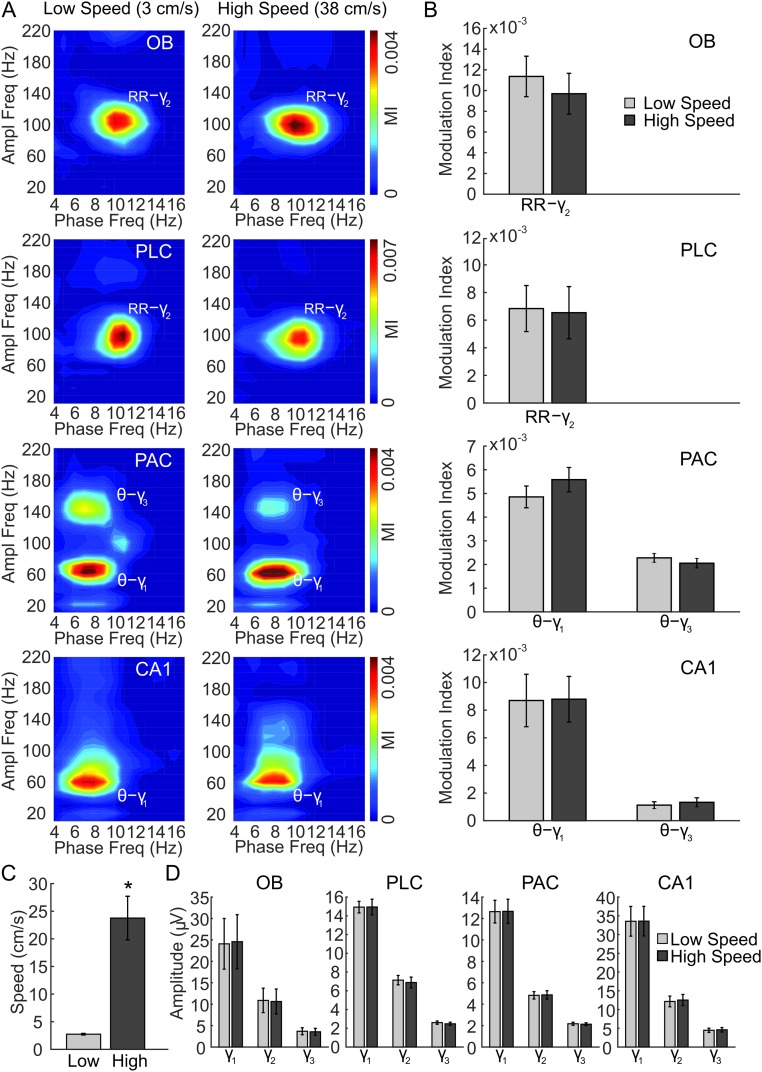
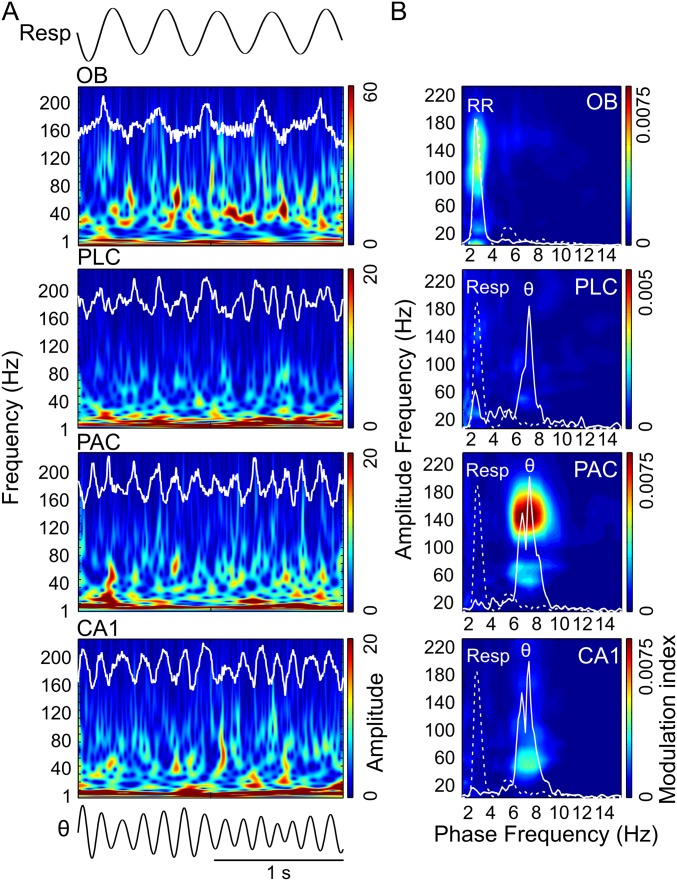
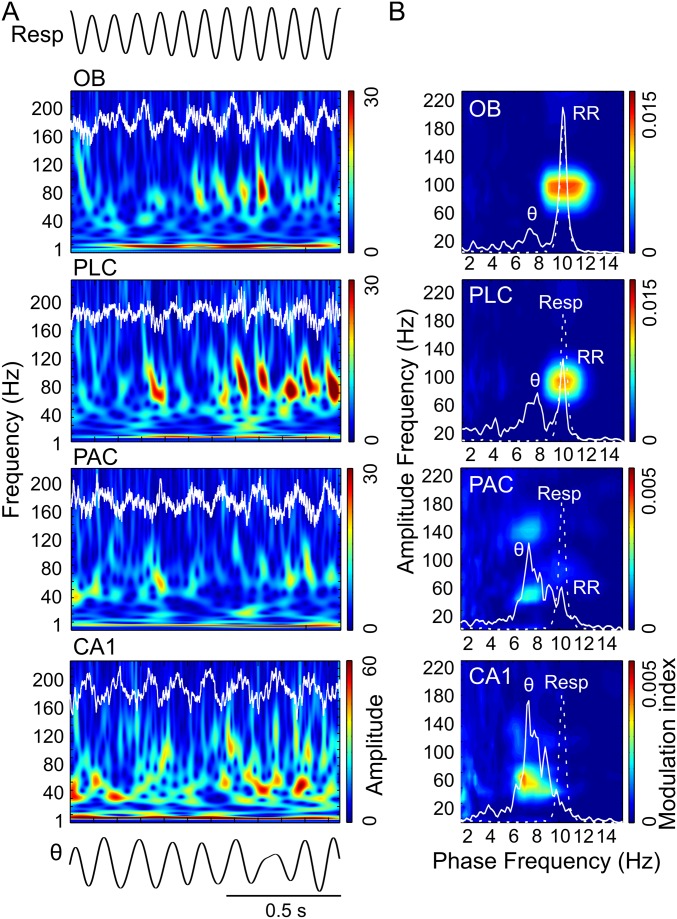
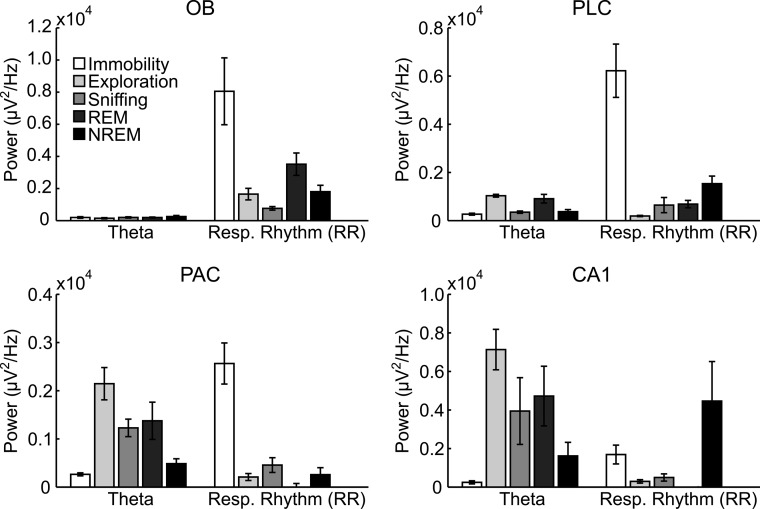
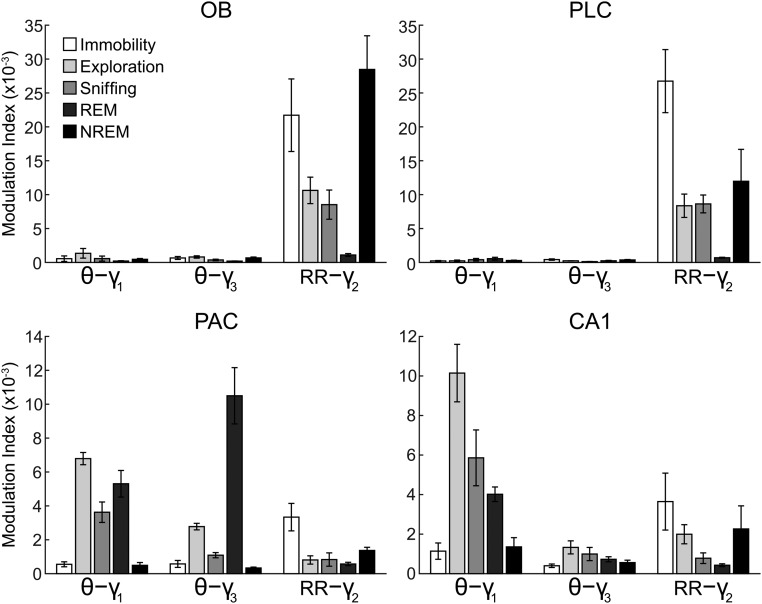
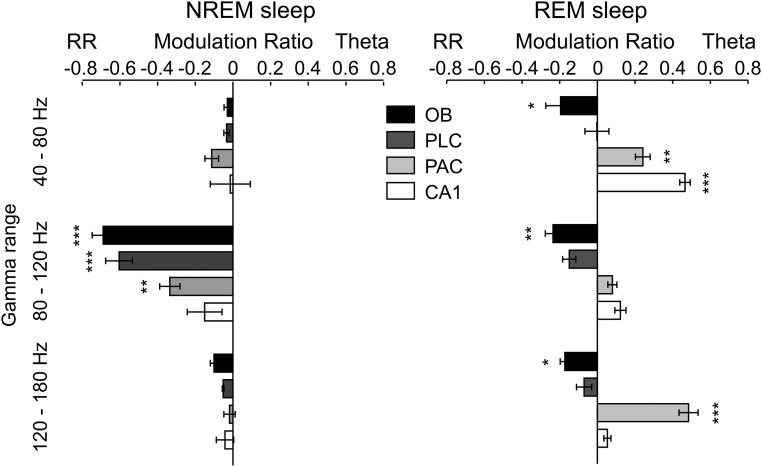
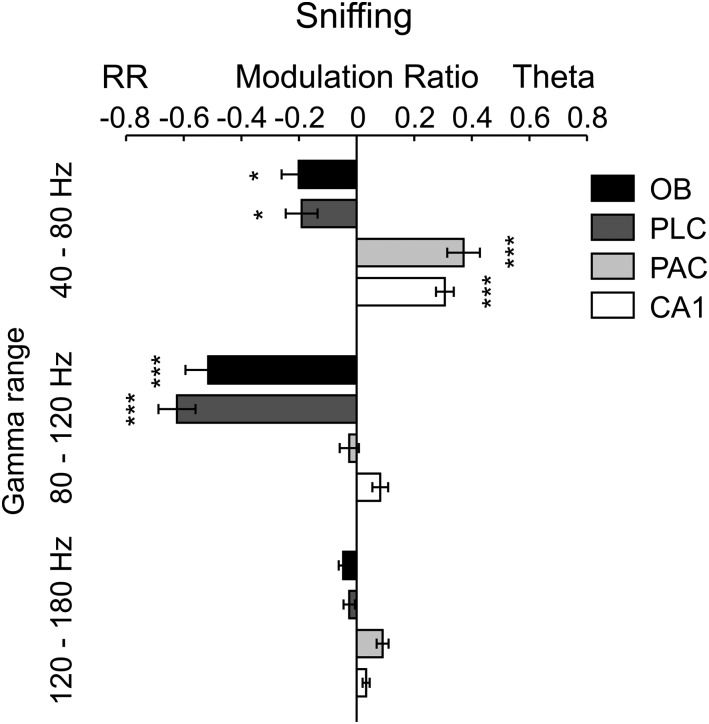
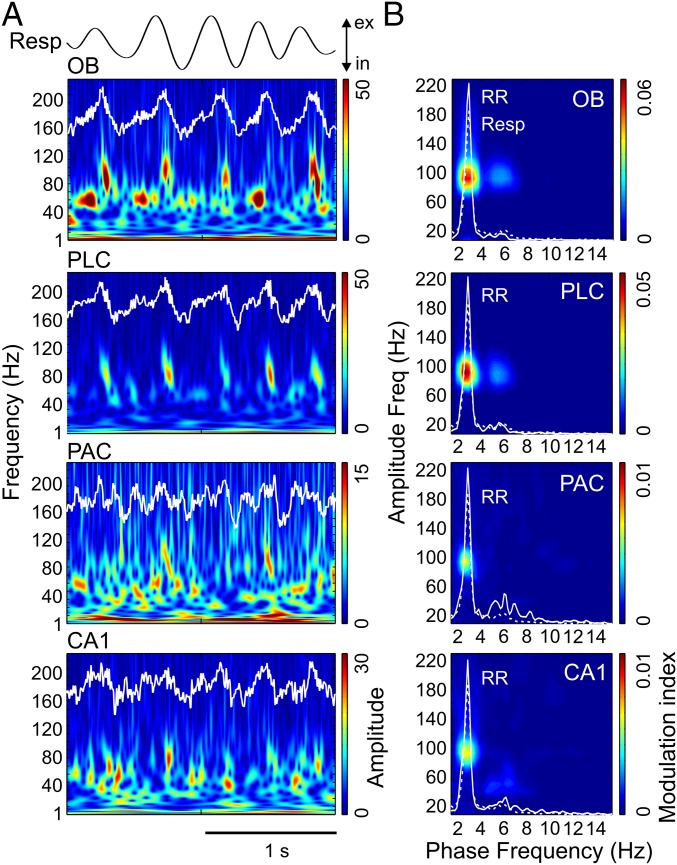
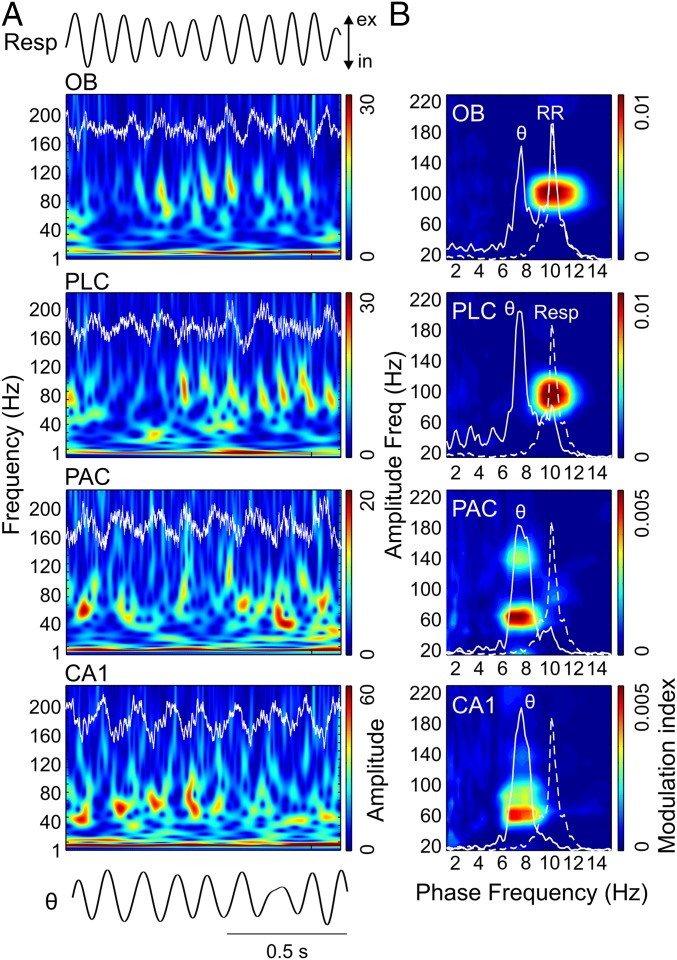
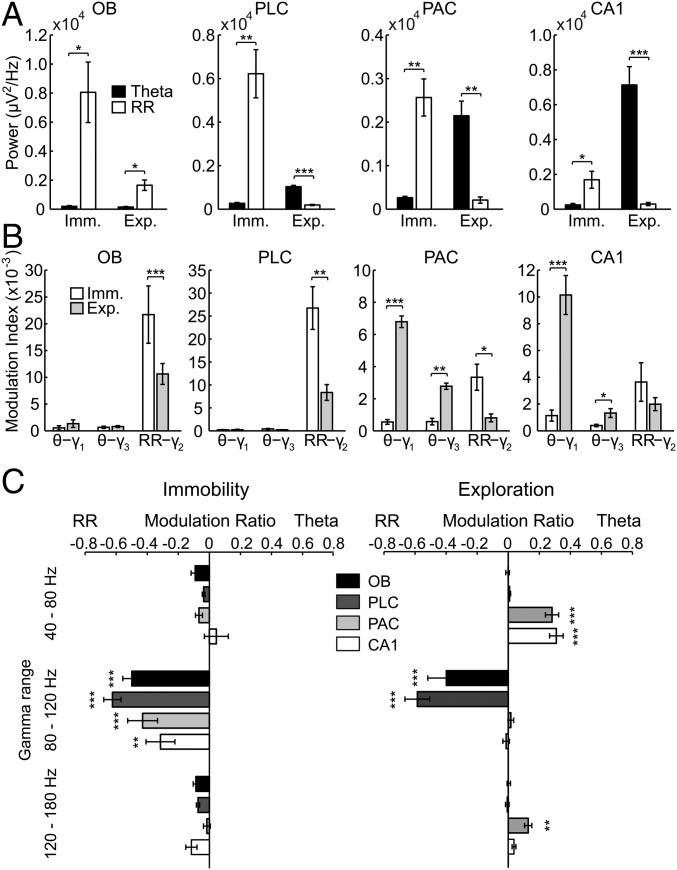
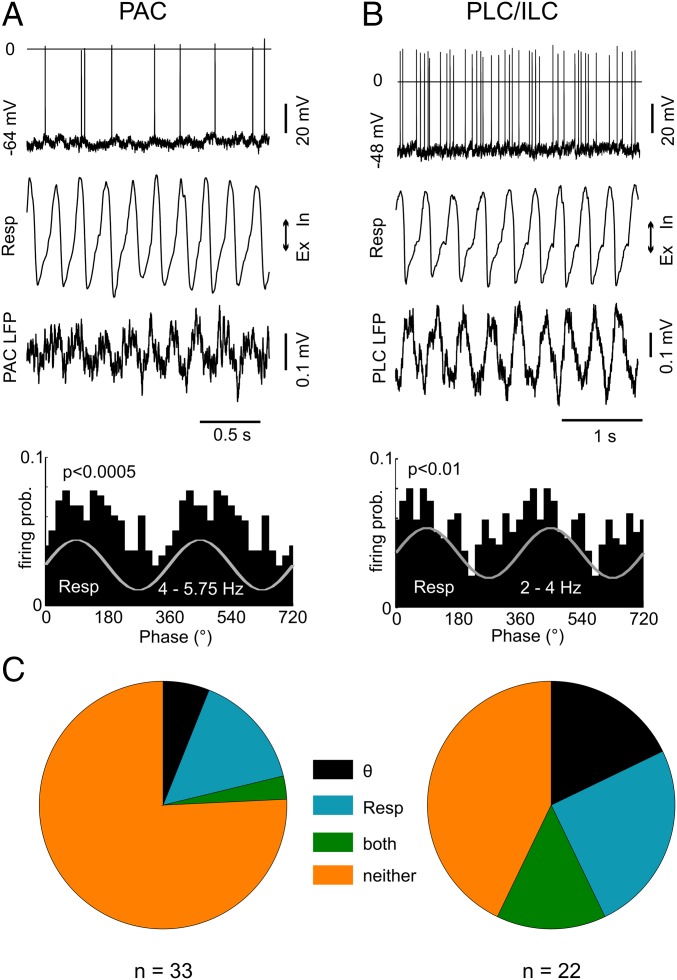
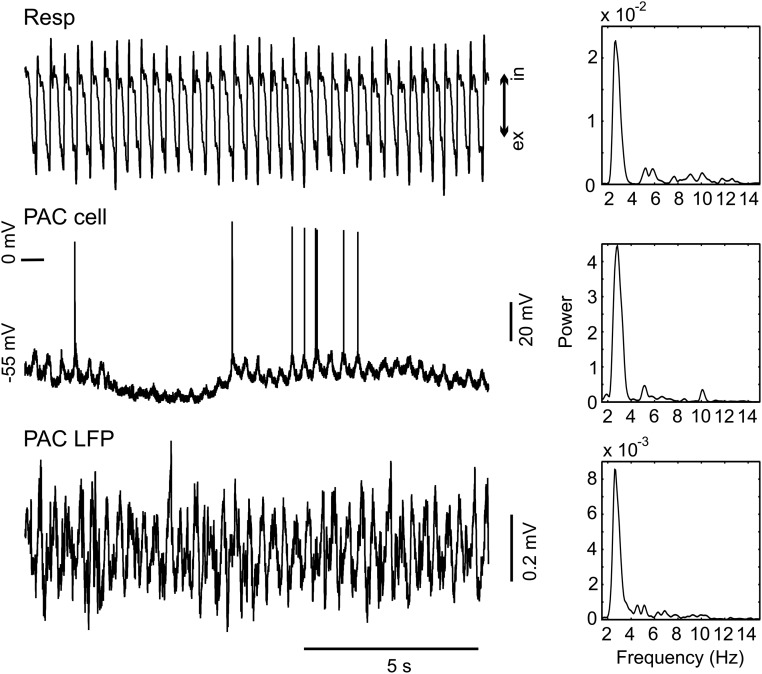
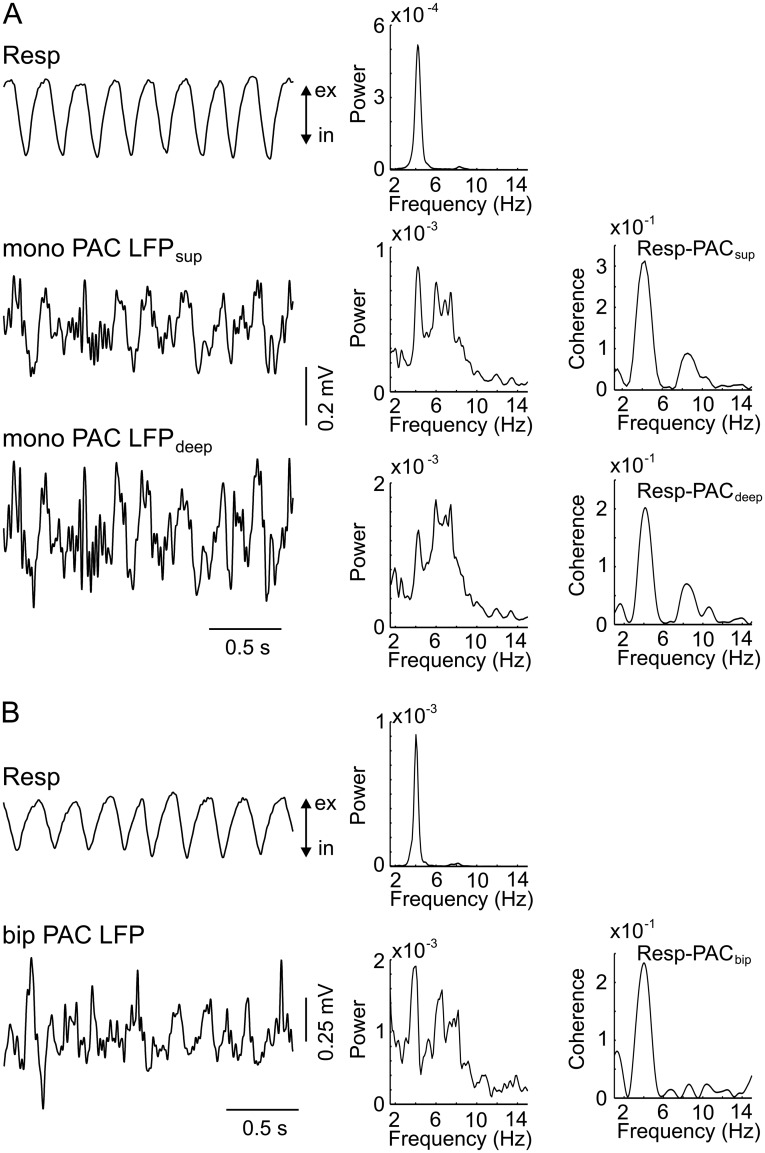
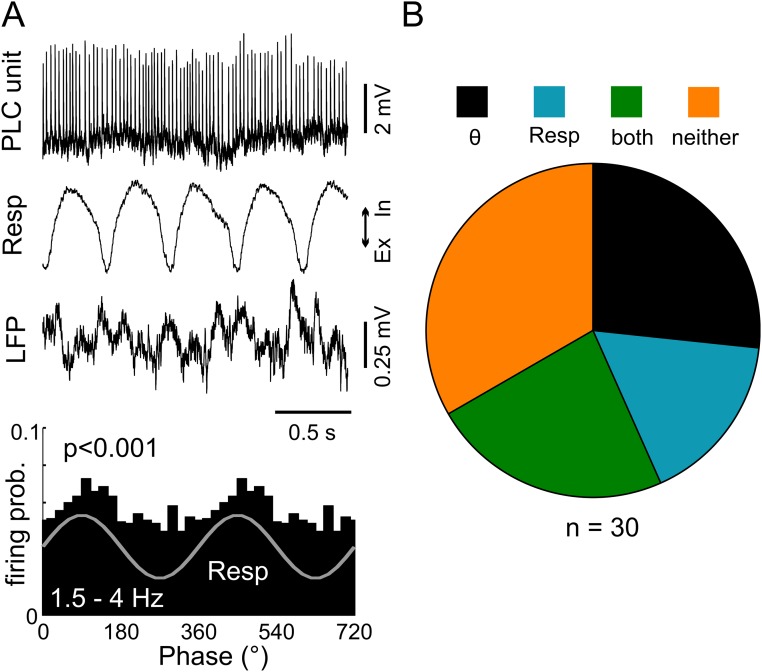
Theta oscillations (4-12 Hz) are thought to provide a common temporal reference for the exchange of information among distant brain networks. On the other hand, faster gamma-frequency oscillations (30-160 Hz) nested within theta cycles are believed to underlie local information processing. Whether oscillatory coupling between global and local oscillations, as showcased by theta-gamma coupling, is a general coding mechanism remains unknown. Here, we investigated two different patterns of oscillatory network activity, theta and respiration-induced network rhythms, in four brain regions of freely moving mice: olfactory bulb (OB), prelimbic cortex (PLC), parietal cortex (PAC), and dorsal hippocampus [cornu ammonis 1 (CA1)]. We report differential state- and region-specific coupling between the slow large-scale rhythms and superimposed fast oscillations. During awake immobility, all four regions displayed a respiration-entrained rhythm (RR) with decreasing power from OB to CA1, which coupled exclusively to the 80- to 120-Hz gamma subband (γ2). During exploration, when theta activity was prevailing, OB and PLC still showed exclusive coupling of RR with γ2 and no theta-gamma coupling, whereas PAC and CA1 switched to selective coupling of theta with 40- to 80-Hz (γ1) and 120- to 160-Hz (γ3) gamma subbands. Our data illustrate a strong, specific interaction between neuronal activity patterns and respiration. Moreover, our results suggest that the coupling between slow and fast oscillations is a general brain mechanism not limited to the theta rhythm.

Keywords: cross-frequency coupling; gamma subbands; neocortex; respiration; theta.


Conflict of interest statement

The authors declare no conflict of interest.

Figures

Fig. S1.
Fig. S1.
Region-specific and slow oscillation-specific coupling of different gamma subbands during NREM sleep. (A) Wavelet spectrograms and superimposed LFP signals (white traces) from OB, PLC, PAC, and CA1 simultaneously recorded during NREM sleep. The top trace shows nasal respiration (Resp) signal. (B) Cross-frequency comodulograms along with power spectra of LFPs (continuous white line) and Resp (dashed white line; same for all regions) computed during NREM sleep. Notice in the comodulograms specific coupling of γ2 (80–120 Hz) to the RR in OB and PLC and the absence of coupling in PAC and CA1. All plots were obtained from the same epoch (group data are shown in Figs. S7 and S8).
Fig. S2.
Fig. S2.
Respiration frequencies vary across behavioral states. Means and SEMs of nine to 15 animals are shown. The values correspond to the behavioral epochs analyzed in our work and should not be regarded as representative of each state. For exploration, sniffing, and REM sleep, we selected epochs with the maximum separation between the frequencies of theta and respiration.
Fig. S3.
Fig. S3.
Selective modulation of gamma subbands by theta and respiration rhythms is independent of the speed of locomotion during exploration. (A) Representative examples of comodulograms computed for LFPs in OB, PLC, PAC, and hippocampus (CA1) simultaneously recorded during exploration with low (Left) and high (Right) speeds of locomotion. Notice similar coupling patterns for the different speeds: RR specifically modulates γ2 in OB and PLC, whereas theta (θ) modulates γ1 and γ3 in PAC and γ1 in CA1. Ampl, amplitude; Freq, frequency; MI, modulation index. (B) Mean coupling strength for exploration epochs of low and high speed. (C) Mean speed of locomotion for the same epochs analyzed in B and D. (D) Mean amplitude of γ1, γ2, and γ3 in each recorded region for low-speed and high-speed epochs. Gamma amplitude did not differ between low and high speeds during exploration (n = 8 mice in BD). (*P < 0.05.)
Fig. S4.
Fig. S4.
Region-specific and slow oscillation-specific coupling of different gamma subbands during REM sleep. (A) Wavelet spectrograms and superimposed LFP signals (white traces) from OB, PLC, PAC, and CA1 simultaneously recorded during REM sleep. The top and bottom traces show respiration (Resp) and θ signals. (B) Cross-frequency comodulograms, along with power spectra of LFPs (continuous white line) and Resp (dashed white line; same for all regions), computed during REM sleep. Note the differences in coupling from exploration (Fig. 2) and sniffing (Fig. S5) in OB and PLC and similarities in PAC and CA1. Notice the additional strong coupling between theta and γ3 (120–160 Hz) in PAC. All plots were obtained from the same epoch (group data are shown in Figs. S7 and S8).
Fig. S5.
Fig. S5.
Region-specific and slow oscillation-specific coupling of different gamma subbands during sniffing. (A) Wavelet spectrograms and superimposed LFP signals (white traces) from OB, PLC, PAC, and CA1 simultaneously recorded during sniffing. The top and bottom traces show respiration (Resp) and θ signals. (B) Cross-frequency comodulograms, along with power spectra of LFPs (continuous white line) and Resp (dashed white line; same for all regions), computed during sniffing. In this example, respiration frequency (i.e., peak of the dashed-line spectrum) is faster (∼10 Hz) than theta oscillations (7–8 Hz, peak of the continuous-line spectrum in CA1). Note the larger power of the RR compared with theta in OB and PLC, where RR specifically modulates γ2 (80–120 Hz). In PAC, theta oscillations have larger amplitude and modulate γ1 (40–80 Hz) and γ3 (120–160 Hz). In CA1, theta modulates γ1. All plots were obtained from the same epoch (group data are shown in Figs. S7 and S9).
Fig. S6.
Fig. S6.
Theta and RR power in different behavioral states and recorded regions. Theta power during NREM sleep should be interpreted with care because there is no genuine theta rhythm during this period but only irregular activity in the theta range. Similarly, theta power during immobility may not represent a genuine immobility theta but may partly represent electrographic signs of drowsiness. A single power value was obtained for each rhythm, which was the power value at the same frequency as nasal respiration for RR and the power value at the same frequency as the highest CA1 power peak in the range of 4–12 Hz for theta. All power values were corrected by subtracting the fitting of the reciprocal of frequency (1/f) over 2-30 Hz. Bars and error bars represent mean ± SEM over animals. Resp, respiration.
Fig. S7.
Fig. S7.
Mean coupling strength for theta and respiration rhythms and their specific gamma subbands in different behavioral states and brain regions. Due to proximity among the analyzed frequencies, absolute modulation indices may be influenced by “leakage” from neighboring frequencies. Normalized modulation ratios (Methods), which more reliably express coupling preference, are shown in Fig. 3C and Figs S8 and S9. Error bars represent SEM.
Fig. S8.
Fig. S8.
Regional and state specificity of modulation of gamma subbands by either theta or respiration during NREM and REM sleep. Shown are mean modulation ratios (Methods and main text). Positive ratios reflect modulation by theta, and negative ratios reflect modulation by RR. Asterisks show significant differences from zero (*P < 0.05, **P < 0.005, and ***P < 0.0005, one-way ANOVA and Dunnett’s multiple comparisons test; n = 6–8). Error bars represent SEM.
Fig. S9.
Fig. S9.
Regional specificity of modulation of gamma subbands by either theta or respiration during sniffing. Shown are mean modulation ratios (Methods and main text). Positive ratios reflect modulation by theta, and negative ratios reflect modulation by RR. Asterisks show significant differences from zero (*P < 0.05 and ***P < 0.0005, one-way ANOVA and Dunnett’s multiple comparisons test; n = 5–8). Error bars represent SEM.
Fig. 1.
Fig. 1.
Specific coupling between RR and γ2 (80–120 Hz) during immobility. (A) Wavelet spectrograms and superimposed LFP signals (white traces) from OB, PLC, PAC, and CA1 simultaneously recorded during awake immobility. The top trace shows nasal respiration (Resp) signal. ex, exhalation; in, inhalation. Note the presence of two subbands of gamma oscillations in OB: 40–80 Hz (γ1) and 80–120 Hz (γ2). (B) Pseudocolor maps depict cross-frequency comodulograms computed during immobility; warm colors denote phase-amplitude coupling (Methods). For each region, the superimposed white lines depict PSDs of LFPs (continuous line) and Resp (dashed line; same for all regions) plotted in different y-axis scales to allow inspection of power peaks. The peak of the dashed line indicates breathing rate (∼3 Hz in this example); all LFPs exhibit a power peak at the same frequency, which corresponds to RR. Notice specific coupling of γ2 to RR in the comodulograms and that coupling strength decreases from OB/PLC to PAC/CA1. All plots were obtained from the same epoch (group data are shown in Fig. 3).
Fig. 2.
Fig. 2.
Region-specific and slow oscillation-specific coupling of different gamma subbands during exploration. (A) Wavelet spectrograms and OB, PLC, PAC, and CA1 LFPs (white traces) simultaneously recorded during spatial exploration. The top and bottom traces depict Resp and the theta-filtered LFP (θ) signal, respectively. ex, exhalation; in, inhalation; Resp, respiration. (B) Cross-frequency comodulograms, along with power spectra of LFPs (continuous white line) and Resp (dashed white line; same for all regions), computed during exploration. In this example, respiration frequency (i.e., peak of the dashed-line spectrum) is faster (∼10 Hz) than theta oscillations (∼8 Hz, peak of the continuous-line spectrum in CA1). The OB LFP exhibits a power peak at theta and another at the respiration frequency, which corresponds to RR. PLC and PAC LFPs also exhibit power peaks at theta and RR, but the latter has much lower magnitude. In CA1, only a power peak at theta can be observed. The comodulograms show that γ2 (80–120 Hz) couples specifically to RR in OB and PLC, whereas γ1 (40–80 Hz) and γ3 (120–160 Hz) couple specifically to theta in PAC and CA1. All plots were obtained from the same epoch (group data are shown in Fig. 3).
Fig. 3.
Fig. 3.
Regional and state specificity of modulation of gamma subbands by either theta or respiration. Theta and RR power (A) and strength of theta-γ1, theta-γ3, and RR-γ2 coupling (B) during immobility (Imm.) and exploration (Exp.) are shown (mean over animals: *P < 0.05, **P < 0.005, and ***P < 0.0005; Wilcoxon signed rank or paired t test in A and Mann–Whitney or unpaired t test in B; n = 7–10). (C) Mean modulation ratios (Methods and main text). Positive ratios reflect modulation by theta, and negative ratios reflect modulation by RR. Asterisks show significant differences from zero (**P < 0.005 and ***P < 0.0005; one-way ANOVA and Dunnett’s multiple comparisons test; n = 7–10). In AC, error bars represent SEM.
Fig. 4.
Fig. 4.
RR and theta rhythms modulate spiking of neurons in PAC and PLC/ILC. (A, Top) Intracellular recording from a neuron in PAC significantly modulated by respiration (Resp). (A, Middle) Resp and PAC LFP signals. (A, Bottom) Spike distribution over the phases of respiration cycles. (B) As in A, but for a neuron in the ILC. Ex, exhalation; In, inhalation; prob., probability. (C) Percentage of significantly modulated units in PAC (Left) and PLC/ILC (Right) by theta (θ) alone, by Resp alone, by both rhythms, or by neither rhythm.
Fig. S10.
Fig. S10.
Example of a PAC neuron displaying membrane potential oscillation in synchrony with Resp. (Left) Traces show Resp (Top), intracellular signal (PAC cell, Middle), and PAC LFP (Bottom) simultaneously recorded during urethane anesthesia. (Right) Corresponding PSDs. Notice the presence of a prominent RR (∼3 Hz) both extracellularly (LFP) and intracellularly. Resp, respiration.
Fig. S11.
Fig. S11.
Respiration rhythm in PAC of an awake, immobile head-fixed mouse can be detected in both monopolar (mono) and bipolar (bip) recordings. (A, Left) Resp (Upper) and monopolar LFPs from a superficial electrode (Middle) and deep electrode (Lower) in PAC. (A, Right) Corresponding PSDs and coherences between Resp and each of the monopolar LFPs. (B, Left) Resp (Upper) and bipolar LFP recording in PAC (Lower, superficial electrode minus deep electrode). (B, Right) Corresponding PSDs and coherence between the bipolar PAC LFP and Resp. ex, exhalation; in, inhalation; Resp, respiration.
Fig. S12.
Fig. S12.
Respiration and theta rhythms modulate neuronal discharges in the PLC of awake, head-fixed immobile mice. (A, Top) Juxtacellular recording from a prelimbic neuron in an immobile mouse under head-fixed conditions. (A, Middle) Resp and PLC LFP signals. (A, Bottom) Spike distribution over the phases of respiration cycles for the same neuron. Firing probability (prob.) is significantly modulated by Resp (P < 0.001, Rayleigh test). (B) Percentages of prelimbic neurons in awake mice significantly modulated by Resp, theta, or both. Ex, exhalation; In, inhalation; Resp, respiration.

References

    1. Buzsáki G. Theta oscillations in the hippocampus. Neuron. 2002;33:325–340. - PubMed
    1. Buzsáki G. Neural syntax: Cell assemblies, synapsembles, and readers. Neuron. 2010;68:362–385. - PMC - PubMed
    1. Tort ABL, Komorowski R, Eichenbaum H, Kopell N. Measuring phase-amplitude coupling between neuronal oscillations of different frequencies. J Neurophysiol. 2010;104:1195–1210. - PMC - PubMed
    1. Tort ABL, Scheffer-Teixeira R, Souza BC, Draguhn A, Brankačk J. Theta-associated high-frequency oscillations (110-160Hz) in the hippocampus and neocortex. Prog Neurobiol. 2013;100:1–14. - PubMed
    1. Buzsáki G, Wang X-J. Mechanisms of gamma oscillations. Annu Rev Neurosci. 2012;35:203–225. - PMC - PubMed

Publication types

LinkOut - more resources