. 2017 Apr 25;114(17):E3516-E3525.
doi: 10.1073/pnas.1701352114. Epub 2017 Apr 10.

Context-dependent spatially periodic activity in the human entorhinal cortex

Affiliations

Context-dependent spatially periodic activity in the human entorhinal cortex

Zoltan Nadasdy et al. Proc Natl Acad Sci U S A. .

Abstract

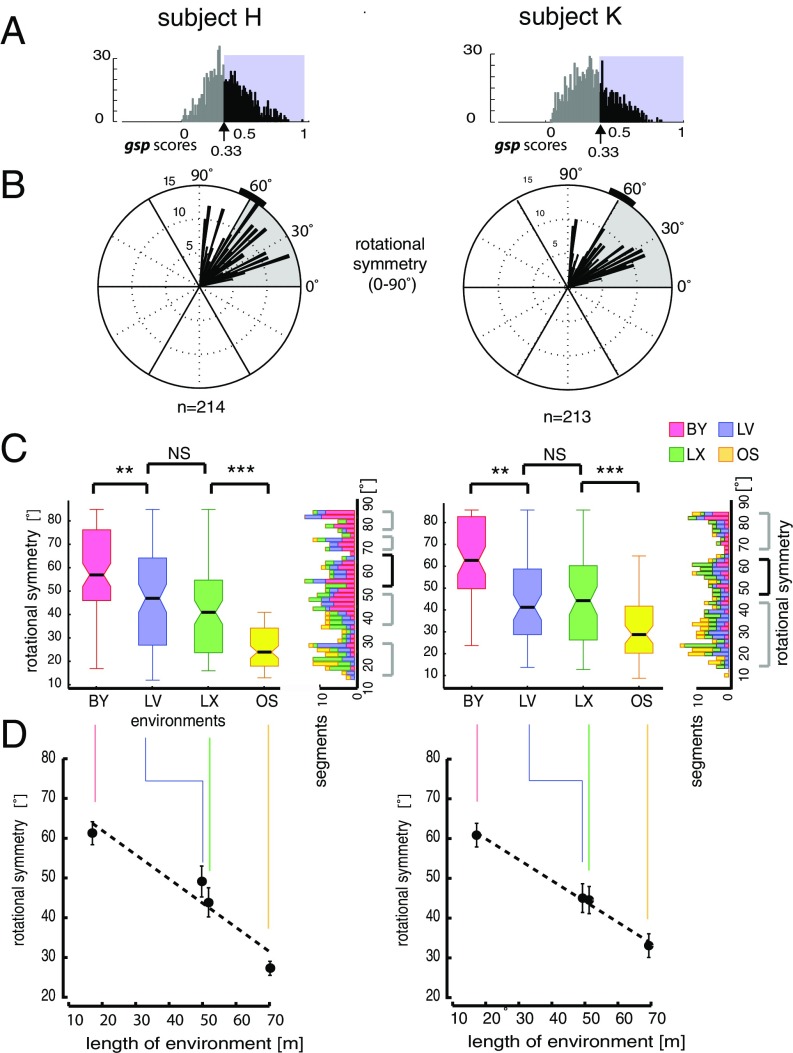
The spatially periodic activity of grid cells in the entorhinal cortex (EC) of the rodent, primate, and human provides a coordinate system that, together with the hippocampus, informs an individual of its location relative to the environment and encodes the memory of that location. Among the most defining features of grid-cell activity are the 60° rotational symmetry of grids and preservation of grid scale across environments. Grid cells, however, do display a limited degree of adaptation to environments. It remains unclear if this level of environment invariance generalizes to human grid-cell analogs, where the relative contribution of visual input to the multimodal sensory input of the EC is significantly larger than in rodents. Patients diagnosed with nontractable epilepsy who were implanted with entorhinal cortical electrodes performing virtual navigation tasks to memorized locations enabled us to investigate associations between grid-like patterns and environment. Here, we report that the activity of human entorhinal cortical neurons exhibits adaptive scaling in grid period, grid orientation, and rotational symmetry in close association with changes in environment size, shape, and visual cues, suggesting scale invariance of the frequency, rather than the wavelength, of spatially periodic activity. Our results demonstrate that neurons in the human EC represent space with an enhanced flexibility relative to neurons in rodents because they are endowed with adaptive scalability and context dependency.

Keywords: entorhinal cortex; grid cell; human; single unit; spatial memory.


Conflict of interest statement

The authors declare no conflict of interest.

Figures

Fig. 1.
Fig. 1.
Grid-cell expression in the human EC. (A) Position of EC electrode strip (yellow arrow) revealed on an axial MRI section. (Inset) Electrode location in the brain. The electrode design is magnified at the lower part of the image. Blue circles numbered from 1 to 6 are macroelectrode contacts. Dots grouped in square quartets and numbered from 7 to 22 are the microelectrodes. (B) Single-unit clusters (Left) and corresponding spike waveforms (Right). The separation of single-unit activity (SUA; red markers) from multiunit activity (MUA; black markers) is indicated by the Mahalanobis distance (d). (C) Trajectory of the subject’s navigation in an environment overlaid with the SUA (red circles; same neuron as in B). Yellow and blue circles indicate the positions of spaceship targets, and the green diamond indicates an example target location (SI Appendix, SI Experimental Procedures). (Inset) Neuron’s firing rate at different heading directions. (D) Average firing rate map. Color scale (spike * s−1). (E) Spatial AC of SUA computed from D. (F) Two-dimensional autoperiodogram of the AC from E. The X and Y axes represent frequency.
Fig. 2.
Fig. 2.
Adaptive rescaling of grids in different virtual environments. Screenshots (A), with space alien target objects and scale layouts (B) of the four different environments. Filled circles are space ships. Empty circles in LX are columns. (C) Spatial ACs from the same cell across all four environments capture the spatial periodicity of spikes generated by the same cell across the four environments. (DF) Boxes represent the distribution of grid periods from four datasets. (D) Environment-associated differences in grid distances derived from four datasets: SPCs (all cells), n(trials,cells) = 824,206 (blue boxes); PGChi-confs, n(trials,cells) = 262,65 (light-green boxes), pSPCs and pPGChi-confs active in all three confined environments, n(trials,cells) = 276,92 (dark-green boxes) and n(trials,cells) = 260,65 (yellow boxes), respectively. (E) Grid distances produced by pPGCs and pPGChi-confs that were active in the BY and at least one of the large environments (LX, LV, and OS) (n = 20) (red and yellow boxes, respectively). (F) Comparing grid distances of pPGCs and pPGChi-confs between LX and LV environments (n = 5) when the cells were active in both environments. The horizontal lines in boxes are medians, and boxes contain the 25th through 75th percentiles. Whiskers cover the most extreme data points and + signs are outliers. Grid periods were combined from both subjects during navigation in all four environments. The daily sequence of environments was randomized. ***P < 0.001. NS, not significant.
Fig. 3.
Fig. 3.
Grid period is environment-dependent and stable over days. (A) Grid periods are shown as a function of the size of the environment. Data were combined over multiple days from navigation trials in the same four environments and are displayed according to environments (BY, LX, LV, and OS) and subjects (patients K and H) (n = 436 and n = 388 segments, respectively). The length of the shorter axes of given environments (X) is plotted against the grid period (Y). The sparse-dashed lines represent identity lines. The fine-dashed lines are extrapolations of slopes. (B) Average grid periods from the two subjects grouped according to the environments (layouts on top) and consecutive days (days 1–8). The variation of grid periods over days was insignificant relative to the variation across environments. Error bars represent SEM. ***P < 0.001. NS, not significant.
Fig. 4.
Fig. 4.
Environment-dependent grid orientation. (A) ACs of two example neurons (cells 1 and 2) with their grid orientations in each environment within the same day of recording. The white line and corresponding α-values (in angular degrees) indicate grid orientation. (B) Population plots of grid orientations from all cells of the SPC dataset color-coded according to environments from the two subjects (Left and Center) and the same for the pPGC dataset (Right). comb., combined. Vectors in gray-shaded quadrants represent angular averages of the corresponding population of grid orientations, according to environments. (C) Grid orientations from the SPC dataset grouped according to environments (large groups) and consecutive recording days (individual filled symbols) from the two subjects (Left and Right, n = 311 and n = 376 segments, respectively). Error bars indicate angular dispersion. Colored lines represent grand averages of grid orientation associated with the three environments. Dashed lines are confidence intervals. Asterisks represent statistical significance of differences (*P < 0.05, ***P < 0.001). [rad], radian.
Fig. 5.
Fig. 5.
Rotational symmetry of spatial periodicity. (A) Distribution of gsp score per subject determined based on the spectral method. We selected neurons with gsp scores >0.33, the 5% confidence interval of the randomized spatial ACs (SI Appendix, SI Experimental Procedures and Fig. S3H). (B) Distributions of angles of rotational symmetry from the two subjects over all environments using a 2° bin size. The n values indicate the number of data segments. (C, Left) Box and whisker plots for grid rotational symmetries observed in each environment color-coded according to environments. (C, Right) Rotated histograms show the composition of rotation symmetries according to the environment. Note that in addition to data segments displaying ∼60° rotational symmetries (black bracket), comparable numbers of data segments exhibited rotational symmetry at other angles (gray brackets). **P < 0.01, ***P < 0.001. (D) Angle of rotational symmetry negatively correlated with environment size. Significant differences in angles of rotational symmetry were found across environments, except between LV and LX, consistent between both subjects (SI Appendix, Tables S8.1–S8.5). Error bars represent angular variance (Subjects H and K, n = 214 and n = 213 segments, respectively).

References

    1. Tolman EC. Cognitive maps in rats and men. Psychol Rev. 1948;55:189–208. - PubMed
    1. O’Keefe J, Dostrovsky J. The hippocampus as a spatial map. Preliminary evidence from unit activity in the freely-moving rat. Brain Res. 1971;34:171–175. - PubMed
    1. Suthana NA, Ekstrom AD, Moshirvaziri S, Knowlton B, Bookheimer SY. Human hippocampal CA1 involvement during allocentric encoding of spatial information. J Neurosci. 2009;29:10512–10519. - PMC - PubMed
    1. Burgess N. Spatial memory: How egocentric and allocentric combine. Trends Cogn Sci. 2006;10:551–557. - PubMed
    1. Braak H, Braak E. On areas of transition between entorhinal allocortex and temporal isocortex in the human brain. Normal morphology and lamina-specific pathology in Alzheimer’s disease. Acta Neuropathol. 1985;68:325–332. - PubMed

Publication types