. 2017 Jun;206(2):801-809.
doi: 10.1534/genetics.116.197954. Epub 2017 Apr 10.

Correlation of Meiotic DSB Formation and Transcription Initiation Around Fission Yeast Recombination Hotspots

Affiliations

Correlation of Meiotic DSB Formation and Transcription Initiation Around Fission Yeast Recombination Hotspots

Shintaro Yamada et al. Genetics. 2017 Jun.

Abstract

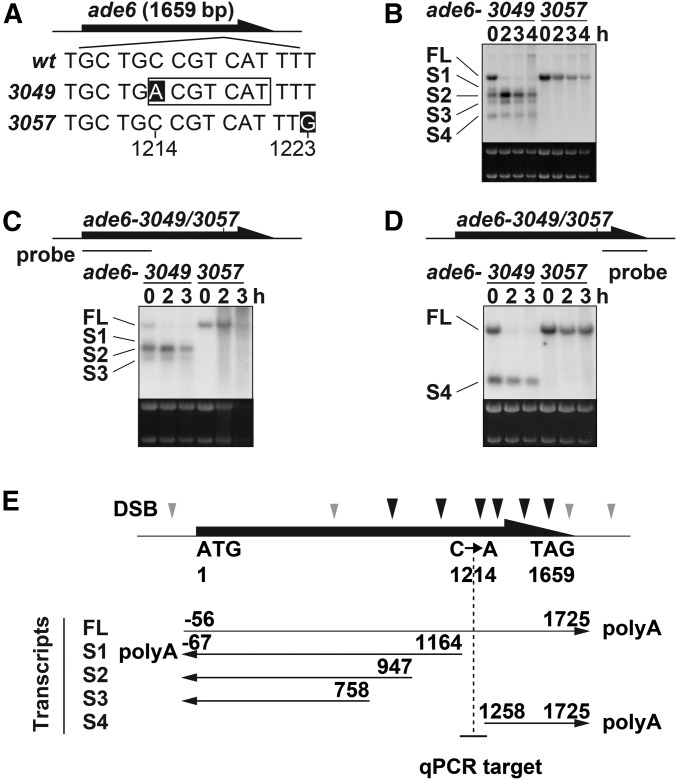
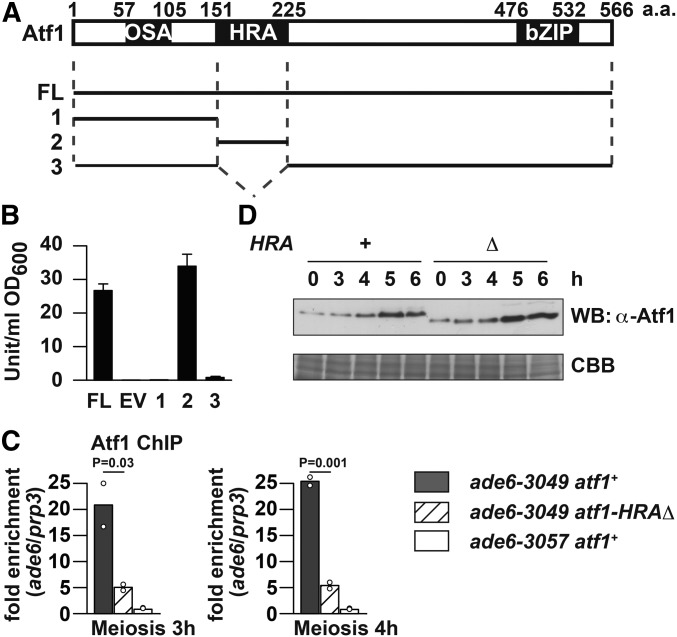
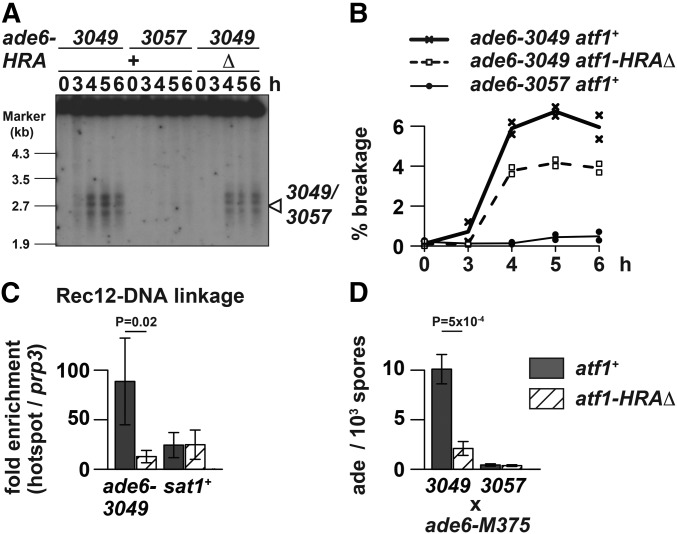
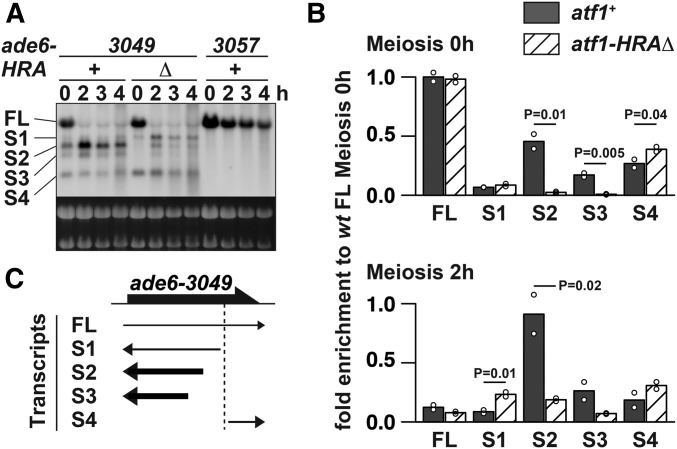
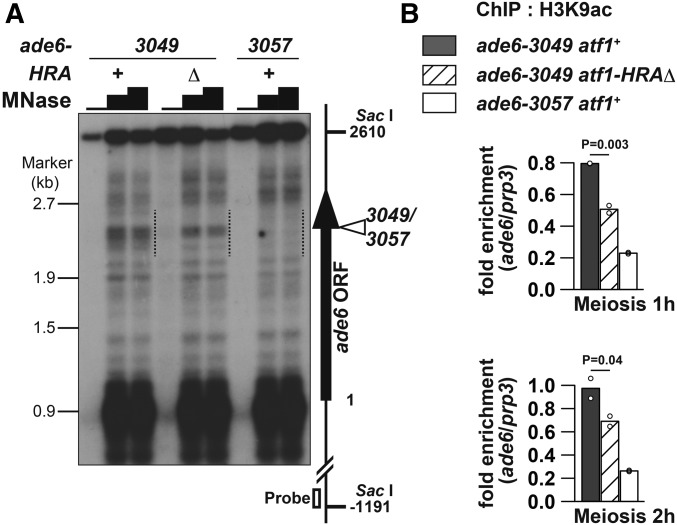
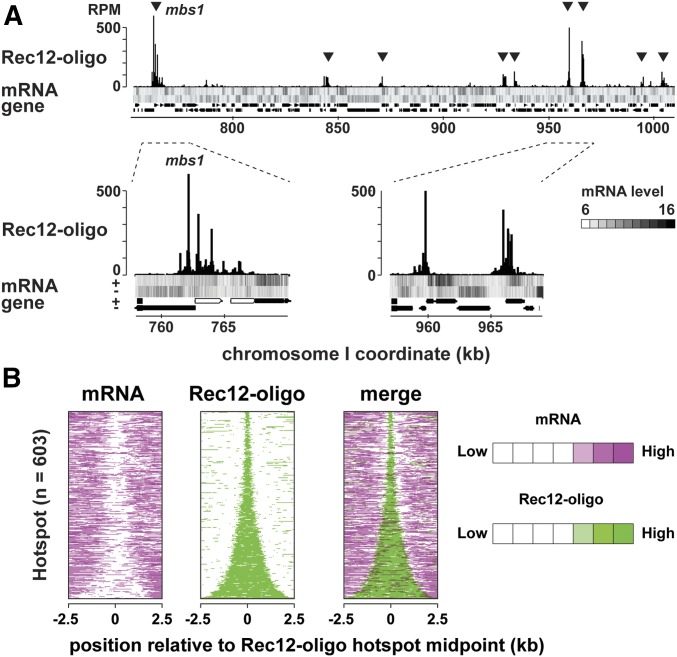
Meiotic homologous recombination, a critical event for ensuring faithful chromosome segregation and creating genetic diversity, is initiated by programmed DNA double-strand breaks (DSBs) formed at recombination hotspots. Meiotic DSB formation is likely to be influenced by other DNA-templated processes including transcription, but how DSB formation and transcription interact with each other has not been understood well. In this study, we used fission yeast to investigate a possible interplay of these two events. A group of hotspots in fission yeast are associated with sequences similar to the cyclic AMP response element and activated by the ATF/CREB family transcription factor dimer Atf1-Pcr1. We first focused on one of those hotspots, ade6-3049, and Atf1. Our results showed that multiple transcripts, shorter than the ade6 full-length messenger RNA, emanate from a region surrounding the ade6-3049 hotspot. Interestingly, we found that the previously known recombination-activation region of Atf1 is also a transactivation domain, whose deletion affected DSB formation and short transcript production at ade6-3049 These results point to a possibility that the two events may be related to each other at ade6-3049 In fact, comparison of published maps of meiotic transcripts and hotspots suggested that hotspots are very often located close to meiotically transcribed regions. These observations therefore propose that meiotic DSB formation in fission yeast may be connected to transcription of surrounding regions.

Keywords: DNA double-strand break formation; chromatin; meiosis; meiotic recombination; transcription.


Figures

Figure 1
Figure 1
ade6-3049 mutation induces ectopic transcripts at the ade6-3049 meiotic recombination hotspot. (A) Positions of ade6-3049 and ade6-3057 mutations (white letters). The numbers below the sequences indicate the positions relative to the first A of the ade6 ORF. (B) Transcripts around the ade6-3049/3057. Cells were induced to meiosis by nitrogen depletion and harvested at the indicated time after meiosis induction. Their total RNA was analyzed by Northern blotting using the probe recognizing the full-length ade6 ORF. Ribosomal RNA stained by ethidium bromide is shown as a loading control. (C) Same analyses as (B), but using a probe recognizing 5′ end of the ade6 ORF. (D) Same analyses as (B), but using a probe recognizing 3′ end of the ade6 ORF. (E) Estimated 5′ and 3′ end of ade6 mRNA based on Northern blotting and RACE analyses. Previously identified break sites are indicated by arrowheads, with stronger break sites by black ones (Steiner et al. 2002). The vertical dotted line and the horizontal short line indicate the position of the 3049 mutation and of the quantitative PCR (qPCR) fragment analyzed in Figure 2C, Figure 5B, and Figure S1, respectively. wt, wild type.
Figure 2
Figure 2
Transactivation domain of Atf1 is the previously identified HRA region, which is dispensable for Atf1 protein stability. (A) Previously known functional domains of Atf1 (Gao et al. 2008) and Atf1 fragments tested for transactivation activity. FL, full length (of Atf1). (B) Quantification of β-galactosidase activity detected in cells expressing LexA BD-Atf1 fusion protein. Results of three independent experiments with SDs are shown. EV, empty vector. (C) ChIP of Atf1 and Atf1-HRAΔ. Indicated cells of pat1-114 background were induced to enter meiosis by temperature-shift method, and harvested at indicated hours after the induction. ChIP using anti-Atf1 antibody was performed, and DNA was isolated from immunoprecipitates as well as whole-cell extracts. Obtained DNA was analyzed by real-time qPCR, where fragments corresponding to ade6-3049/3057 and the prp3+ promoter were amplified. Relative enrichment at ade6-3049/3057 over prp3 is shown. Bar graphs are created based on mean values of two independent experiments (shown by ○). (D) Western blotting of Atf1 and Atf1-HRAΔ during meiosis. pat1-114 atf1+ and pat1-114 atf1-HRAΔ cells were induced to enter meiosis by temperature-shift method, and harvested at indicated hours after the induction. Whole-cell extract was analyzed by Western blotting using anti-Atf1 antibody (WB: α-Atf1). An SDS-PAGE gel in which the same amount of whole-cell extract was fractionated was stained by Coomassie brilliant blue and is shown as a loading control (CBB).
Figure 3
Figure 3
Deletion of the Atf1 HRA region affected meiotic recombination at ade6-3049. (A) Effects of HRA deletion on DSB formation at the ade6-3049 hotspot. Indicated cells of the pat1-114 rad50S background were induced to enter meiosis by temperature-shift method, and harvested at the indicated hours after the induction. Genomic DNA was isolated, digested with Afl II, and analyzed by Southern blotting as previously described (Steiner et al. 2002). The position of the 3049 or 3057 mutations is marked by the arrowhead. (B) Quantitative analyses of DSB formation presented in (A). The DSB (%) values were obtained by dividing the signal intensity of broken DNA fragments over that of the unbroken parental fragment. Mean values of two independent experiments are plotted. (C) Effects of HRA deletion on Rec12-DNA linkage production at the ade6-3049 hotspot. Rec12-FLAG-expressing pat1-114 rad50S strains with or without HRA were induced to enter meiosis by temperature-shift method, and harvested 5 hr after the induction. Rec12-FLAG-DNA linkage was chromatin immunoprecipitated by anti-FLAG antibody. DNA isolated from immunoprecipitates and whole-cell extracts was analyzed by real-time qPCR, where fragments corresponding to the hotspots (ade6-3049 and sat1) and the prp3+ promoter (prp3) were amplified. Relative enrichment at hotspots over prp3 was calculated and mean values of three independent experiments as well as their SD are shown. (D) Effects of HRA deletion on meiotic gene conversion at the ade6-3049 hotspot. Recombination frequency was measured between ade6-M375 and either ade6-3049 or ade6-3057 by counting the number of ade+ spores. Mean values of three independent experiments and their SD are shown.
Figure 4
Figure 4
Deletion of the Atf1 HRA region affected transcription at ade6-3049. (A) Effects of HRA deletion on transcripts production around ade6-3049. Total RNA was analyzed by Northern blotting as explained in Figure 1B. (B) Quantitative analyses of ade6 transcripts shown in (A). Abundance of transcripts, detected in atf1+ (filled bars) and atf1-HRAΔ (hatched bars) cells at 0 h (top) and 2 hr (bottom) after meiosis induction, were estimated by quantifying signal intensities of each transcript and normalizing them to the mean value of full-length ade6 mRNA present in atf1+ cells at 0 hr. The numbers of transcripts are the same as those indicated in (A). Bar graphs are created based on mean values of two independent experiments (shown by ○). (C) Graphic summary of results shown in (A) and (B). RNAs strongly affected (more than twofold for both time points) by the atf1-HRAΔ mutation were shown as bold black arrows. The vertical dotted line indicates the position of the 3049 mutation.
Figure 5
Figure 5
Chromatin structure around ade6-3049 is more open than around ade6-3057, and HRA is involved in the chromatin regulation. (A) MNase sensitivity of chromatin around ade6-3049/3057. Indicated cells of the pat1-114 background were induced to enter meiosis by temperature-shift method, and harvested 3 hr after the induction. MNase-digested DNA was prepared by MNase (0, 20, or 30 units) treatment of chromatin fraction and subsequent purification. DNA was further cut with Sac I, fractionated on 1.2% agaraose gel, and analyzed by Southern blotting using the probe indicated by the open box. The vertical arrow and the open arrowhead show the ade6 ORF and the 3049/3057 site, respectively. The numbers on the left and the right side of the panel indicate the positions of λ/EcoT14 I fragments used for electrophoresis marker and the positions from the first A of the ade6 ORF, respectively. The dotted lines indicate a region in which MNase-sensitive sites are clustered around ade6-3049. Presented is an example from two independent experiments, whose results were similar to each other. (B) HRA deletion reduced acetylation level of H3K9 around ade6-3049. Indicated cells of the pat1-114 background were induced to enter meiosis by temperature-shift method, and harvested 1 or 2 hr after the induction. ChIP using anti-H3K9ac antibody was performed as described previously (Yamada et al. 2013). DNA isolated from immunoprecipitates and whole-cell extracts was analyzed by real-time qPCR, where fragments corresponding to ade6-3049/3057 and the prp3+ promoter were amplified. Relative enrichment at ade6-3049/3057 over prp3 is shown. Bar graphs are created based on mean values of two independent experiments (shown by ○).
Figure 6
Figure 6
Correlation between transcription and recombination initiation sites around fission yeast hotspots. (A) An example of uniquely mapped Rec12-oligo and complementary DNA of meiotic transcripts hybridized to genome tiling array. The x-axis shows the chromosomal coordinates in base pairs, and the y-axis shows reads per million base pairs (RPM). The heat map shows the log2 signal strength of forward and reverse transcripts. Black and white represent up- or downregulation of gene expression. Protein-coding genes and RNA genes are shown as filled black and gray boxes at the bottom of the figure, respectively. Two regions are zoomed to show the locations of Rec12-oligo and transcripts within hotspots. (B) Heat maps of transcripts (left) and Rec12-oligo (middle) around hotspots. All hotspots on the genome (n = 603) were ranked by width and their midpoints were aligned. Data of transcripts (magenta) and Rec12-oligo (green) were overlaid to show on a color scale (right). Magenta and green represent high signals, while white represents low signals.

Similar articles

Cited by

References

    1. Borde V., de Massy B., 2013. Programmed induction of DNA double strand breaks during meiosis: setting up communication between DNA and the chromosome structure. Curr. Opin. Genet. Dev. 23: 147–155. - PubMed
    1. Borde V., Goldman A. S., Lichten M., 2000. Direct coupling between meiotic DNA replication and recombination initiation. Science 290: 806–809. - PubMed
    1. Brick K., Smagulova F., Khil P., Camerini-Otero R. D., Petukhova G. V., 2012. Genetic recombination is directed away from functional genomic elements in mice. Nature 485: 642–645. - PMC - PubMed
    1. Chen D., Toone W. M., Mata J., Lyne R., Burns G., et al. , 2003. Global transcriptional responses of fission yeast to environmental stress. Mol. Biol. Cell 14: 214–229. - PMC - PubMed
    1. Choi K., Zhao X., Kelly K. A., Venn O., Higgins J. D., et al. , 2013. Arabidopsis meiotic crossover hot spots overlap with H2A.Z nucleosomes at gene promoters. Nat. Genet. 45: 1327–1336. - PMC - PubMed

MeSH terms

Substances

LinkOut - more resources