. 2017 Jun;206(2):953-971.
doi: 10.1534/genetics.117.201921. Epub 2017 Apr 10.

Adipocyte Metabolic Pathways Regulated by Diet Control the Female Germline Stem Cell Lineage in Drosophila melanogaster

Affiliations

Adipocyte Metabolic Pathways Regulated by Diet Control the Female Germline Stem Cell Lineage in Drosophila melanogaster

Shinya Matsuoka et al. Genetics. 2017 Jun.

Abstract

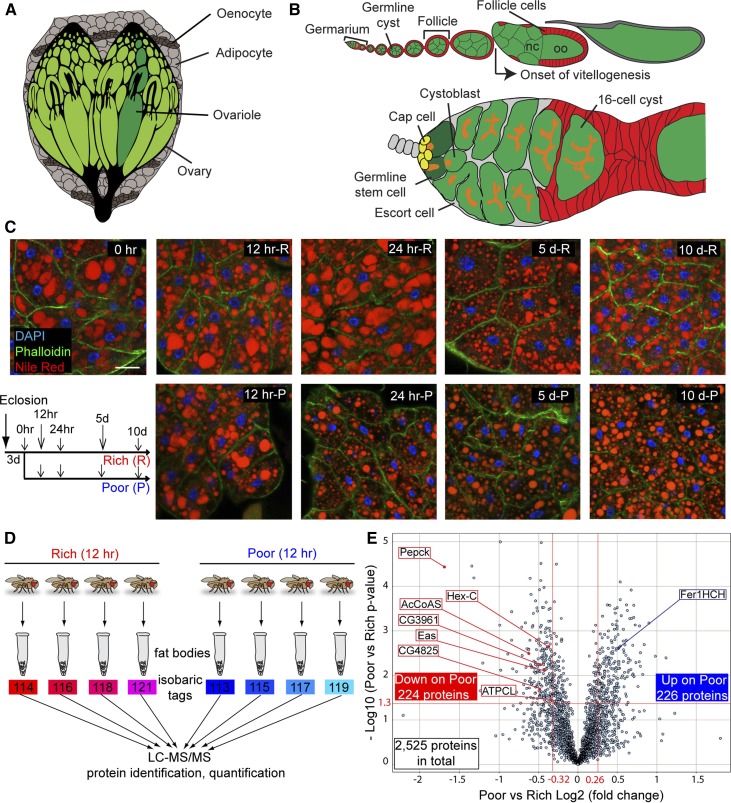
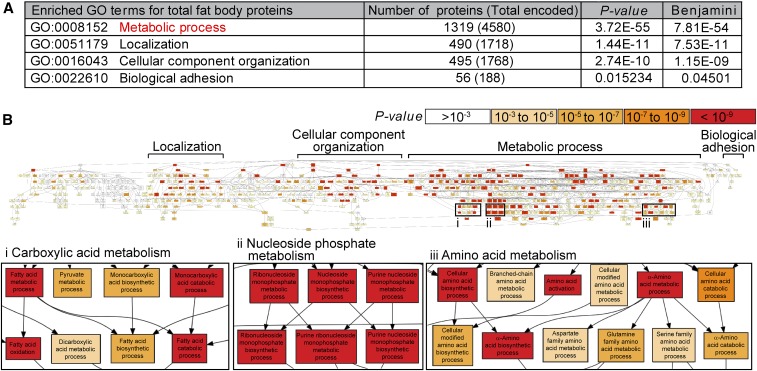
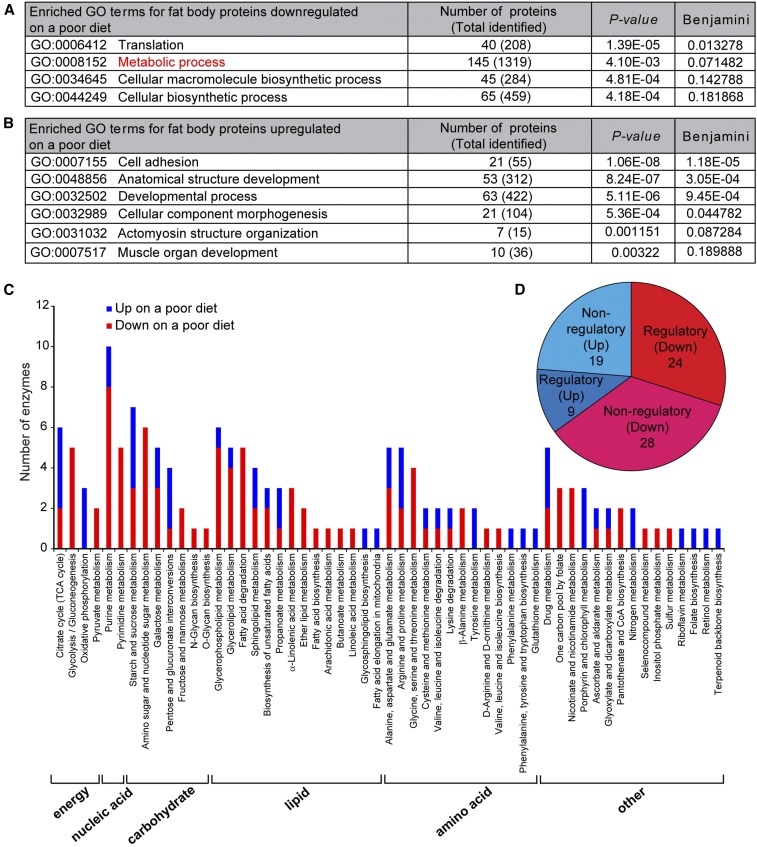
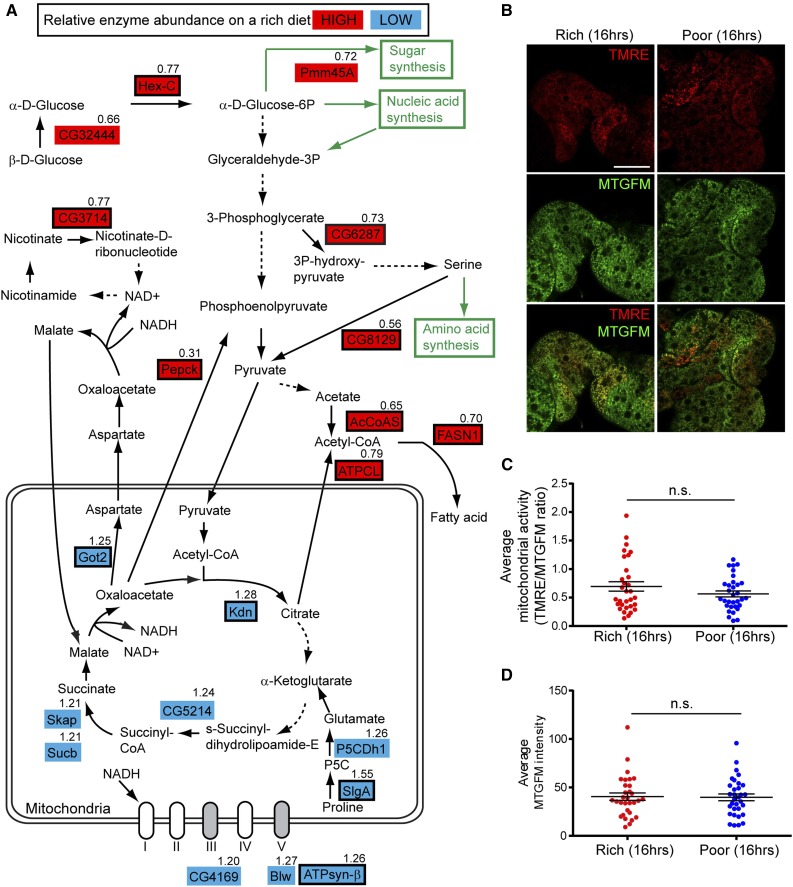
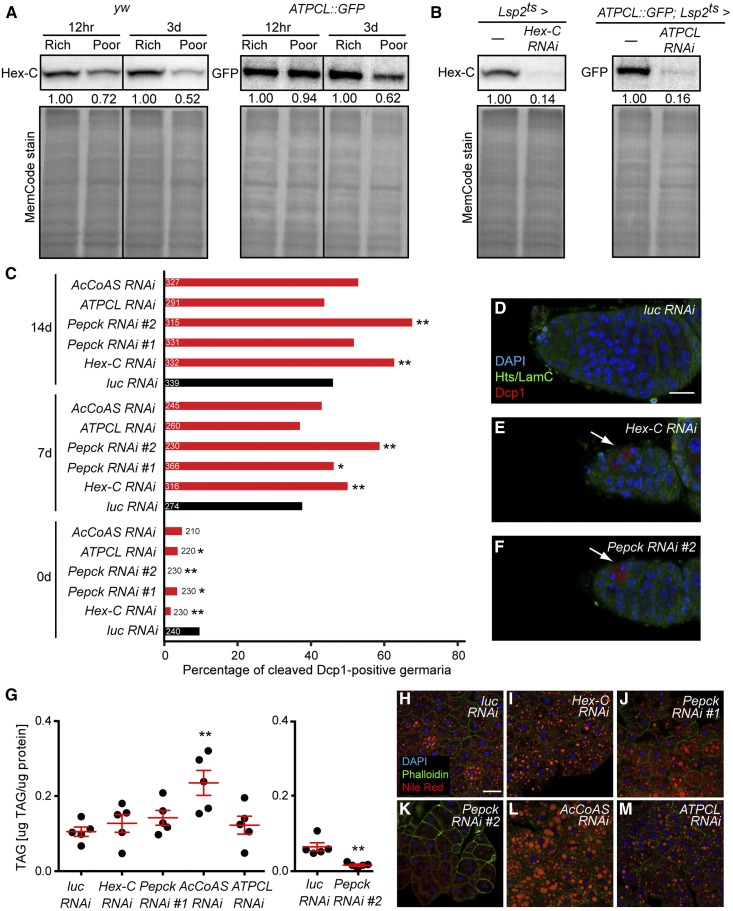
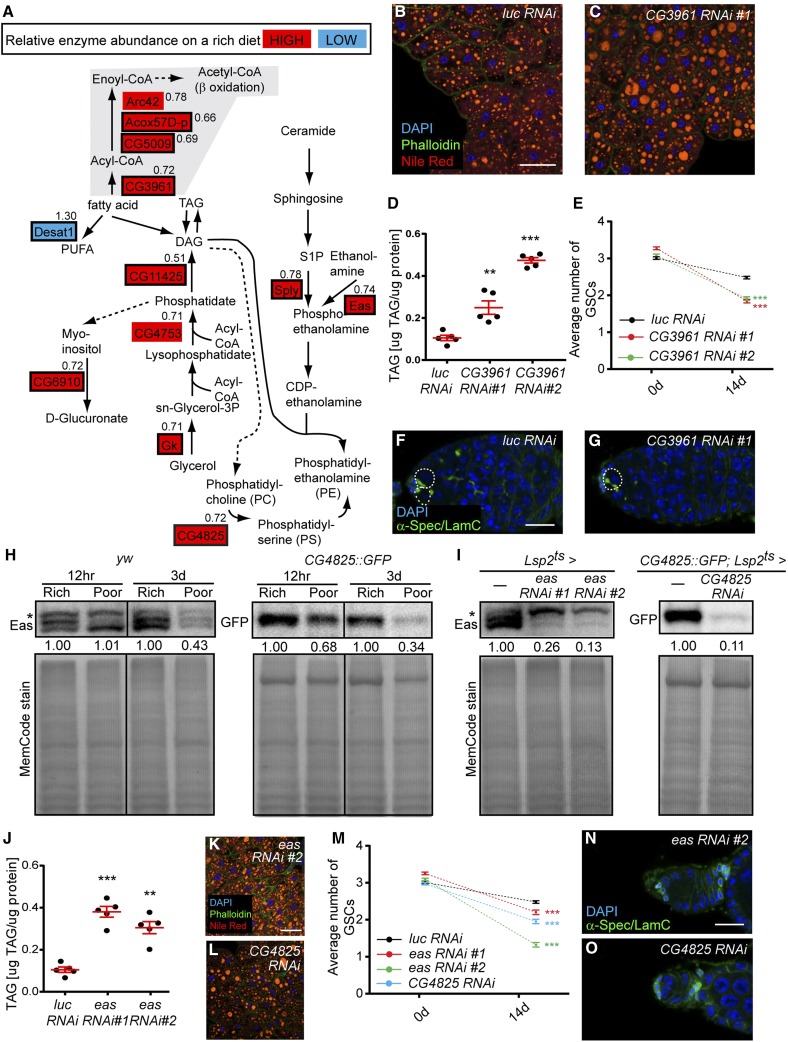
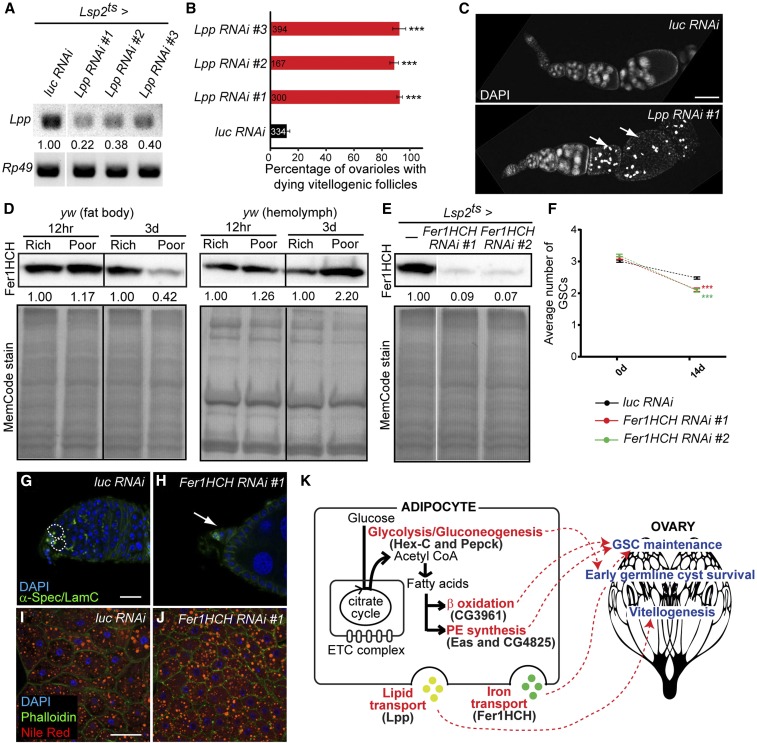
Nutrients affect adult stem cells through complex mechanisms involving multiple organs. Adipocytes are highly sensitive to diet and have key metabolic roles, and obesity increases the risk for many cancers. How diet-regulated adipocyte metabolic pathways influence normal stem cell lineages, however, remains unclear. Drosophila melanogaster has highly conserved adipocyte metabolism and a well-characterized female germline stem cell (GSC) lineage response to diet. Here, we conducted an isobaric tags for relative and absolute quantification (iTRAQ) proteomic analysis to identify diet-regulated adipocyte metabolic pathways that control the female GSC lineage. On a rich (relative to poor) diet, adipocyte Hexokinase-C and metabolic enzymes involved in pyruvate/acetyl-CoA production are upregulated, promoting a shift of glucose metabolism toward macromolecule biosynthesis. Adipocyte-specific knockdown shows that these enzymes support early GSC progeny survival. Further, enzymes catalyzing fatty acid oxidation and phosphatidylethanolamine synthesis in adipocytes promote GSC maintenance, whereas lipid and iron transport from adipocytes controls vitellogenesis and GSC number, respectively. These results show a functional relationship between specific metabolic pathways in adipocytes and distinct processes in the GSC lineage, suggesting the adipocyte metabolism-stem cell link as an important area of investigation in other stem cell systems.

Keywords: Drosophila; adipocytes; germline; metabolism; oogenesis; stem cells.


Figures

Figure 1
Figure 1
The fat body proteome undergoes significant changes within 12 hr of dietary switch. (A) The Drosophila fat body, composed of adipocytes and hepatocyte-like oenocytes, surrounds multiple organs. (B) Structure of ovariole (top) and germarium (bottom). Each ovariole contains chronologically arranged follicles, each composed of a 16-cell germline cyst (one oocyte, oo, and 15 nurse cells, nc) enveloped by follicle cells, and vitellogenesis begins at stage 8. Follicles are formed in the germarium, which contains germline stem cells (GSCs) associated with cap cells and a subset of escort cells. Each GSC division produces one GSC and one cystoblast that incompletely divides four times to form a 16-cell cyst. A germline-specific organelle, the fusome (orange), becomes progressively more branched as cysts divide. (C) Adipocyte morphology on different diets. Newly eclosed females were kept for 3 days on a rich diet (R) prior to being switched to a poor diet (P). Control females remained on a rich diet. DAPI (blue), adipocyte nuclei; Nile Red (red), lipid droplets; Phalloidin (green), cell membranes. Scale bar, 40 μm. (D) Isobaric tags for relative and absolute quantification (iTRAQ) flow chart. Four replicates of fat body proteins from females maintained for 12 hr on either rich or poor diets were subjected to iTRAQ analysis. LC-MS/MS, liquid chromatography - tandem mass spectrometry. (E) Volcano plot showing fat body proteins identified by iTRAQ. Proteins with Poor vs. Rich ratio < 0.8 or > 1.2 (red lines at −0.32 and 0.26, respectively, on x-axis) and showing a P-value of < 0.05 by Student’s t-test (red line at 1.3 on y-axis) were considered differentially expressed in response to diet. The x-axis values represent Log2 (Poor to Rich fold change), whereas y-axis values represent −Log10 (Poor vs. Rich P-value). Eight differentially expressed proteins analyzed in this study are indicated. AcCoAS, acetyl-CoA synthase; ATPCL, ATP citrate lyase; CG3961, long-chain acyl-CoA synthase; CG4825, phosphatidylserine synthase 1; Eas, Ethanolamine kinase; Fer1HCH, Ferritin 1 Heavy Chain Homolog; Hex-C, hexokinase-C; Pepck, phosphoenolpyruvate carboxykinase.
Figure 2
Figure 2
The fat body proteome is enriched for metabolic proteins. (A) Gene ontology (GO) term analysis of fat body proteome using DAVID. The number of proteins identified by iTRAQ (isobaric tags for relative and absolute quantification) in each GO category is listed. The total number of proteins encoded in the Drosophila genome in each category is shown in parentheses. The original P-value and corrected P-value (Benjamini) are shown (Fisher’s exact test). (B) Visual representation of GO term analysis of fat body proteome using GOrilla (Eden et al. 2009). Proteins involved in metabolic processes are highly enriched.
Figure 3
Figure 3
Eighty metabolic enzymes including 33 regulatory enzymes are differentially expressed in response to diet. (A and B) GO term analysis of fat body proteins downregulated (A) or upregulated (B) on a poor diet using DAVID. The number of proteins downregulated or upregulated on a poor diet is shown for each GO category. The total number of proteins identified in the fat body proteome for each category is shown in parentheses. The original P-value and corrected P-value (Benjamini) are shown (Fisher’s exact test). (C) Distribution of 80 metabolic enzymes downregulated or upregulated on a poor diet spanning 55 metabolic pathways using KEGG. A subset of metabolic enzymes maps to two or more metabolic pathways that partially overlap, such that the sum of metabolic enzymes plotted in the graph is > 80. (D) Pie chart of metabolic enzymes downregulated or upregulated on a poor diet. Among 145 proteins with the GO term “metabolic process” downregulated on a poor diet (A), only 52 (24 regulatory plus 28 nonregulatory) represent metabolic enzymes. GO, Gene ontology; KEGG, Kyoto Encyclopedia of Genes and Genomes; TCA, tricarboxylic acid.
Figure 4
Figure 4
The metabolism of the fat body on a rich diet favors pyruvate/acetyl-CoA production and macromolecule biosynthesis. (A) Diagram of diet-dependent changes in the levels of metabolic enzymes in the glycolytic pathway, citric acid cycle, and electron transport chain. Enzymes showing relatively high or low abundance on a rich diet are highlighted in red or blue, respectively. Regulatory enzymes are indicated by a black rectangular outline. Poor to Rich iTRAQ (isobaric tags for relative and absolute quantification) ratio is shown for each metabolic enzyme. Solid arrows indicate direct conversion of metabolites, whereas dashed arrows signify multiple enzymatic steps. Regulatory enzymes that contribute to pyruvate/acetyl-CoA production, including Hex-C (Hexokinase-C), Pepck (phosphoenolpyruvate carboxykinase), AcCoAS (acetyl-CoA synthase), and ATPCL (ATP citrate lyase) are upregulated on a rich diet, whereas regulatory enzymes in the citric acid cycle and electron transport chain are downregulated on a rich diet, suggesting that the fat body favors building block production. (B) Live adipocytes from females maintained for 16 hr either on rich or poor diet simultaneously stained with the membrane potential-dependent mitochondrial dye tetramethylrhodamine, ethyl ester (TMRE) and the membrane potential-independent mitochondrial dye Mitotracker Green FM (MTGFM). Scale bar, 40 μm. (C and D) Average normalized mitochondrial activity (TMRE/MTGFM ratio) (C) and average MTGFM intensity (proportional to total mitochondrial mass) (D) in adipocytes from females illustrated in (B) (n = 31 adipocyte fields for Rich and n = 32 adipocyte fields for Poor; 16 females were examined for each dietary condition). n.s., not significant, Student’s t-test.
Figure 5
Figure 5
Regulatory enzymes involved in pyruvate/acetyl-CoA production in adipocytes promote survival of early germline cysts. (A) Western blots showing expression of Hex-C and ATPCL::GFP in dissected fat bodies at 12 hr and 3 days on rich vs. poor diets. The expression levels on a poor diet were normalized to those on a rich diet for each time point. Total loaded proteins are shown with MemCode stain. (B) Western blotting analysis of Hex-C and ATPCL::GFP in fat body at 7 days of Lsp2ts-mediated RNAi against Hex-C and ATPCL, respectively. Total proteins are used as a loading control (bottom). (C) Percentage of germaria containing cleaved Dcp1-positive cysts at 0, 7, or 14 days of Lsp2ts-mediated RNAi against Hex-C, Pepck, ATPCL and AcCoAS. The number of germaria analyzed from three independent experiments is shown inside or to the right of bars. *P < 0.05, **P < 0.01, Chi-square test. (D–F) Germaria of females subjected to 14 days of Lsp2ts-mediated luciferase (luc) control (D), Hex-C (E), or Pepck (F) RNAi knockdown. Hts (green), fusome; Lamin C (green), cap cell nuclear envelope; cleaved Dcp1 (red), dying cystoblasts/cysts; DAPI (blue), nuclei. Arrows indicate dying germ cells. Scale bar, 10 μm. (G) TAG contents (μg TAG/μg protein) in dissected fat bodies at 7 days of Lsp2ts-mediated RNAi against luc control, Hex-C, Pepck, AcCoAS and ATPCL. **P < 0.01, Student’s t-test. (H–M) Adipocytes at 7 days of Lsp2ts-mediated RNAi against luc control, Hex-C, Pepck, AcCoAS and ATPCL. DAPI (blue), nuclei; Phalloidin (green), actin; Nile Red (red), lipid droplets. Scale bar, 40 μm. AcCoAS, acetyl-CoA synthase; ATPCL, ATP citrate lyase; Hex-C, hexokinase-C; luc, luciferase; Pepck, phosphoenolpyruvate carboxykinase; RNAi, RNA interference; TAG, triacylglycerol.
Figure 6
Figure 6
Regulatory enzymes involved in fatty acid oxidation and PE synthesis in adipocytes promote GSC maintenance. (A) Diagram of diet-dependent changes in the levels of metabolic enzymes regulating fatty acid utilization. Metabolic enzymes showing relatively high or low abundance on a rich diet are highlighted in red or blue, respectively. Regulatory enzymes are indicated by a black rectangular outline. Poor to Rich iTRAQ ratio is shown for each metabolic enzyme. Solid arrows indicate a direct reaction, whereas dashed arrows signify multiple enzymatic reactions. (B and C) Adipocytes at 7 days of Lsp2ts-mediated RNAi against luc control and CG3961. DAPI (blue), nuclei; Phalloidin (green), actin; Nile Red (red), lipid droplets. Scale bar, 40 μm. (D) TAG contents (μg TAG/μg protein) in fat body at 7 days of Lsp2ts-mediated RNAi against luc control and CG3961. **P < 0.01, ***P < 0.001, Student’s t-test. (E) Average number of GSCs per germarium at 0 and 14 days of Lsp2ts-mediated RNAi against luc control and CG3961. Numbers of germaria analyzed from three independent experiments are: 245 for luc control RNAi 0d; 270 for luc control RNAi 14d; 225 for CG3961 RNAi #1 0d; 270 for CG3961 RNAi #1 14d; 253 for CG3961 RNAi #2 0d; and 270 for CG3961 RNAi #2 14d. ***P < 0.001, two-way ANOVA with interaction. (F and G) Examples of germaria at 14 days of Lsp2ts-mediated RNAi against luc control and CG3961. α-Spectrin (green), fusome; Lamin C (green), cap cell nuclear envelope; DAPI (blue), nuclei. GSCs are outlined. Scale bar, 10 μm. (H) Western blots of Eas and CG4825::GFP in fat bodies at 12 hr or 3 days on rich vs. poor diets. The expression levels on a poor diet are normalized to those on a rich diet for each time point. Total loaded protein shown with MemCode stain below. (I) Western blots of Eas and CG4825::GFP in fat body at 7 days of Lsp2ts-mediated RNAi against eas and CG4825. Total protein shown as a loading control (bottom). Asterisks in (H) and (I) indicate nonspecific bands (Pascual et al. 2005). (J) TAG contents (μg TAG/μg protein) in fat body at 7 days of Lsp2ts-mediated RNAi against luc control and eas. **P < 0.01, ***P < 0.001, Student’s t-test. Experiments in (D) and (J) were conducted in parallel, and same control data (luc RNAi) are shown in both graphs. (K and L) Adipocytes stained as in (B and C) at 7 days of Lsp2ts-mediated RNAi against eas and CG4825. Scale bar, 40 μm. (M) Average number of GSCs per germarium at 0 and 14 days of Lsp2ts-mediated RNAi against luc control, eas, and CG4825. Numbers of germaria analyzed from three independent experiments are: 245 for luc control RNAi 0d; 270 for luc control RNAi 14d; 256 for eas RNAi #1 0d; 260 for eas RNAi #1 14d; 258 for eas RNAi #2 0d; 252 for eas RNAi #2 14d; 250 for CG4825 RNAi 0d; 260 for CG4825 RNAi 14d. ***P < 0.001, two-way ANOVA with interaction. Experiments in (E) and (M) were conducted in parallel, and the same control data (luc RNAi) are shown in both graphs. (N and O) Examples of germaria at 14 days of Lsp2ts-mediated RNAi against eas and CG4825, labeled with α-Spectrin (green, fusome), Lamin C (green, cap cell nuclear envelope), and DAPI (blue, DNA). No GSCs are present in these germaria of eas and CG4825 adipocyte RNAi females (compare to F). Scale bar, 10 μm. CG4825, phosphatidylserine synthase 1; Eas, easily shocked; GSC, germline stem cell; iTRAQ, isobaric tags for relative and absolute quantification; luc, luciferase; PE, phosphatidylethanolamine; RNAi, RNA interference; TAG, triacylglycerol.
Figure 7
Figure 7
Lipid and iron transport from adipocytes affects vitellogenesis and germline stem cell (GSC) maintenance, respectively. (A) RT-PCR analysis of Lipophorin (Lpp) mRNA expression in the fat body at 7 days of Lsp2ts-mediated RNA interference (RNAi) induction against Lpp showing knockdown of Lpp. Relative Lpp expression levels in Lpp RNAi normalized to that in luc RNAi control are shown. Rp49 is used as a control. (B) Percentage of ovarioles with dying vitellogenic follicles based on pyknotic nuclei at 7 days of Lsp2ts-mediated RNAi against luc control and Lpp using three different RNAi lines. The number of ovarioles analyzed from three independent experiments is shown inside bars. ***P < 0.001, Student’s t-test. Data shown as mean ± SEM (C) Ovarioles stained with DAPI (nuclei) at 7 days of Lsp2ts-mediated RNAi against luc control and Lpp. Arrows indicate dying vitellogenic follicles. (D) Western blots of Ferritin 1 Heavy Chain Homolog (Fer1HCH) in dissected fat bodies and extracted hemolymph at 12 hr or 3 days on rich or poor diets. Fer1HCH levels decrease in the fat body and increase in the hemolymph over time on a poor diet, indicating increased secretion. Fer1HCH levels on a poor diet are normalized to those on a rich diet for each time point. Total loaded proteins are shown with MemCode stain below. (E) Western blotting analysis of Fer1HCH expression levels in fat body at 7 days of Lsp2ts-mediated RNAi against Fer1HCH. Total proteins are used as a loading control (bottom). (F) Average number of GSCs per germarium at 0 and 14 days of Lsp2ts-mediated RNAi against luc control and Fer1HCH. Numbers of germaria analyzed from three independent experiments are: 245 for luc control RNAi 0d; 270 for luc control RNAi 14d; 227 for Fer1HCH RNAi #1 0d; 260 for Fer1HCH RNAi #1 14d; 223 for Fer1HCH RNAi #2 0d; and 260 for Fer1HCH RNAi #2 14d. ***P < 0.001, two-way ANOVA with interaction. These experiments were done in parallel to those in Figure 6, E and M and the same control data (luc RNAi) are plotted. (G and H) Germaria at 14 days of Lsp2ts-mediated RNAi against luc control or Fer1HCH, showing a severe example of GSC loss in (H), with the very small germarium indicated by an arrow. α-Spectrin (green), fusome; Lamin C (green), cap cell nuclear envelope; DAPI (blue), nuclei. GSCs are outlined. Scale bar, 10 μm. (I and J) Adipocytes at 7 days of Lsp2ts-mediated RNAi against luc control and Fer1HCH. DAPI (blue), nuclei; Phalloidin (green), actin; Nile Red (red), lipid droplets. Scale bar, 40 μm. (K) Model for germline control by adipocyte metabolism. Hex-C (Hexokinase-C) and Pepck (Phosphoenolpyruvate carboxykinase) ensure the survival of early germline cysts, whereas Eas (Ethanolamine kinase), CG4825 (Phosphatidylserine synthase 1), and CG3961 (Long-chain acyl-CoA synthase) help maintain GSCs, suggesting that adipocyte metabolic pathways refine the regulation of diet-dependent steps of oogenesis. Adipocyte lipid transport by Lipophorin (Lpp) and iron transport by Fer1HCH also contribute to the control of vitellogenesis and GSC maintenance, respectively. Thick black arrows indicate relatively high abundance of metabolic enzymes in these pathways on a rich diet compared to a poor diet. ETC, electron transport chain.

Similar articles

Cited by

References

    1. Ables E. T., Drummond-Barbosa D., 2010. The steroid hormone ecdysone functions with intrinsic chromatin remodeling factors to control female germline stem cells in Drosophila. Cell Stem Cell 7: 581–592. - PMC - PubMed
    1. Ables E. T., Laws K. M., Drummond-Barbosa D., 2012. Control of adult stem cells in vivo by a dynamic physiological environment: diet-dependent systemic factors in Drosophila and beyond. Wiley Interdiscip. Rev. Dev. Biol. 1: 657–674. - PMC - PubMed
    1. Ables E. T., Hwang G. H., Finger D. S., Hinnant T. D., Drummond-Barbosa D., 2016. A genetic mosaic screen reveals Ecdysone-responsive genes regulating Drosophila Oogenesis. G3 6: 2629–2642. - PMC - PubMed
    1. Allen A. K., Spradling A. C., 2008. The Sf1-related nuclear hormone receptor Hr39 regulates Drosophila female reproductive tract development and function. Development 135: 311–321. - PubMed
    1. Alpers D. H., 2016. Absorption and blood/cellular transport of folate and cobalamin: pharmacokinetic and physiological considerations. Biochimie 126: 52–56. - PMC - PubMed

Publication types

MeSH terms

LinkOut - more resources