. 2017 Jun;27(6):1050-1062.
doi: 10.1101/gr.214288.116. Epub 2017 Apr 10.

High-confidence coding and noncoding transcriptome maps

Affiliations

High-confidence coding and noncoding transcriptome maps

Bo-Hyun You et al. Genome Res. 2017 Jun.

Abstract

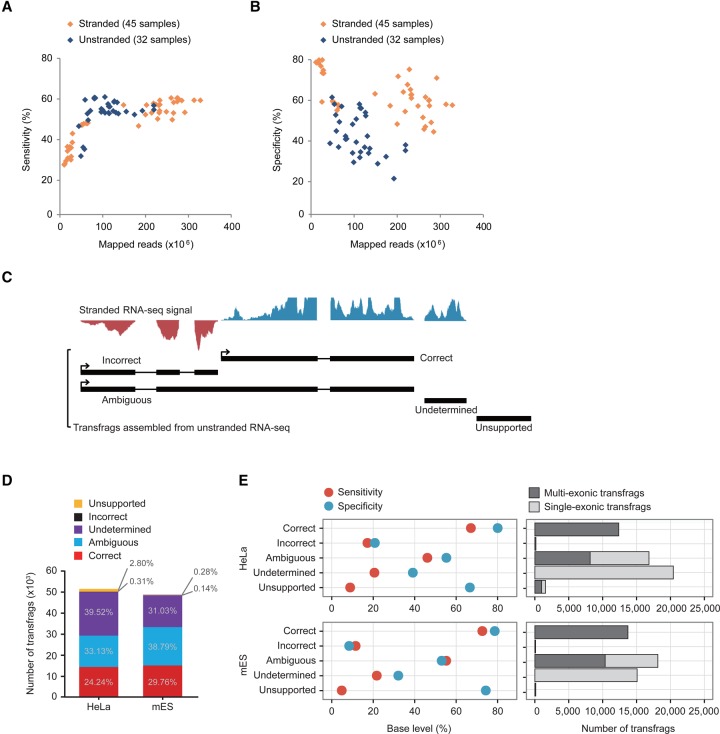
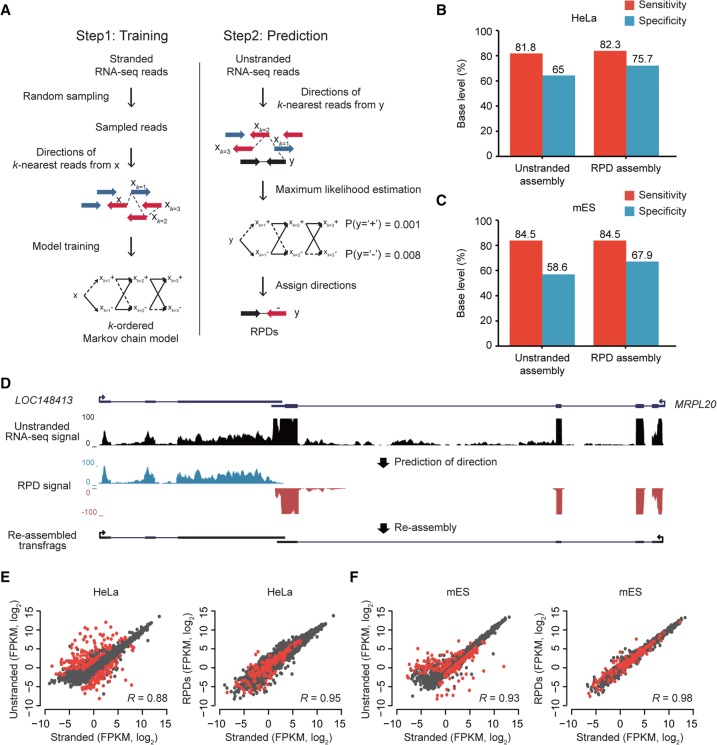
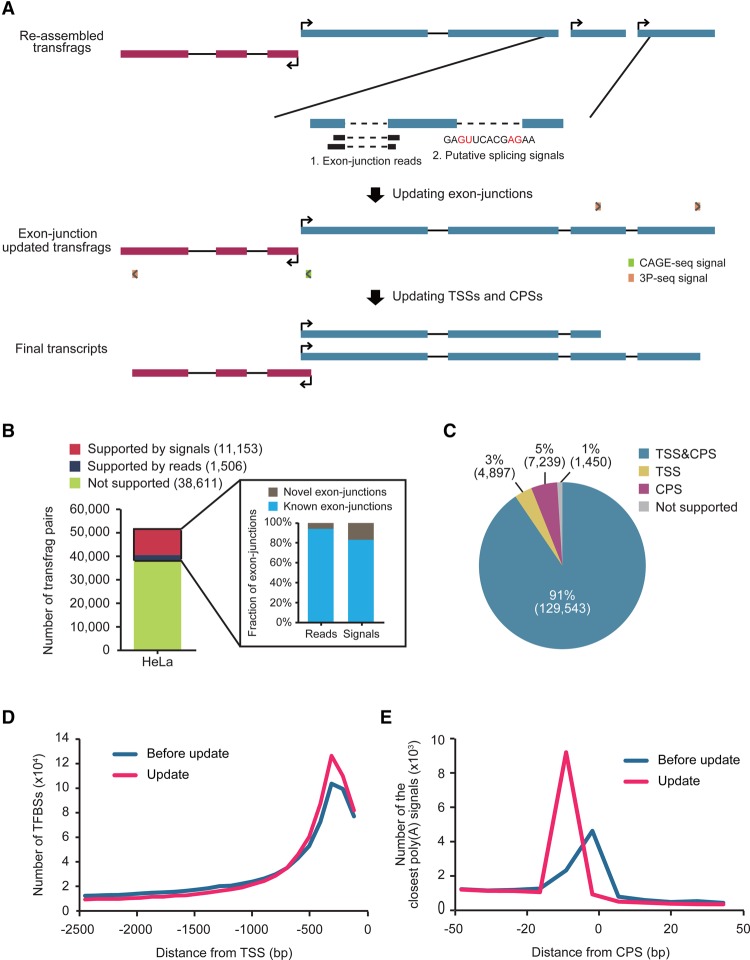
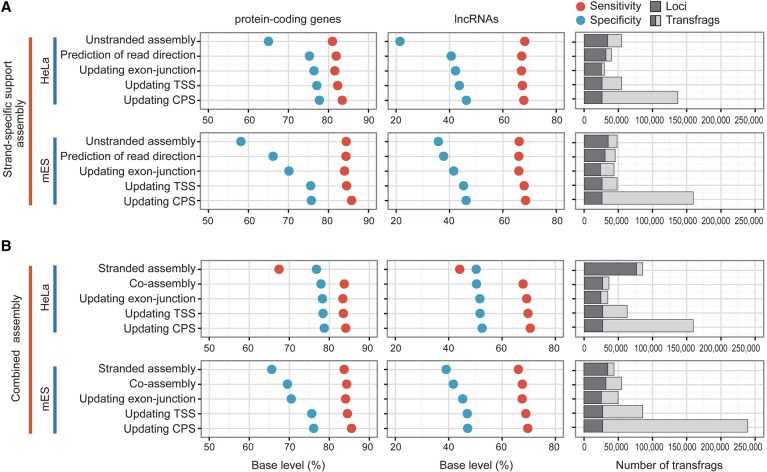
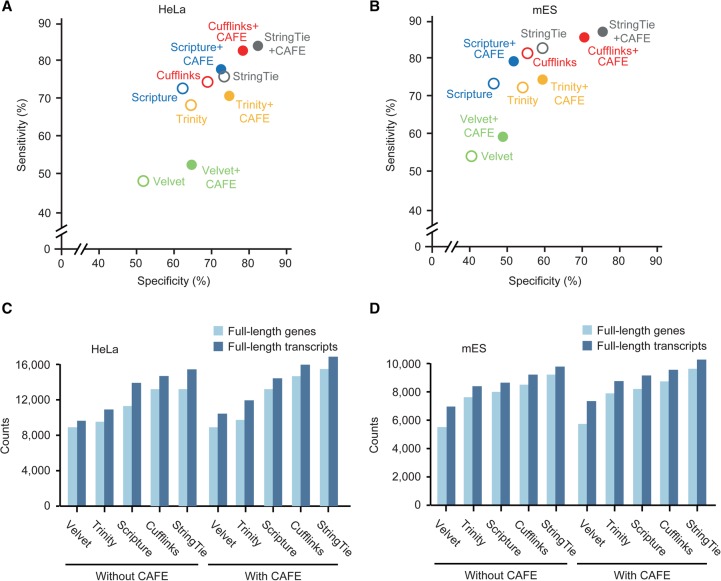
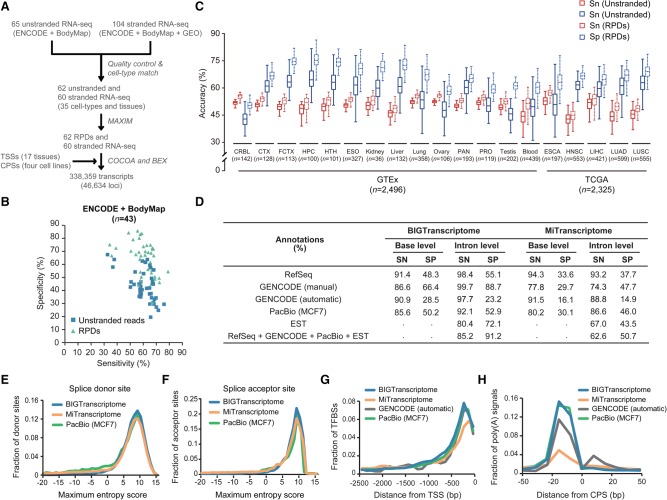
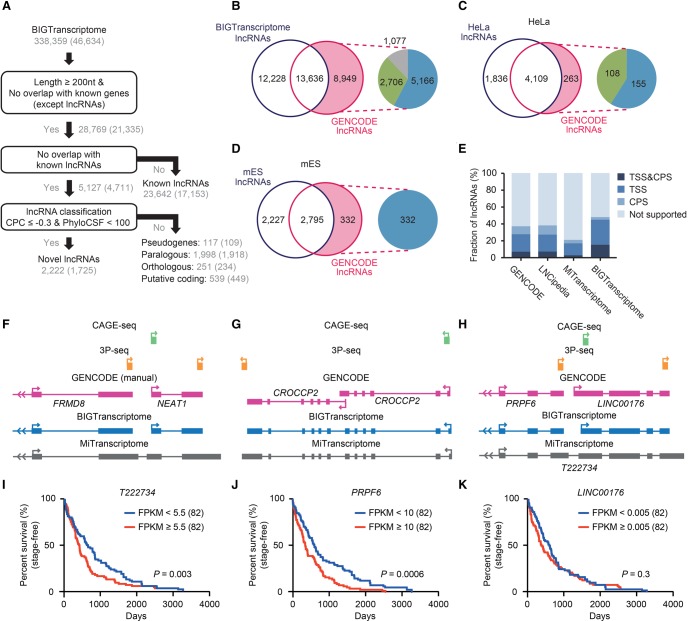
The advent of high-throughput RNA sequencing (RNA-seq) has led to the discovery of unprecedentedly immense transcriptomes encoded by eukaryotic genomes. However, the transcriptome maps are still incomplete partly because they were mostly reconstructed based on RNA-seq reads that lack their orientations (known as unstranded reads) and certain boundary information. Methods to expand the usability of unstranded RNA-seq data by predetermining the orientation of the reads and precisely determining the boundaries of assembled transcripts could significantly benefit the quality of the resulting transcriptome maps. Here, we present a high-performing transcriptome assembly pipeline, called CAFE, that significantly improves the original assemblies, respectively assembled with stranded and/or unstranded RNA-seq data, by orienting unstranded reads using the maximum likelihood estimation and by integrating information about transcription start sites and cleavage and polyadenylation sites. Applying large-scale transcriptomic data comprising 230 billion RNA-seq reads from the ENCODE, Human BodyMap 2.0, The Cancer Genome Atlas, and GTEx projects, CAFE enabled us to predict the directions of about 220 billion unstranded reads, which led to the construction of more accurate transcriptome maps, comparable to the manually curated map, and a comprehensive lncRNA catalog that includes thousands of novel lncRNAs. Our pipeline should not only help to build comprehensive, precise transcriptome maps from complex genomes but also to expand the universe of noncoding genomes.


Figures

Figure 1.
Figure 1.
Error-prone unstranded transcriptome assembly. (A,B) Sensitivities (A) and specificities (B) of stranded (orange diamond) and unstranded (navy diamond) assemblies constructed from ENCODE RNA-seq data are shown over the number of mapped reads. (C) Classification of transfrags assembled from unstranded RNA-seq data. Graphs on the top are signals from stranded RNA-seq data (blue is the signal in the forward direction, and red is the signal in the reverse direction). (D) Shown are the percentages of transfrags belonging to the five groups—correct (red), ambiguous (blue), undetermined (purple), incorrect (black), and unsupported (yellow)—in HeLa and mES cells. (E) The specificity (light blue) and sensitivity (red) of the five groups compared to the reference protein-coding genes in HeLa (left, top) and mES cells (left, bottom). The number of multiexonic (dark gray) and single-exonic (gray) transfrags are indicated in each group (right).
Figure 2.
Figure 2.
Prediction of read directions using MLE. (A) Overview of kMC training and MLE of read direction. (Left) S base reads randomly sampled from stranded RNA-seq reads and their matched step-wise k-nearest reads (xk=1, xk = 2, xk=3,…) were used for training kMC. Blue arrows are reads in the forward (+) direction, and red arrows are reads in the reverse (−) direction. (Right) Prediction of read direction using MLE. Step-wise k-nearest stranded reads (xk=1, xk = 2, xk=3,…) from a query unstranded read (black arrow) were extracted and used to calculate two likelihoods at (+) and (−). A direction with the maximum likelihood is finally assigned to the query read. (B,C) Accuracies of transcriptomes assembled with RPDs (k = 3) and unstranded reads in HeLa (B) and mES cells (C). (D) An example of resulting transfrags reassembled with RPDs. LOC148413 and MRPL20 are convergently overlapped at a locus where unstranded RNA-seq signals (black) are not separated, but blue and red RPD signals are clearly separated in the forward and reverse directions, respectively. (E,F). Comparisons of gene expression values (FPKM, log2) estimated by stranded (x-axis) and unstranded reads (y-axis, left) or RPDs (y-axis, right) in HeLa (E) and mES cells (F). The correlation coefficients were calculated with Pearson's correlation between the x- and y-axis values. The red dots indicate genes with antisense-overlapped genes.
Figure 3.
Figure 3.
Updating exon junctions, TSSs, and CPSs in transfrag models. (A) Shown is a workflow for updating transfrag models, which comprises two steps: (1) updating exon junctions, and (2) updating TSSs and CPSs. (B) The number of neighboring transfrag pairs supported by putative splicing signals (red), by exon-junction reads (navy), and by neither (olive) in HeLa cells. The numbers in parentheses in the key indicate the number of pairs in each group. Among exon junctions supported by either exon-junction reads or putative splicing signals, the fractions of known (cyan) and novel (gray) exon junctions in GENCODE annotations are shown in the inset. (C) The fraction of transfrags updated with both TSS and CPS (blue), with only TSS (yellow), with only CPS (magenta), and with neither TSS or CPS (gray) in HeLa cells. (D) The number of TFBSs upstream of the original 5′ end (blue) and of the 5′ end updated with a TSS (pink) in HeLa cells. (E) The number of transfrags with a close poly(A) signal, AAUAAA, over the relative distances from the original 3′ end (blue) and the 3′ end updated with a CPS (pink) of transfrags in HeLa cells.
Figure 4.
Figure 4.
Step-wise evaluation of transcriptomes reassembled by CAFE. (A) Shown are the accuracies and sizes of strand-specific support transcriptomes (RPD assembly) at each step of CAFE in HeLa (top) and mES cells (bottom). The sensitivity (red solid circle) and specificity (blue) of the assemblies are measured by comparing to GENCODE protein-coding genes (left panel) and lncRNAs (middle panel). The number of assembled transfrags and their loci are indicated at each step (right panel). (B) Shown are the accuracies and sizes of combined transcriptome assemblies of both stranded reads and RPDs. The low sensitivity of the stranded assembly from HeLa cells is presumably because the stranded reads are of the single-end type and are 36 or 72 nt long. Otherwise, as in A.
Figure 5.
Figure 5.
Benchmarking other base assemblers. (A,B) The accuracies of combined transcriptome assemblies (solid circles) reconstructed by CAFE with base assemblers and of the original transcriptome assemblies (open circles) reconstructed by respective base assemblers, such as Cufflinks (red), Scripture (blue), StringTie (gray), Velvet (green), and Trinity (yellow), in HeLa (A) and mES cells (B). The accuracies of the original assemblies were calculated by averaging the accuracies of stranded and unstranded assemblies reconstructed by each base assembler. Velvet and Trinity were used as de novo assemblers, and Scripture, StringTie, and Cufflinks were used as reference-based assemblers. (C,D) The numbers of full-length genes (light blue) and transcripts (blue) in the coassemblies were compared to those in the original assemblies from HeLa (C) and mES cells (D). For the original assemblies, the higher number of full-length genes in the stranded and unstranded original assemblies was chosen.
Figure 6.
Figure 6.
Comprehensive human transcriptome map. (A) A schematic flow for the reconstruction of the BIGTranscriptome map using large-scale RNA-seq samples from human cell lines, ENCODE, and Human BodyMap 2.0 Projects. (B) Accuracies of unstranded (blue) and RPD assemblies (mint) from the ENCODE and Human BodyMap 2.0 projects. (C) Sensitivities (red) and specificities (blue) of unstranded assemblies (solid line box) and RPD assemblies (dotted line box) are shown in box plots. The unstranded RNA-seq data are from GTEx (14 tissues) and TCGA Project (five tumor types). The numbers (n) indicate the sample numbers in each group. (CRBL) Brain cerebellum, (CTX) brain cortex, (FCTX) brain frontal cortex, (HPC) brain hippocampus, (HTH) brain hypothalamus, (ESO) esophagus-mucosa, (PAN) pancreas, (PRO) prostate, (ESCA) esophageal carcinoma, (HNSC) head and neck squamous cell carcinoma, (LIHC) liver hepatocellular carcinoma, (LUAD) lung adenocarcinoma, and (LUSC) lung squamous cell carcinoma. (D) Shown are the accuracies of BIGTranscriptome and MiTranscriptome at the base and intron levels based on four different sets of annotations (RefSeq, manual and automatic GENCODE, PacBio, and EST), and a combined set of annotations. (SN) Sensitivity, (SP) specificity. (E,F) Maximum entropy scores of the putative splice donor sites (E) and of putative splice acceptor sites (F). Blue lines are from BIGTranscriptome, green lines are from PacBio assembly, and orange lines are from MiTranscriptome. (G) The fraction of TFBSs upstream of the 5′ end of BIGTranscriptome transcripts (blue) was compared to those of MiTranscriptome (orange), GENCODE (automatic) (black), and PacBio assembly (green). (H) The fraction of the closest poly(A) signals, AAUAAA, in the region just upstream of the 3′ end of BIGTranscriptome annotations (blue) compared to those of MiTranscriptome (orange), GENCODE (automatic) (black), and PacBio assembly (green).
Figure 7.
Figure 7.
BIGTranscriptome includes known and novel noncoding genes. (A) A schematic flow for annotating novel and known noncoding genes in BIGTranscriptome. (B) The Venn diagrams display the fraction of BIGTranscriptome lncRNAs that are published GENCODE lncRNAs. The inset indicates that GENCODE lncRNAs (8949) not detected in BIGTranscriptome were classified as overlapping with known genes (blue), overlapping with falsely fused genes (green), or truly missed in our catalog (gray). (C,D) Transcriptomes of HeLa (C) and mES cells (D) were compared to GENCODE lncRNAs, expressed over 1 FPKM in the matched cell types. The insets indicate that HeLa- and mES-expressed lncRNAs not detected in our lncRNA set were filtered by either overlap with known genes (blue) or misannotation (green). (E) The fractions of the indicated lncRNA sets with both TSS and CPS, either site, or neither site are shown in bar graphs. (FH) Examples of misannotated gene models in public databases (MiTranscriptome and GENCODE). (F) The gene for a well-studied lncRNA, NEAT1, has been combined with a protein-coding gene, FRMD8, leading to misannotation as a protein-coding gene. (G) CROCCP2 is annotated in GENCODE (automatic) as having two independent isoforms whereas it is annotated as a single transcript in BIGTranscriptome and MiTranscriptome. (H) Gene models of BIGTranscriptome and MiTranscriptome, and CAGE-seq and 3P-seq data, at a locus. A fused single form, T222734, was annotated in MiTranscriptome whereas two independent genes, PRPF6 and LINC00176, were annotated in BIGTranscriptome. (IK) Survival analyses for TCGA liver cancer samples based on the resulting gene models. One hundred sixty-four patient samples including termination events were divided into two groups, the top 50% (red) and bottom 50% (blue), by the median FPKM values of T222834 (I), PRPF6 (J), and LINC00176 (K).

References

    1. Boley N, Stoiber MH, Booth BW, Wan KH, Hoskins RA, Bickel PJ, Celniker SE, Brown JB. 2014. Genome-guided transcript assembly by integrative analysis of RNA sequence data. Nat Biotechnol 32: 341–346. - PMC - PubMed
    1. Brown JB, Boley N, Eisman R, May GE, Stoiber MH, Duff MO, Booth BW, Wen J, Park S, Suzuki AM, et al. 2014. Diversity and dynamics of the Drosophila transcriptome. Nature 512: 393–399. - PMC - PubMed
    1. Cabili MN, Trapnell C, Goff L, Koziol M, Tazon-Vega B, Regev A, Rinn JL. 2011. Integrative annotation of human large intergenic noncoding RNAs reveals global properties and specific subclasses. Genes Dev 25: 1915–1927. - PMC - PubMed
    1. Chang Z, Li G, Liu J, Zhang Y, Ashby C, Liu D, Cramer CL, Huang X. 2015. Bridger: a new framework for de novo transcriptome assembly using RNA-seq data. Genome Biol 16: 30. - PMC - PubMed
    1. Ciriello G, Miller ML, Aksoy BA, Senbabaoglu Y, Schultz N, Sander C. 2013. Emerging landscape of oncogenic signatures across human cancers. Nat Genet 45: 1127–1133. - PMC - PubMed

Publication types

Substances