

Exploiting the Genetic Diversity of Maize Using a Combined Metabolomic, Enzyme Activity Profiling, and Metabolic Modeling Approach to Link Leaf Physiology to Kernel Yield
- PMID: 28396554
- PMCID: PMC5466022
- DOI: 10.1105/tpc.16.00613
Exploiting the Genetic Diversity of Maize Using a Combined Metabolomic, Enzyme Activity Profiling, and Metabolic Modeling Approach to Link Leaf Physiology to Kernel Yield
Erratum in
-
CORRECTION.Plant Cell. 2018 Apr;30(4):946. doi: 10.1105/tpc.18.00273. Epub 2018 Apr 5. Plant Cell. 2018. PMID: 29622566 Free PMC article. No abstract available.
Abstract
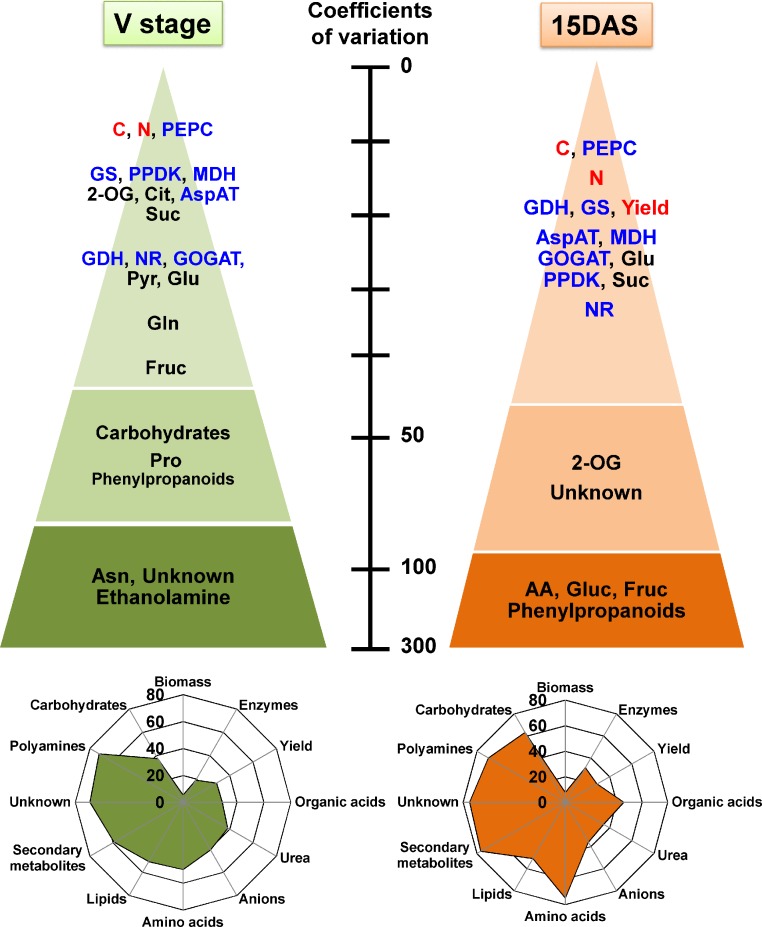
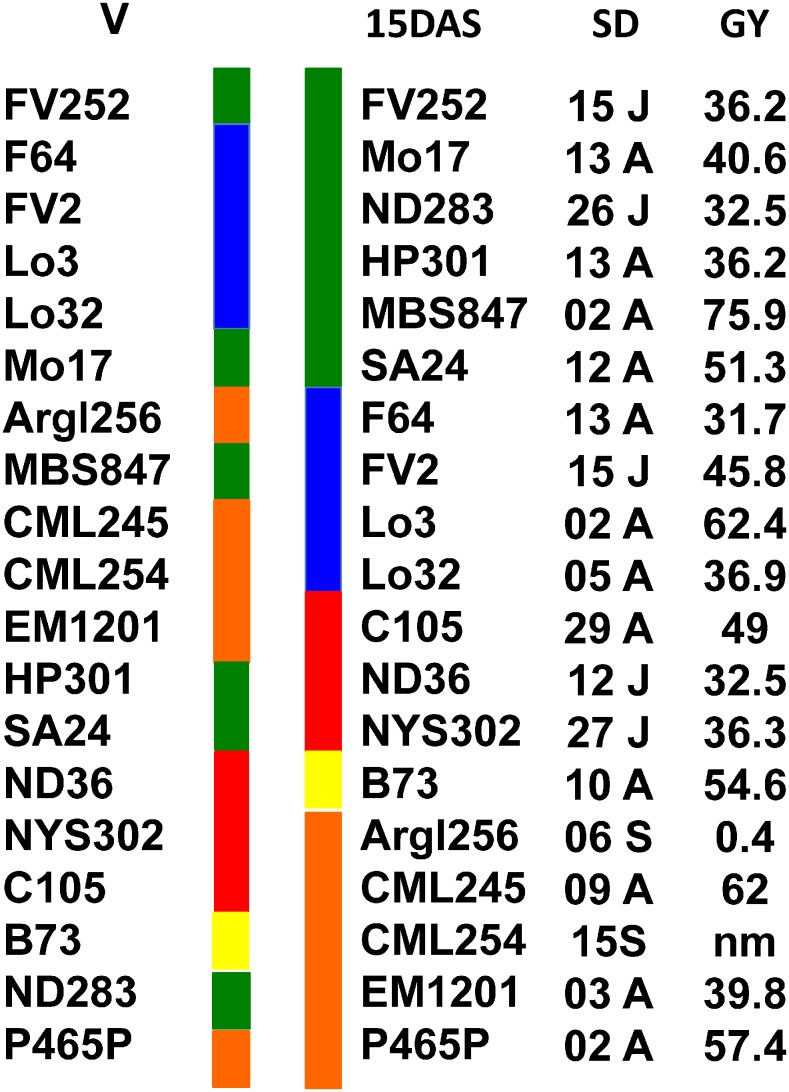
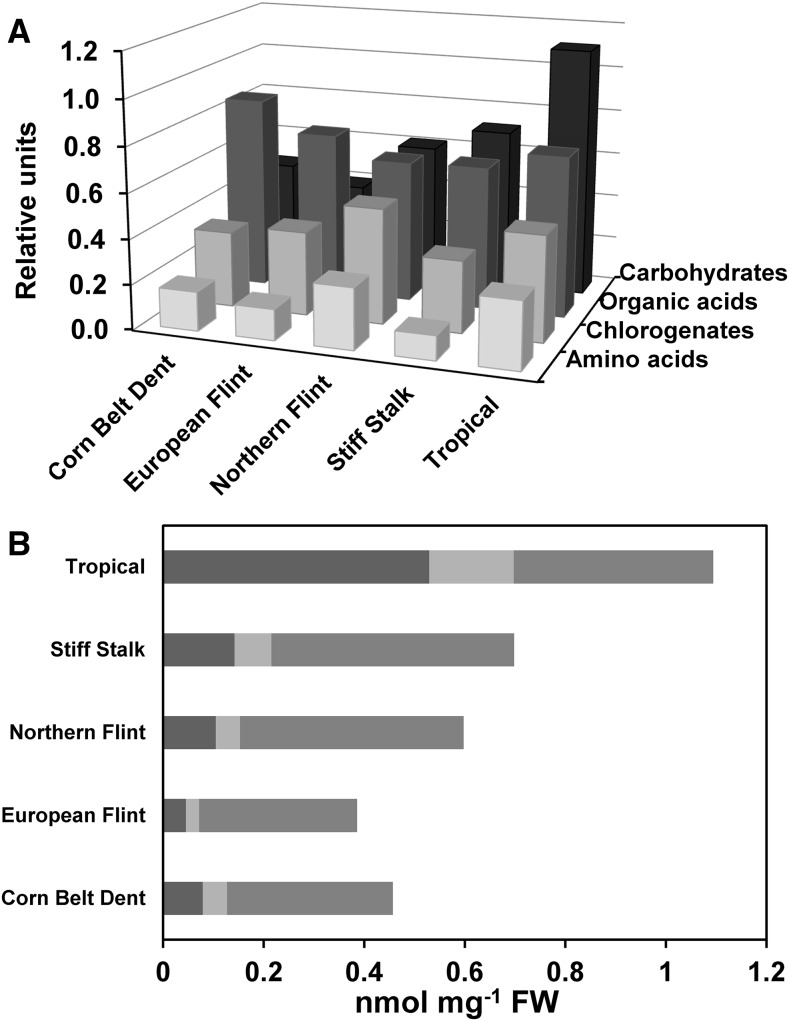
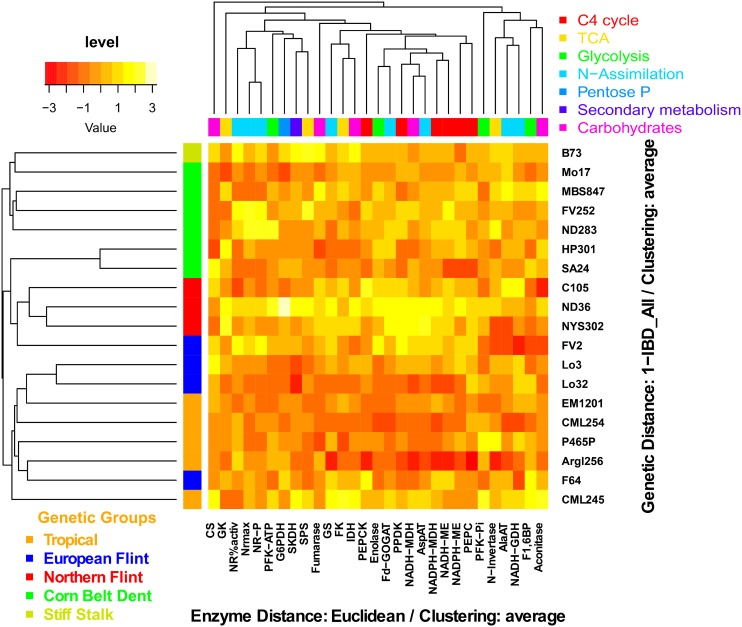
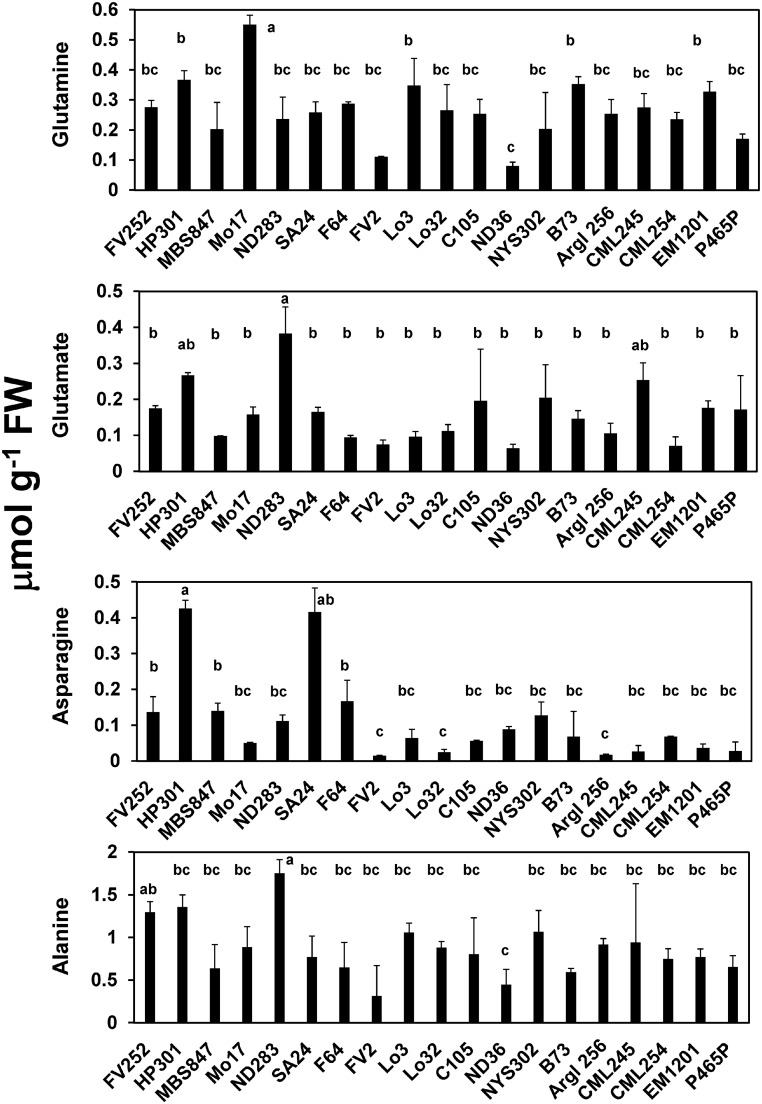
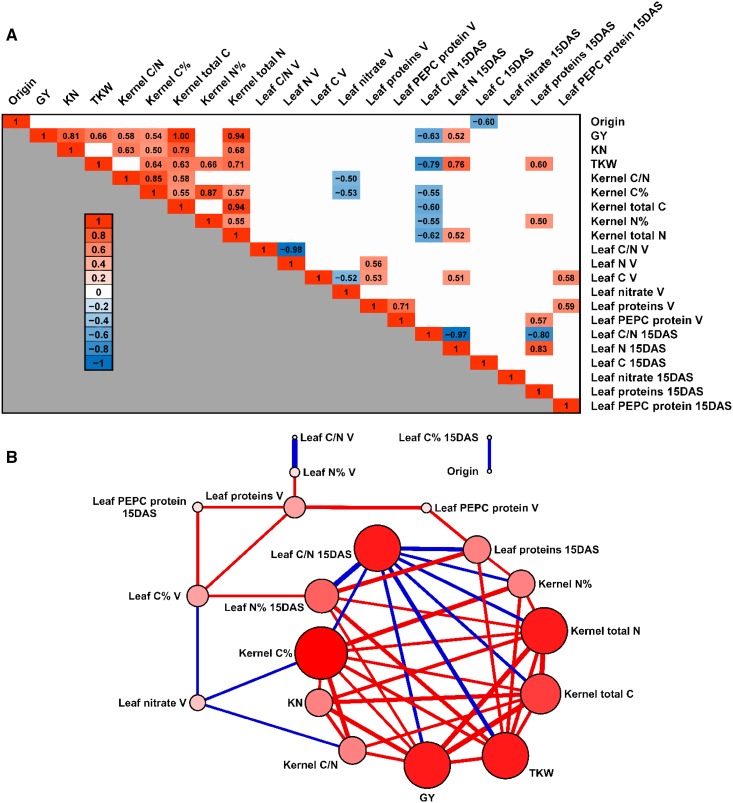
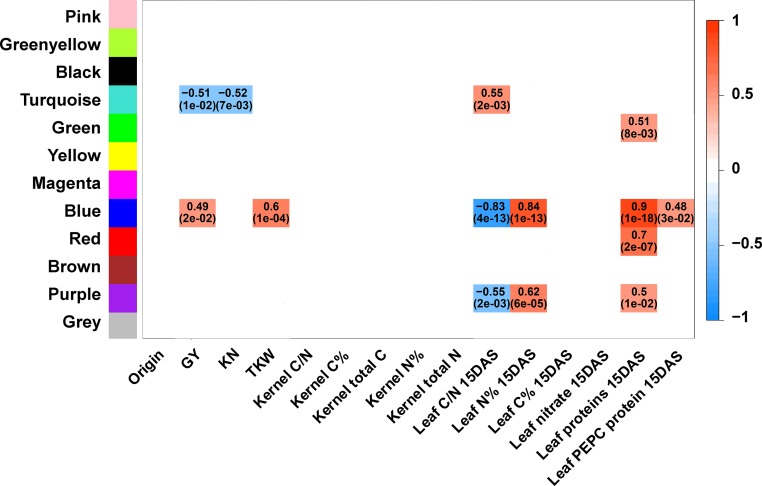
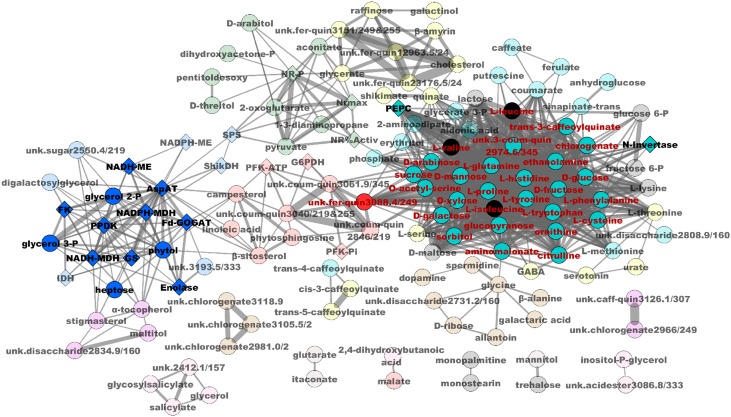
A combined metabolomic, biochemical, fluxomic, and metabolic modeling approach was developed using 19 genetically distant maize (Zea mays) lines from Europe and America. Considerable differences were detected between the lines when leaf metabolic profiles and activities of the main enzymes involved in primary metabolism were compared. During grain filling, the leaf metabolic composition appeared to be a reliable marker, allowing a classification matching the genetic diversity of the lines. During the same period, there was a significant correlation between the genetic distance of the lines and the activities of enzymes involved in carbon metabolism, notably glycolysis. Although large differences were observed in terms of leaf metabolic fluxes, these variations were not tightly linked to the genome structure of the lines. Both correlation studies and metabolic network analyses allowed the description of a maize ideotype with a high grain yield potential. Such an ideotype is characterized by low accumulation of soluble amino acids and carbohydrates in the leaves and high activity of enzymes involved in the C4 photosynthetic pathway and in the biosynthesis of amino acids derived from glutamate. Chlorogenates appear to be important markers that can be used to select for maize lines that produce larger kernels.
© 2017 American Society of Plant Biologists. All rights reserved.
Figures
Similar articles
-
Genetic variability of the phloem sap metabolite content of maize (Zea mays L.) during the kernel-filling period.Plant Sci. 2016 Nov;252:347-357. doi: 10.1016/j.plantsci.2016.08.007. Epub 2016 Aug 27. Plant Sci. 2016. PMID: 27717471
-
An integrated functional approach to dissect systemic responses in maize to arbuscular mycorrhizal symbiosis.Plant Cell Environ. 2015 Aug;38(8):1591-612. doi: 10.1111/pce.12508. Epub 2015 Apr 9. Plant Cell Environ. 2015. PMID: 25630535
-
Transgenic insertion of the cyanobacterial membrane protein ictB increases grain yield in Zea mays through increased photosynthesis and carbohydrate production.PLoS One. 2021 Feb 4;16(2):e0246359. doi: 10.1371/journal.pone.0246359. eCollection 2021. PLoS One. 2021. PMID: 33539477 Free PMC article.
-
Genetic Architecture of Grain Yield-Related Traits in Sorghum and Maize.Int J Mol Sci. 2022 Feb 22;23(5):2405. doi: 10.3390/ijms23052405. Int J Mol Sci. 2022. PMID: 35269548 Free PMC article. Review.
-
Products of leaf primary carbon metabolism modulate the developmental programme determining plant morphology.J Exp Bot. 2006;57(9):1857-62. doi: 10.1093/jxb/erl011. Epub 2006 May 19. J Exp Bot. 2006. PMID: 16714302 Review.
Cited by
-
Development and applications of metabolic models in plant multi-omics research.Front Plant Sci. 2024 Oct 17;15:1361183. doi: 10.3389/fpls.2024.1361183. eCollection 2024. Front Plant Sci. 2024. PMID: 39483677 Free PMC article. Review.
-
Exploring synergies between plant metabolic modelling and machine learning.Comput Struct Biotechnol J. 2022 Apr 16;20:1885-1900. doi: 10.1016/j.csbj.2022.04.016. eCollection 2022. Comput Struct Biotechnol J. 2022. PMID: 35521559 Free PMC article. Review.
-
Identification of metabolic and protein markers representative of the impact of mild nitrogen deficit on agronomic performance of maize hybrids.Metabolomics. 2024 Nov 9;20(6):128. doi: 10.1007/s11306-024-02186-z. Metabolomics. 2024. PMID: 39520587 Free PMC article.
-
Early-stage sugar beet taproot development is characterized by three distinct physiological phases.Plant Direct. 2020 Aug 1;4(7):e00221. doi: 10.1002/pld3.221. eCollection 2020 Jul. Plant Direct. 2020. PMID: 32766510 Free PMC article.
-
Proteomic Analysis Revealed the Antagonistic Effect of Decapitation and Strigolactones on the Tillering Control in Rice.Plants (Basel). 2023 Dec 27;13(1):91. doi: 10.3390/plants13010091. Plants (Basel). 2023. PMID: 38202400 Free PMC article.
References
-
- Allen D.K., Ratcliffe R.G. (2009). Quantification of isotope label. In Plant Metabolic Networks, Schwender J., ed (New York: Springer; ), pp. 105–149.
-
- Amiour N., Imbaud S., Clément G., Agier N., Zivy M., Valot B., Balliau T., Armengaud P., Quilleré I., Cañas R., Tercet-Laforgue T., Hirel B. (2012). The use of metabolomics integrated with transcriptomic and proteomic studies for identifying key steps involved in the control of nitrogen metabolism in crops such as maize. J. Exp. Bot. 63: 5017–5033. - PubMed
-
- Amiour N., Imbaud S., Clément G., Agier N., Zivy M., Valot B., Balliau T., Quilleré I., Tercé-Laforgue T., Dargel-Graffin C., Hirel B. (2014). An integrated “omics” approach to the characterization of maize (Zea mays L.) mutants deficient in the expression of two genes encoding cytosolic glutamine synthetase. BMC Genomics 15: 1005. - PMC - PubMed
-
- Assenov Y., Ramírez F., Schelhorn S.E., Lengauer T., Albrecht M. (2008). Computing topological parameters of biological networks. Bioinformatics 24: 282–284. - PubMed
-
- Astle W., Balding D.J. (2009). Population structure and cryptic relatedness in association genetics studies. Stat. Sci. 24: 451–471.
MeSH terms
Substances
LinkOut - more resources
Full Text Sources
Other Literature Sources
Miscellaneous
