. 2017 Apr 10;6(4):e004078.
doi: 10.1161/JAHA.116.004078.

Tollip Deficiency Alters Atherosclerosis and Steatosis by Disrupting Lipophagy

Affiliations

Tollip Deficiency Alters Atherosclerosis and Steatosis by Disrupting Lipophagy

Keqiang Chen et al. J Am Heart Assoc. .

Abstract

Background: Compromised lipophagy with unknown mechanisms may be critically involved in the intracellular accumulation of lipids, contributing to elevated atherosclerosis and liver steatosis. We hypothesize that toll-interacting protein (Tollip), a key innate immune molecule involved in the fusion of autolysosome, may play a significant role in lipophagy and modulate lipid accumulation during the pathogenesis of atherosclerosis and liver steatosis.

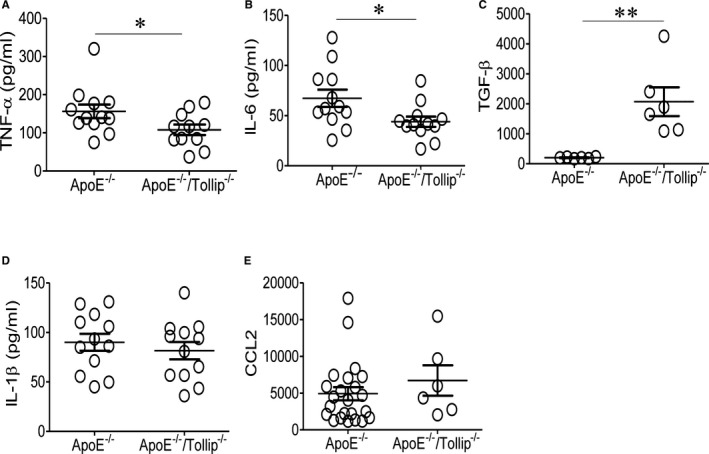
Methods and results: By comparing mice fed with either a Western high-fat diet or a regular chow diet, we observed that both atherosclerosis and liver steatosis were aggravated in apolipoprotein E-deficient (ApoE-/-)/Tollip-/- mice as compared with ApoE-/- mice. Through electron microscopy analyses, we observed compromised fusion of lipid droplets with lysosomes within aortic macrophages as well as liver hepatocytes from ApoE-/-/Tollip-/- mice as compared with ApoE-/- mice. As a molecular indicator for disrupted lysosome fusion, the levels of p62 were significantly elevated in aortic and liver tissues from ApoE-/-/Tollip-/- mice. Molecules involved in facilitating lipophagy completion such as Ras-related protein 7 and gamma-aminobutyric acid receptor-associated protein were reduced in ApoE-/-/Tollip-/- mice as compared with ApoE-/- mice. Intriguingly, ApoE-/-/Tollip-/- mice had reduced circulating levels of inflammatory cytokines such as tumor necrosis factor-α and increased levels of transforming growth factor-β. The reduced inflammation due to Tollip deficiency is consistent with a stable atherosclerotic plaque phenotype with increased levels of plaque collagen and smooth muscle cells in ApoE-/-/Tollip-/- mice.

Conclusions: Tollip deficiency selectively leads to enlarged yet stable atherosclerotic plaques, increased circulating lipids, liver steatosis, and reduced inflammation. Compromised lipophagy and reduced expression of inflammatory mediators due to Tollip deficiency may be the underlying causes. Our data suggest that lipid accumulation and inflammation may be intertwined yet independent processes during the progression of atherosclerosis and steatosis.

Keywords: Tollip; animal model cardiovascular disease; atherosclerosis; hyperlipidemia; inflammation; lipophagy.


Figures

Figure 1
Figure 1
Toll‐interacting protein (Tollip) deficiency promotes the development of stable atherosclerotic plaques. A and B, Apolipoprotein E–deficient (ApoE−/−) and ApoE−/−/Tollip−/− mice (male, 8 weeks old) were fed with a high‐fat diet for an additional 8 weeks. A, Representative hematoxylin and eosin (H&E) staining images within the aortic roots of ApoE−/− and ApoE−/−/Tollip−/− mice. B, Representative Oil‐Red‐O staining images within the aortic roots. C, Quantification of Oil‐Red‐O staining–positive area (mm2) of aortic roots. D, Relative ratios of Oil‐Red‐O–positive areas over total plaque areas. E, Representative smooth muscle cell (SMC) staining of aorta areas from ApoE−/− and ApoE−/−/Tollip−/− mice. F, Representative Masson staining of aorta areas from ApoE−/− and ApoE−/−/Tollip−/− mice. Error bars represent SEM. *P<0.05; **P<0.01; ***P<0.001. Mann–Whitney U test.
Figure 2
Figure 2
Toll‐interacting protein (Tollip) deficiency results in the disruption of lipophagy in aorta. Apolipoprotein E–deficient (ApoE−/−) and ApoE−/−/Tollip−/− mice (male, 8 weeks old) were fed with a high‐fat diet for an additional 8 weeks. A, Representative transmission electron microscopy (TEM) images of aortic sections from Apo−/− mice and ApoE−/−/Tollip−/− mice. B, Representative TEM images that demonstrate the lack of lysosome fusion with lipid droplets within aortic sections from ApoE−/−/Tollip−/− mice. LD indicates lipid droplet; Ly, lysosome.
Figure 3
Figure 3
Toll‐interacting protein (Tollip) deficiency results in compromised lysosome fusion within aorta. Apolipoprotein E–deficient (ApoE−/−) and ApoE−/−/Tollip−/− mice (male, 8 weeks old) were fed with a high‐fat diet for an additional 8 weeks. A, Representative images of p62 staining within plaque macrophages. B, Quantification of p62‐positive macrophages within aorta sections. Error bars represent SEM. *P<0.05. Mann–Whitney U test.
Figure 4
Figure 4
Toll‐interacting protein (Tollip) deficiency promotes liver steatosis. Apolipoprotein E–deficient (ApoE−/−) and ApoE−/−/Tollip−/− mice (male, 8 weeks old) were fed with a high‐fat diet for an additional 8 weeks. A, Representative Oil‐Red‐O staining images of liver sections. B, Representative hematoxylin and eosin staining images of liver sections. C, Representative transmission electron microscopy (TEM) images. D, Western blot analyses of liver lipoprotein lipase (LPL) protein levels. E, Immunohistochemical staining of neutrophils. Error bars represent SEM. ***P<0.001. Mann–Whitney U test.
Figure 5
Figure 5
Toll‐interacting protein (Tollip) deficiency compromises liver lipophagy. Apolipoprotein E–deficient (ApoE−/−) and ApoE−/−/Tollip−/− mice (male, 8 weeks old) were fed with a high‐fat diet for an additional 8 weeks. A, Representative transmission electron microscopy (TEM) images of lipid droplets within liver hepatocytes. B, Representative TEM images of liver hepatocytes. C, The numbers of lysosomes within liver hepatocytes are quantified and shown in the graph. Error bars represent SEM. **P<0.01. Student t test. LD indicates lipid droplet; Ly, lysosome.
Figure 6
Figure 6
Toll‐interacting protein (Tollip) deficiency reduces the expression of key genes involved in lysosome fusion. Apolipoprotein E–deficient (ApoE−/−)and ApoE−/−/Tollip−/− mice (male, 8 weeks old) were fed with a high‐fat diet for additional 8 weeks. A through E, Real‐time reverse transcription polymerase chain reaction data are shown for liver tissue expression of (A) autophagocytosis‐associated protein 3 (ATG3), (B) gamma‐aminobutyric acid receptor‐associated protein (GABARAP), (C) autophagy‐related 9a (ATG9a), (D) autophagy‐related protein 12 (ATG12), and (E) Ras‐related protein 7 (RAB7). Error bars represent SEM. *P<0.05. Student t test.
Figure 7
Figure 7
Toll‐interacting protein (Tollip) deficiency reduces the plasma levels of selected inflammatory cytokines. A through E, Apolipoprotein E–deficient (ApoE−/−) and ApoE−/−/Tollip−/− mice (male, 8 weeks old) were fed with a high‐fat diet for an additional 8 weeks. Plasma levels of (A) tumor necrosis factor‐α (TNF‐α), (B) interleukin (IL)–6, (C) transforming growth factor‐β (TGF‐β), (D) IL‐1β, and (E) C‐C motif chemokine ligand 2 (CCL2) were measured. Error bars represent SEM. *P<0.05; **P<0.01. Mann–Whitney U test.
Figure 8
Figure 8
Toll‐interacting protein (Tollip) deficiency reduces the expression of inflammatory mediators from monocytes and neutrophils. Apolipoprotein E–deficient (ApoE−/−) and ApoE−/−/Tollip−/− mice (male, 8 weeks old) were fed with a high‐fat diet for an additional 8 weeks. Flow cytometry analyses of intracellular tumor necrosis factor‐α (TNF‐α) and interleukin (IL)–12 in splenic neutrophils (A) and monocytes (B). Flow analyses of C‐X‐C motif chemokine receptor 2 (CXCR2) levels on splenic (C) and bone marrow (D) neutrophils. Error bars represent SEM. N=4, *P<0.05, **P<0.01. Student t test.

References

    1. Braunwald E. Shattuck lecture–cardiovascular medicine at the turn of the millennium: triumphs, concerns, and opportunities. N Engl J Med. 1997;337:1360–1369. - PubMed
    1. Liu K, Czaja MJ. Regulation of lipid stores and metabolism by lipophagy. Cell Death Differ. 2013;20:3–11. - PMC - PubMed
    1. Martinez‐Lopez N, Singh R. Autophagy and lipid droplets in the liver. Annu Rev Nutr. 2015;35:215–237. - PMC - PubMed
    1. Ouimet M, Franklin V, Mak E, Liao X, Tabas I, Marcel YL. Autophagy regulates cholesterol efflux from macrophage foam cells via lysosomal acid lipase. Cell Metab. 2011;13:655–667. - PMC - PubMed
    1. Burns K, Clatworthy J, Martin L, Martinon F, Plumpton C, Maschera B, Lewis A, Ray K, Tschopp J, Volpe F. Tollip, a new component of the IL‐1RI pathway, links IRAK to the IL‐1 receptor. Nat Cell Biol. 2000;2:346–351. - PubMed

MeSH terms

Substances