. 2017 Mar 16;11(2):024105.
doi: 10.1063/1.4978468. eCollection 2017 Mar.

Human iPSC-derived myocardium-on-chip with capillary-like flow for personalized medicine

Affiliations

Human iPSC-derived myocardium-on-chip with capillary-like flow for personalized medicine

Bradley W Ellis et al. Biomicrofluidics. .

Abstract

The heart wall tissue, or the myocardium, is one of the main targets in cardiovascular disease prevention and treatment. Animal models have not been sufficient in mimicking the human myocardium as evident by the very low clinical translation rates of cardiovascular drugs. Additionally, current in vitro models of the human myocardium possess several shortcomings such as lack of physiologically relevant co-culture of myocardial cells, lack of a 3D biomimetic environment, and the use of non-human cells. In this study, we address these shortcomings through the design and manufacture of a myocardium-on-chip (MOC) using 3D cell-laden hydrogel constructs and human induced pluripotent stem cell (hiPSC) derived myocardial cells. The MOC utilizes 3D spatially controlled co-culture of hiPSC derived cardiomyocytes (iCMs) and hiPSC derived endothelial cells (iECs) integrated among iCMs as well as in capillary-like side channels, to better mimic the microvasculature seen in native myocardium. We first fully characterized iCMs using immunostaining, genetic, and electrochemical analysis and iECs through immunostaining and alignment analysis to ensure their functionality, and then seeded these cells sequentially into the MOC device. We showed that iECs could be cultured within the microfluidic device without losing their phenotypic lineage commitment, and align with the flow upon physiological level shear stresses. We were able to incorporate iCMs within the device in a spatially controlled manner with the help of photocrosslinkable polymers. The iCMs were shown to be viable and functional within the device up to 7 days, and were integrated with the iECs. The iCMs and iECs in this study were derived from the same hiPSC cell line, essentially mimicking the myocardium of an individual human patient. Such devices are essential for personalized medicine studies where the individual drug response of patients with different genetic backgrounds can be tested in a physiologically relevant manner.


Figures

FIG. 1.
FIG. 1.
Experimental plan and schematic of microfluidic Myocardium-on-a-Chip. (a) Adult cells are treated with reprogramming factors to dedifferentiate into hiPSCs. hiPSCs were then redifferentiated into iCMs and iECs and seeded into the MOC (160 μm high) with iCMs being encapsulated in UV-activated GelMA. (b) Gross Image of MOC with food coloring perfused through the side channels, with U.S. one cent piece for scale. (c) iCMs were encapsulated in UV-activated GelMA and seeded into the cardiac muscle channel (2200 μm wide), iECs were then seeded into the microvasculature channels (1100 μm wide) with posts (R = 200 μm) separating the three channels.
FIG. 2.
FIG. 2.
Biochemical and Physiological Characterization of iCMs. (a) Differentiation and purification plan of iCMs. After differentiation was complete by day 21, iCMs were reseeded in order to purify iCMs and lower hiPSCs present in culture. (b) Brightfield images of hiPSCs as the cells undergo differentiation, throughout differentiation, the hiPSCs condense to become more tissue like. Upon reseeding, iCMs appeared as a synchronously beating monolayer (scale = 200 μm). (c) As the differentiation of hiPSCs to iCMs continued, beating rate of iCMs increased, upon reseeding on day 21 beating ceased, but recommenced by day 28. (d) Fluorescent imaging of reseeded iCMs stained for Troponin-I (top, scale = 50 μm) (inset, scale = 10 μm) and Connexin43 (bottom, scale = 10 μm) on day 35. (e) PCR graph of beating iCMs, non-beating iCMs, and hiPSCs. Completely differentiated iCMs showed a significant upregulation of MHC6, NKX2, and TNNT2 (all p < 0.05), with NKX2 levels similar to non-beating iCMs, but higher than hiPSCs (p < 0.05).
FIG. 3.
FIG. 3.
Electrochemical characterization of iCMs. (a) Intensity of calcium flux timelapse images at 2500 ms intervals. As contraction occurred, intensity increased. (b) Fluorescent image of baseline calcium flux intensity t = 0 ms and at maximum calcium flux t = 500 ms (scale = 100 μm). (c) Time to peak intensity, 50% decay from peak, and 90% decay from peak were calculated for contracting iCMs. (d) Brightfield image of iCMs reseeded onto the MEA for electrophysiological characterization (scale = 200 μm). (e) Reseeded iCMs displayed a consistent, synchronized beating frequency of 0.6 Hz. (f) Spontaneous electric activity of reseeded iCMs, iCMs displayed a membrane surface voltage difference of approximately 80 μV. (g) Stimulation response of reseeded iCMs for ± 1000 mV stimulation at 0.5 Hz, iCMs were able to be paced at this stimulation frequency.
FIG. 4.
FIG. 4.
iEC biochemical and physiological characterization. (a) Differentiation and purification plan of iECs, after differentiation was complete by the end of day 6, cells were purified using magnetic assisted cell sorting. (b) Brightfield image of iECs at initial time of flow (scale = 200 μm). (c) Brightfield image of iECs 24 h after wall shear stress of 9.7 dyne/cm2 (scale = 200 μm). (d) Brightfield image of aligned iECs 72 h after device perfusion began, with 24 h at a wall shear stress of 9.7 dyne/cm2 and 48 h at 17.9 dyne/cm2 (scale = 200 μm). (e) Histogram showing iEC alignment of representative images (b)–(d) at various time points of perfusion. (f) Graph showing the alignment of iECs and HUVECs before, during, and after perfusion. iECs showed a significant (p < 0.05) increase in alignment when exposed to physiological wall shear stress for 72 h (n = 3 for all). (g) Fluorescent image of aligned iECs stained for endothelial marker VE-Cad 72 h after perfusion (scale = 50 μm). (h) Fluorescent image of aligned iECs stained for endothelial marker CD31 (scale = 50 μm). (i) Merged fluorescent image of aligned iECs stained for CD31 and VE-Cad 72 h after perfusion (scale = 50 μm).
FIG. 5.
FIG. 5.
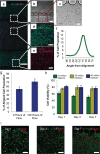
iCMs and iECs seeded into the MOC retain markers and viability in culture. (a) A seeded MOC with encapsulated iCMs (magenta) in the cardiac muscle channel and iECs (cyan) seeded into the microvasculature channels with iECs additionally seeded into the cardiac muscle channel (scale = 500 μm). (b) Brightfield image of MOC 7 days after culture showing aligned iECs (scale = 250 μm). (c) Brightfield image of MOC's cardiac muscle channel showing iCMs (dense circular cells) and tube formation of iECs (spread out cells) on top of and in the cardiac muscle of the MOC (scale = 100 μm). (d) Fluorescent image of MOC's cardiac muscle channel showing Troponin-I expression of encapsulated iCMs (scale = 100 μm). (e) Fluorescent image of MOC's microvasculature channel showing Ve-Cadherin expression of aligned iECs (scale = 100 μm). (f) Histogram showing iEC angle from the alignment of representative image (b) in the MOC after 7 days in culture. (g) Graph showing a significant increase (p < 0.05) in alignment of iECs at day 2 (0 h of perfusion) and day 7 (120 h of perfusion) of culture (n = 3 for all). (h) Viability of iCMs seeded in the myocardium channel over the culture period at varying encapsulation densities (n = 3 for all). (i) Representative z-stack images of iCMs (encapsulation of 40 × 106 iCMs/ml) stained for the live/dead assay at days 1, 3, and 7 days of culture (scale = 200 μm).

References

    1. Laflamme M. A. and Murry C. E., “ Regenerating the heart,” Nat. Biotechnol. 23(7), 845–856 (2005).10.1038/nbt1117 - DOI - PubMed
    1. Mozaffarian D., Benjamin E. J., Go A. S., Arnett D. K., Blaha M. J., Cushman M., and Huffman M. D., “ Executive summary,” Circulation 131(4), 434–441 (2015).10.1161/CIR.0000000000000157 - DOI
    1. Kathiresan S. and Srivastava D., “ Genetics of human cardiovascular disease,” Cell 148(6), 1242–1257 (2012).10.1016/j.cell.2012.03.001 - DOI - PMC - PubMed
    1. Lu B., Yu H., Zwartbol M., Ruifrok W. P., van Gilst W. H., de Boer R. A., and Silljé H. H., “ Identification of hypertrophy and heart failure associated genes by combining in vitro and in vivo models,” Physiol. Genomics 44(8), 443–454 (2012).10.1152/physiolgenomics.00148.2011 - DOI - PubMed
    1. Sarkar K., Cai Z., Gupta R., Parajuli N., Fox-Talbot K., Darshan M. S., and Semenza G. L., “ Hypoxia-inducible factor 1 transcriptional activity in endothelial cells is required for acute phase cardioprotection induced by ischemic preconditioning,” Proc. Natl. Acad. Sci. U.S.A. 109(26), 10504–10509 (2012).10.1073/pnas.1208314109 - DOI - PMC - PubMed

LinkOut - more resources