. 2017 Jan 9;7(1):e1271498.
doi: 10.1080/21592799.2016.1271498. eCollection 2017.

Rab11-FIP1 phosphorylation by MARK2 regulates polarity in MDCK cells

Affiliations

Rab11-FIP1 phosphorylation by MARK2 regulates polarity in MDCK cells

Rebecca McRae et al. Cell Logist. .

Abstract

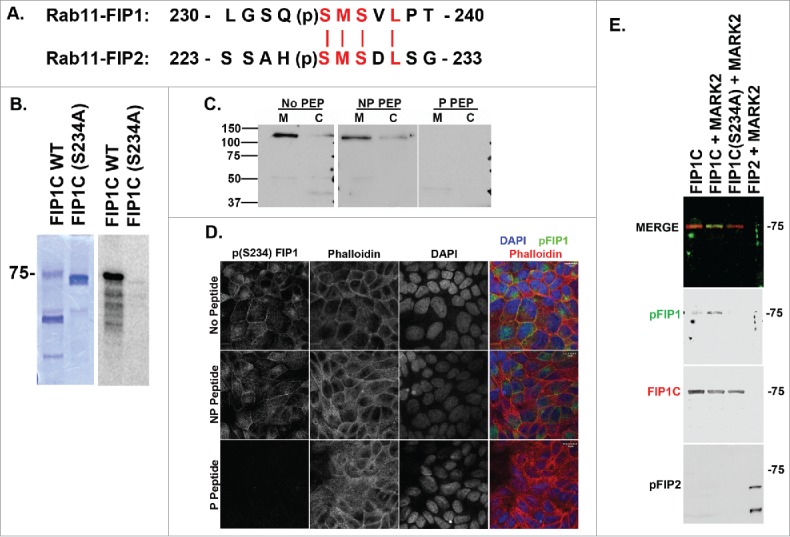
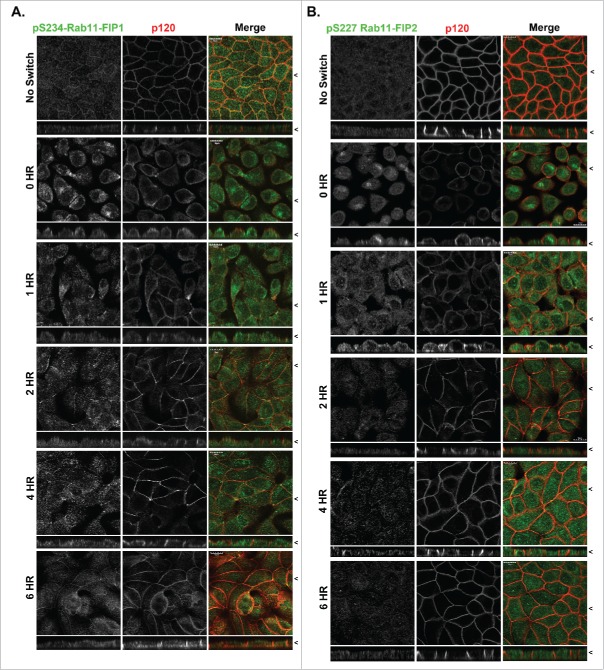
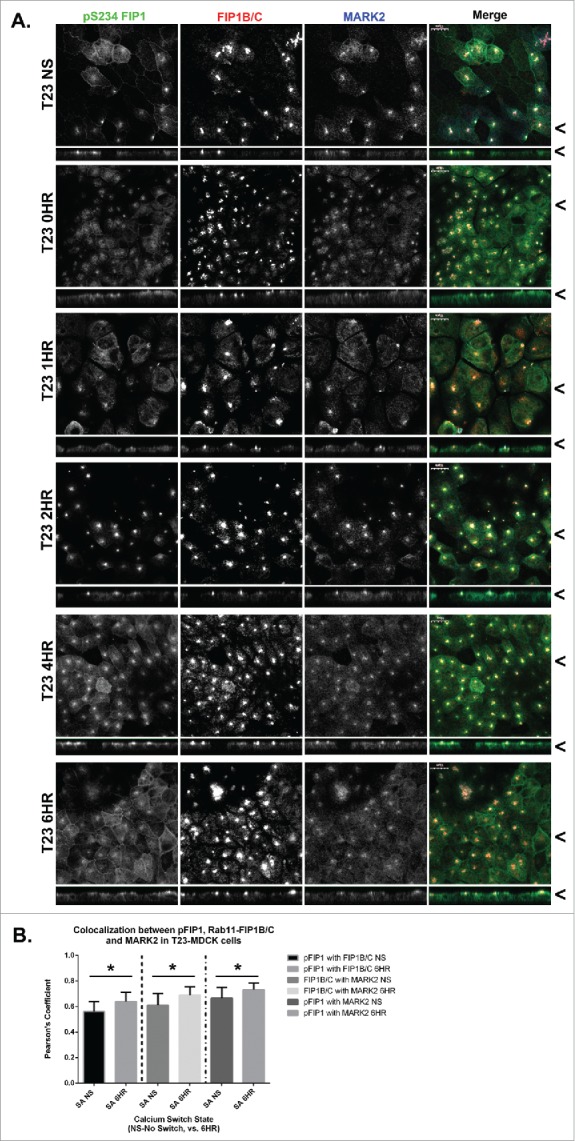
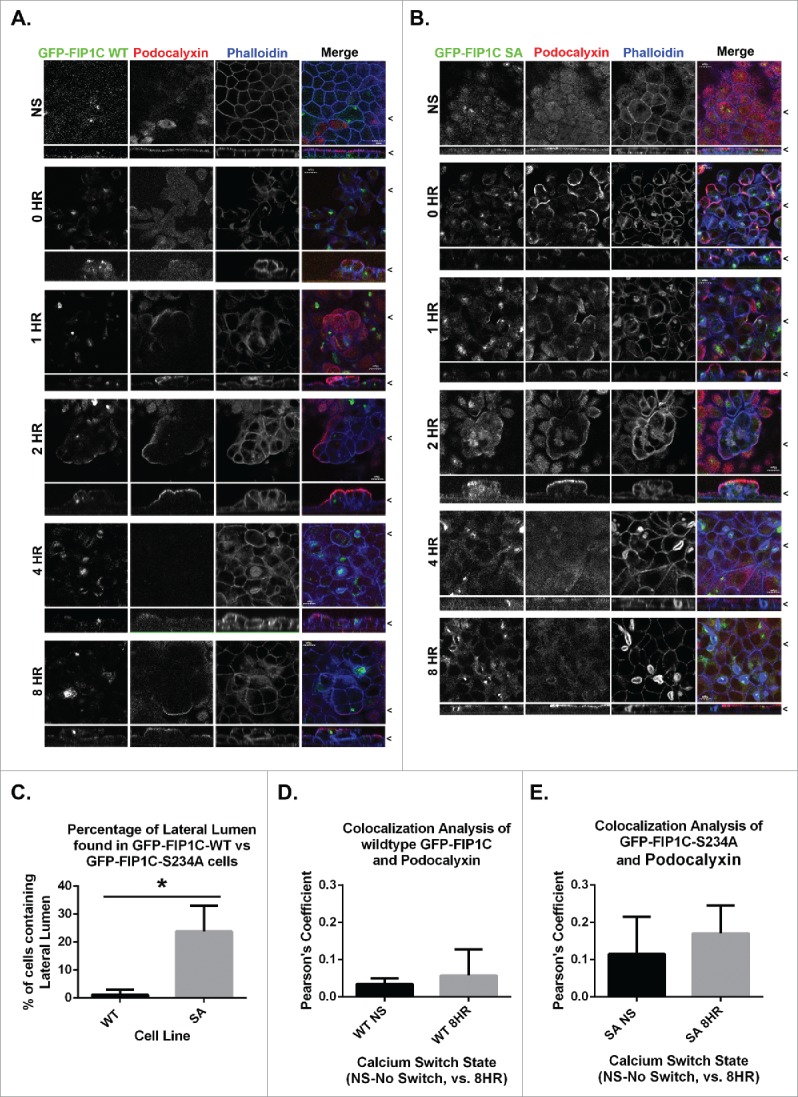
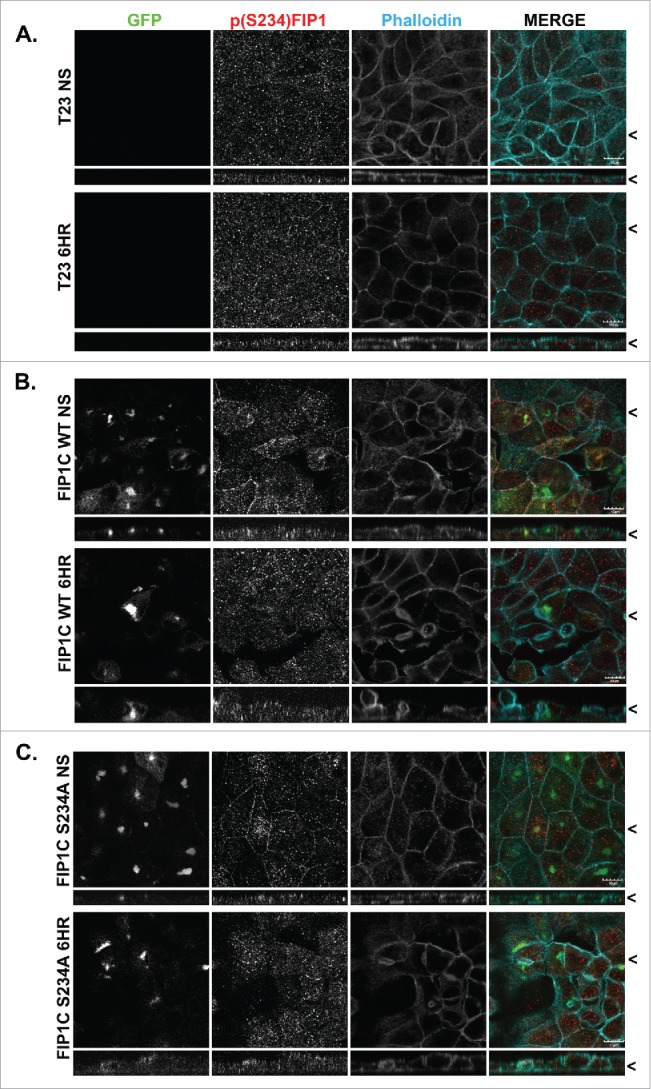
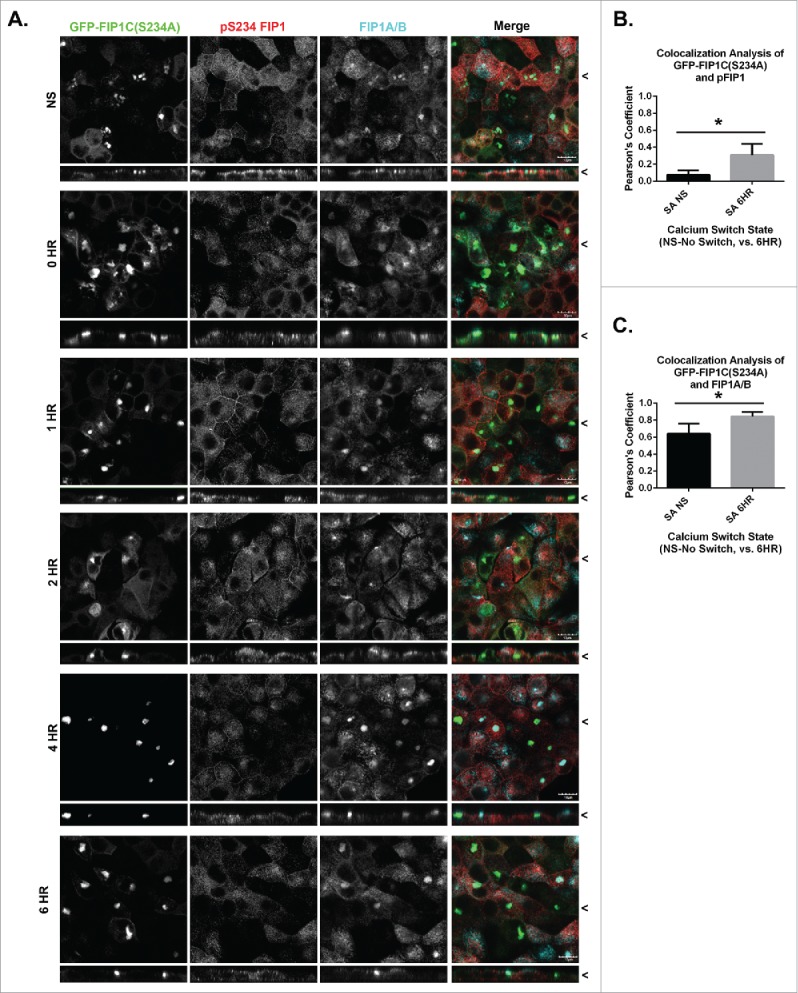
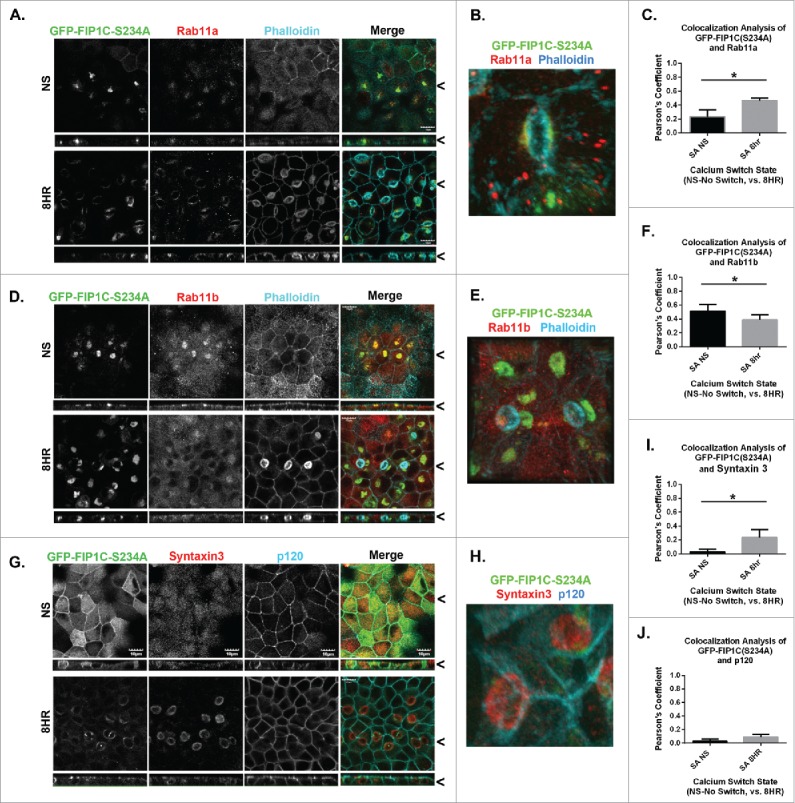
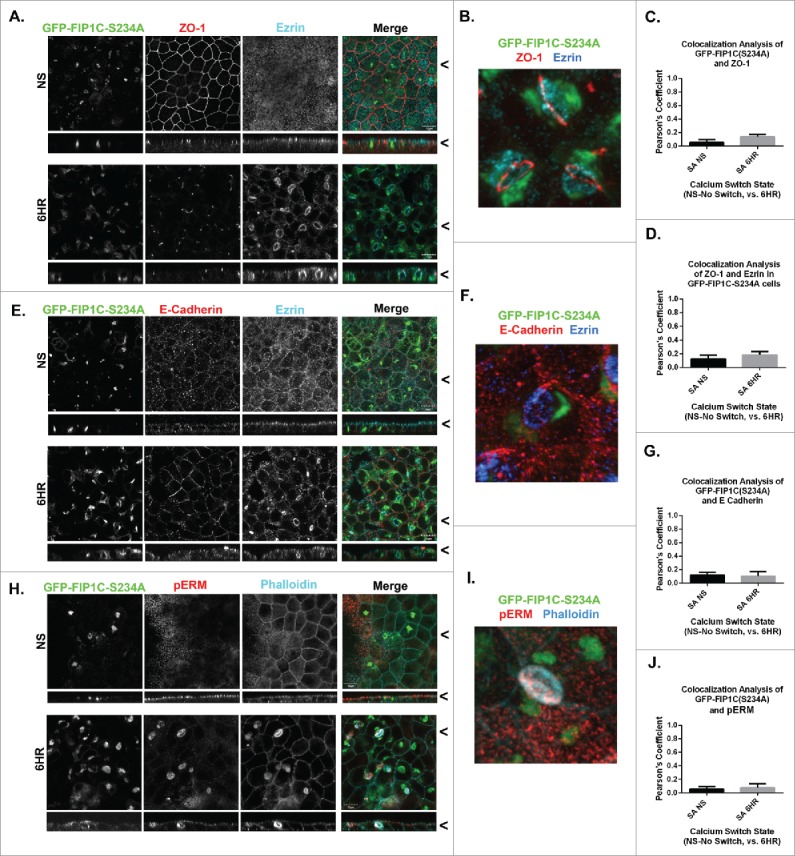
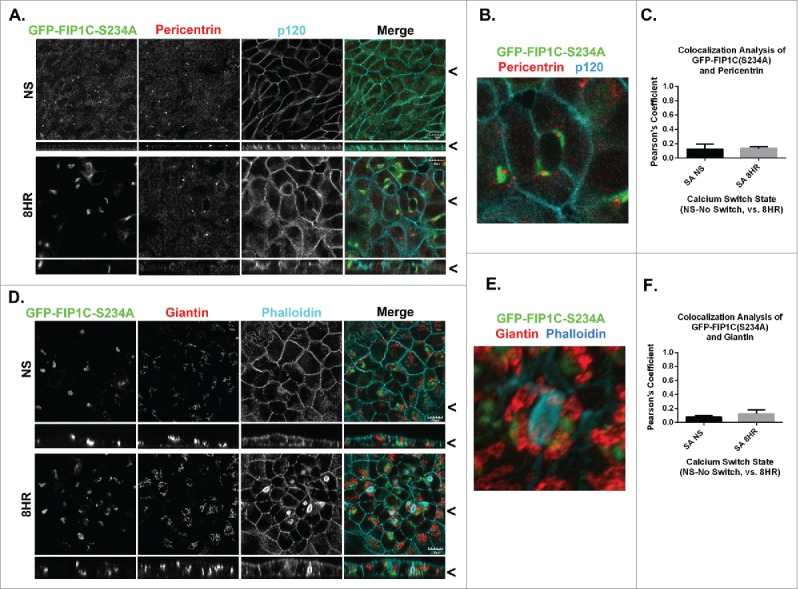
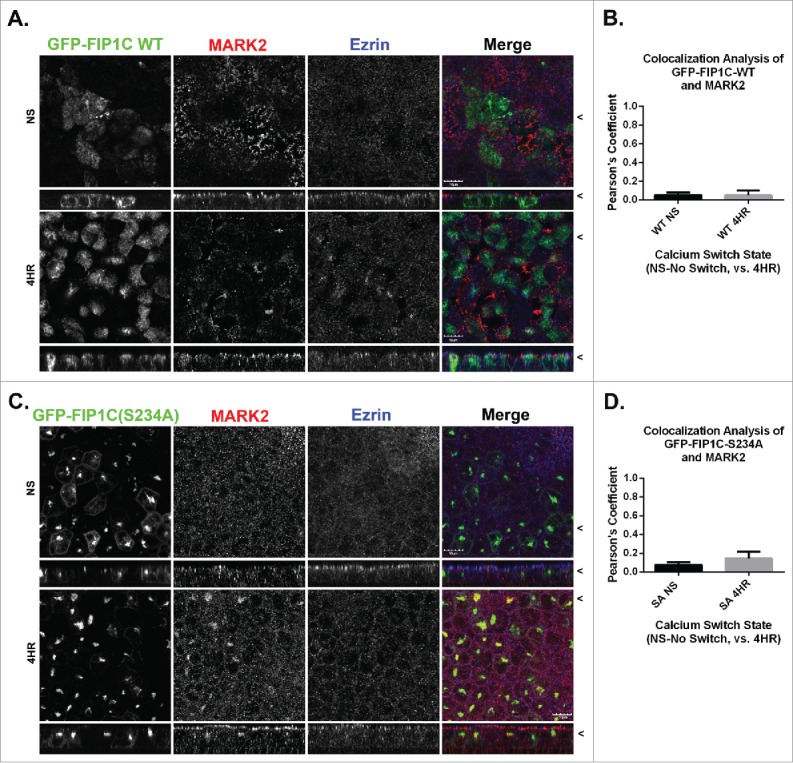
MARK2/Par1b/EMK1, a serine/threonine kinase, is required for correct apical/basolateral membrane polarization in epithelial cells. However, the specific substrates mediating MARK2 action are less well understood. We have now found that MARK2 phosphorylates Rab11-FIP1B/C at serine 234 in a consensus site similar to that previously identified in Rab11-FIP2. In MDCK cells undergoing repolarization after a calcium switch, antibodies specific for pS234-Rab11-FIP1 or pS227-Rab11-FIP2 demonstrate that the spatial and temporal activation of Rab11-FIP1 phosphorylation is distinct from that for Rab11-FIP2. Phosphorylation of Rab11-FIP1 persists through calcium switch and remains high after polarity has been reestablished whereas FIP2 phosphorylation is highest early in reestablishment of polarity but significantly reduced once polarity has been re-established. MARK2 colocalized with FIP1B/C/D and p(S234)-FIP1 in vivo. Overexpression of GFP-Rab11-FIP1C wildtype or non-phosphorylatable GFP-Rab11-FIP1C(S234A) induced two significant phenotypes following calcium switch. Overexpression of FIP1C wildtype and FIP1C(S234A) caused a psuedo-stratification of cells in early time points following calcium switch. At later time points most prominently observed in cells expressing FIP1C(S234A) a significant lateral lumen phenotype was observed, where F-actin-rich lateral lumens appeared demarcated by a ring of ZO1 and also containing ezrin, syntaxin 3 and podocalyxin. In contrast, p120 and E-Cadherin were excluded from the new apical surface at the lateral lumens and now localized to the new lateral surface oriented toward the media. GFP-FIP1C(S234A) localized to membranes deep to the lateral lumens, and immunostaining demonstrated the reorientation of the centrosome and the Golgi apparatus toward the lateral lumen. These results suggest that both Rab11-FIP1B/C and Rab11-FIP2 serve as critical substrates mediating aspects of MARK2 regulation of epithelial polarity.

Keywords: MARK2; Rab11-FIP1; epithelial cell polarity; lateral lumen.


Figures

Figure 1.
Figure 1.
Rab11-FIP1C is phosphorylated by MARK2. A. Protein alignment of Rab11-FIP1 and Rab11-FIP2 around the predicted MARK2 phosphorylation sequence. FIP1 is predicted to be phosphorylated on S234 and FIP2 is phosphorylated on S227. B. In vitro phosphorylation of FIP1C. Coomassie blue staining of recombinant Rab11-FIP1C and Rab11-FIP1C(S234A) preparations are shown at right with autoradiograph of [32P]-incorporation at left. Purified FIP1C, but not FIP1C(S234A), was phosphorylated by MARK2. C. A phospho-specific antibody against pS234-FIP1 identified a 130kDa band on western blot in MDCK (M) and Caco (C) cells consistent with the molecular size of FIP1B. Labeling was blocked by phospho-peptide (P PEP), but not non-phosphorylated peptide (NP PEP). Molecular size markers (kDa) are indicated at the left. D. Immunostaining for pS234-FIP1C showed staining at junctions and in the subapical regions of MDCK cells. Staining for pS234-FIP1 was abolished by incubations with phosphorylated peptide, but not with the non-phosphorylated peptide. E. In vitro phosphorylation assay using purified recombinant FIP1C, FIP1C(S234A) and Rab11-FIP2. Western blot analysis utilizing the pS234-FIP1 antibody detected Rab11-FIP1C phosphorylated by MARK2 (blots were co-stained with antibody against FIP1C to demonstrate equal loading), but no phosphorylation was detected in S234A FIP1C mutant or in MARK2 phosphorylated Rab11-FIP2. In a duplicate blot, the pS227A-Rab11-FIP2 antibody detected MARK2 phosphorylated Rab11-FIP2, but not FIP1 phosphorylated by MARK2. Note that two bands are observed for Rab11-FIP2 because of breakdown of the recombinant FIP2 to a smaller fragment that also is phosphorylated. Position of the 75 kDa molecular weight marker is indicated at the right.
Figure 2.
Figure 2.
Localization of p(S234)-Rab11-FIP1 is distinct from p(S227)-Rab11-FIP2 during re-polarization of MDCK cells. T23 MDCK cells labeled with either p(S234)-Rab11-FIP1 antibodies (A) or p(S227)-Rab11-FIP2 antibodies (B) along with antibodies against p120 in non-switched cells (NS) and then 0, 1, 2, 4, or 6 hours after re-addition of calcium. Cells were fixed with methanol. Merged dual color images are shown at the right. Localization of p(S234)-Rab11-FIP1 was punctate/vesicular as well as junctional with the greatest density in the apical region and was maintained throughout the calcium switch. Phosphorylation of p(S227)-Rab11-FIP2 was upregulated in calcium switch, however, p(S227)-Rab11-FIP2 labeling peaked at 2 hours after calcium switch and then declined. X/Z images are shown below X/Y images, < indicates where images were taken for X/Y and X/Z planes. All scale bars = 10 µm.
Figure 3.
Figure 3.
MARK2 colocalizes with Rab11-FIP1B/C and p(S234)-Rab11-FIP1 throughout calcium switch. A. Non-switched T23 MDCK cells (NS) and cells at 0, 1, 2, 4, and 6 hours after calcium re-addition were fixed with 4% paraformaldehyde and immunostained using the p(S234)-FIP1 antibody, a Rab11-FIP1B/C antibody, and a MARK2 antibody. The MARK2 colocalized with both the p(S234)-FIP1 and FIP1B/C staining. Colocalization was observed between p(S234)-FIP1 and MARK2 at the lateral membrane 4 or more hours after calcium switch. X/Z images are shown below X/Y images, < indicates where images were taken for X/Y and X/Z planes. All scale bars = 10 µm. B. Colocalization analysis was conducted comparing p(S234)-FIP1 (pFIP1) with Rab11-FIP1B/C, pFIP1 with MARK2, and MARK2 with Rab11-FIP1B/C. All proteins colocalized together, and in each case, colocalization increased significantly through calcium switch (pFIP1 and FIP1B/C p = 0.024, FIP1B/C and MARK2 p = 0.026, pFIP1 and MARK2 p = 0.031, graphs plot mean Pearson's Coefficient, error bars represent standard deviation).
Figure 4.
Figure 4.
Overexpression of GFP-Rab11-FIP1C wildtype and GFP-Rab11-FIP1C(S234A) causes two distinct phenotypes during calcium switch: pseudo-stratification and lateral lumen formation. MDCK cell lines stably expressing either GFP-Rab11-FIP1C wildtype (A) or GFP-Rab11-FIP1C(S234A) (B) were examined in the non-switched (NS) condition and 0,1, 2, 4, and 8 hours after calcium re-addition with immunostaining with antibody against Podocalyxin along with fluorescent-Phalloidin to visualize F-actin. Overexpression of GFP-Rab11-FIP1C wildtype protein caused a dramatic pseudo-stratification 2 hours into a calcium switch assay. Podocalyxin localized only to the most apical surface of these pseudo-stratified layers. The expression of the GFP-Rab11-FIP1C(S234A) mutant caused some cell stratification, but also induced F-actin accumulation at the lateral membrane greater than 4 hours after calcium switch in lateral lumens. Podocalyxin also lined the lateral lumens. The lateral lumens are seen in WT overexpression lines (see A. 4 HR), however, to a much lesser extent. X/Z images are shown below X/Y images, < indicates where images were taken for X/Y and X/Z planes. All scale bars = 10µm. C. Quantitation of lateral lumen formation. Wildtype GFP-FIP1C overexpression caused lateral lumens to form in ∼1% of cells, whereas, overexpression of FIP1C(S234A) causes lateral lumen to form in ∼25% of cells following calcium switch (*p = 0.00006, error bars represent standard deviation). Colocalization analysis of wildtype GFP-FIP1C (D) and GFP-FIP1C(S234A) with Podocalyxin colocalization demonstrated little colocalization. Graphs plot mean Pearson's Coefficient, error bars represent standard deviation, WT p = 0.17, SA p = 0.19.
Figure 5.
Figure 5.
Effects of overexpression of GFP-Rab11-FIP1C wildtype and GFP-Rab11-FIP1C(S234A) on p(S234)-FIP1 abundance and localization. Parental T32 MDCK cells (A), and T23 MDCK cells expressing GFP-Rab11-FIP1C wildtype (B) or GFP-FIP1C(S234A) (C) were examined in non-switched cells (NS) and 6 hours after re-addition of calcium for immunostaining for p(S234)-Rab11-FIP1C and phalloidin staining. Overexpression of wildtype GFP-FIP1C and GFP-FIP1C(S234A) increased the lateral localization of pFIP1 staining in non-switched cells. Overexpression of GFP constructs did not inhibit phosphorylation of FIP1 by MARK2. X/Z images are shown below X/Y images, < indicates where images were taken for X/Y and X/Z planes. All scale bars = 10 µm.
Figure 6.
Figure 6.
Endogenous FIP1A/B and MARK2 colocalize with GFP-FIP1C(S234) through calcium switch. A. Stable GFP-FIP1C(S234A) expressing MDCK cells were calcium switched and fixed at 0, 1, 2, 4 or 6 hours following calcium re-addition. Cells were then stained for p(S234)-FIP1 and FIP1A/B. FIP1A/B and pFIP1 colocalized with the GFP-FIP1C(S234A) near the apical membrane. X/Z images are shown below X/Y images, < indicates where images were taken for X/Y and X/Z planes. All scale bars = 10 µm. B. Colocalization analysis confirmed a statistically significant increase in colocalization of GFP-FIP1C(S234A) with pFIP1 after calcium switch (p = 0.000024). C. Strong colocalization was seen between GFP-FIP1C(S234A) and FIP1A/B both at non-switched and switched time points. However, there was a significant increase in colocalization following calcium switch (*p = 0.0001). (B and C.) Graphs plot mean Pearson's Coefficient and error bars represent standard deviation.
Figure 7.
Figure 7.
Overexpression of GFP-Rab11-FIP1C(S234A) causes reorganization of recycling system markers after 8-hour calcium switch. GFP-FIP1C(S234A) expressing cells, either non-switched (NS) or fixed at 8 hours following calcium re-addition were examined for localization of Rab11a (A-C) or Rab11b (D-F) along with phalloidin staining or for Syntaxin 3 with p120 staining (G-I). A. Endogenous Rab11a colocalized with GFP-Rab11-FIP1C(S234A) in non-switched cells and at 8 hours after calcium switch. A still image taken from a 3-dimensional reconstruction shows Rab11a co-localizing with GFP-FIP1C(S234A) beneath the surface of a lateral lumen (B, see Movie S1). C. Colocalization analysis confirmed an increase in colocalization between Rab11a and GFP-FIP1C(S234A) following calcium switch (*p = 0.0001). D. Endogenous staining of Rab11b also colocalized with GFP-Rab11-FIP1C (S234A), however, to a lesser extent than Rab11a. The colocalization decreased significantly in cells after calcium switch (see F; *p = 0.003). E. A still image taken from a 3-dimensional reconstruction of Rab11b co-localizing with GFP-FIP1C(S234A) beneath a lateral lumen (Movie not shown). G. While Syntaxin 3 localized to the apical membrane region in non-switched cells, Syntaxin 3 relocalized following calcium switch in GFP-FIP1C(S234A) cells to the lateral lumen. P120 was used to label lateral membranes and was excluded from the lateral lumen surface. H. A still image taken from a 3-dimensional reconstruction of Syntaxin 3 at the surface of a lateral lumen (see Movie S2). P120 is absent from the surface of the lateral lumen (see Movie S3). I. Colocalization analysis confirms an increase in colocalization between GFP-FIP1C(S234A) and Syntaxin3 (*p = 0.000005). J. Little colocalization was present between GFP-FIP1C(S234A) and p120. X/Z images are shown below X/Y images, < indicates where images were taken for X/Y and X/Z planes. All scale bars = 10 µm. (C. F. I. J.) Graphs plot mean Pearson's Coefficient and error bars represent standard deviation.
Figure 8.
Figure 8.
Overexpression of GFP-Rab11-FIP1C-(S234A) causes relocalization of apical markers to lateral lumens after 6-hour calcium switch. GFP-FIP1C(S234A) expressing cells, either non-switched (NS) or fixed at 6 hours following calcium re-addition, were examined for localization of ZO-1 (A-C) or E-cadherin (D-G) along with ezrin immunostaining or for phospho-ERM (pERM) with phalloidin staining (H-J). A. Endogenous staining of ZO-1 6 hours after calcium switch in GFP-FIP1C(S234A) line showed redistribution of the tight junction protein to the border of lateral lumens. B. A still image taken from a 3-dimensional reconstruction showed ZO-1 completely encircling a lateral lumen. (see Movie S4). Colocalization analysis showed little colocalization between GFP-FIP1C(S234A) and ZO-1 (C) or between ZO-1 and Ezrin (D). E. E-Cadherin was excluded from the lateral lumen membrane following calcium switch. E-cadherin staining also relocated to the new luminal lateral membrane in these cells. F. In a still image from a 3-dimensional reconstruction, E-Cadherin was absent from the new apical membrane, marked with Ezrin in blue (see Movie S5). G. No significant colocalization of GFP-FIP1C(S234A) and E-Cadherin following calcium switch was observed. H. Endogenous staining for pERM in calcium switched, GFP-FIP1C(S234A) line showed pERM relocation to the lateral lumen surface. I. A still image taken from 3-dimensional reconstruction shows pERM co-labeling with phalloidin on the membrane of a lateral lumen (see Movie S6). J. No colocalization was observed for pERM with GFP-FIP1C(S234A) following calcium switch. X/Z images are shown below X/Y images, < indicates where images were taken for X/Y and X/Z planes. All scale bars = 10 µm. In C. D. G. and J, graphs plot mean Pearson's Coefficient and error bars represent standard deviation.
Figure 9.
Figure 9.
Overexpression of GFP-Rab11-FIP1C(S234A) causes reorientation of the centrosome-based axis after 8-hour calcium switch. GFP-FIP1C(S234A) expressing cells, either non-switched (NS) or fixed at 6 hours following calcium re-addition were examined for localization of the centrosome marker Pericentrin (A-C) along with p120 staining or for the Golgi apparatus marker Giantin with phalloidin staining (G-I). A. Endogenous pericentrin in non-switched cells localized to a nidus below the apical membrane. However, 8 hours after calcium switch pericentrin relocalized to a point adjacent to lateral lumens in close proximity to GFP-FIP1C(S234A). B. In a still image taken from 3-dimensional reconstruction, the Pericentrin-staining centrosome is located directly adjacent to GFP-FIP1C(S234A) in association with a lateral lumen (Movie S7). C. No colocalization was seen between pericentrin and GFP-FIP1C(S234A). D. In non-switched cells, Giantin was located deep to the apical membrane. However, 8 hours after calcium switch, Giantin, labeling the Golgi apparatus, reoriented to face the lateral lumen surface. E. In a still image taken from 3-dimensional reconstruction, Giantin stain localizes adjacent to GFP-FIP1C(S234A) however, very little colocalization (F) is seen (Movie S8). X/Z images are shown below X/Y images, < indicates where images were taken for X/Y and X/Z planes. All scale bars = 10 µm. In C and F, graphs plot mean Pearson's Coefficient and error bars represent standard deviation.
Figure 10.
Figure 10.
MARK2 localization is altered in FIP1C(S234A) overexpression lines. Non-switched GFP-FIP1C wildtype and GFP-FIP1C(S234A)-expressing MDCK cells or cells at 4 hours following calcium re-addition were fixed and immunostained for MARK2 and Ezrin. A and B. GFP-FIP1C wildtype did not colocalize with MARK2 in either non-switched cells or 4 hours after calcium switch. C. In non-switched GFP-FIP1C(S234A)-expressing cells, MARK2 did not localize with GFP-FIP1C(S234A). However, in switched cells at 4 hours after re-addition of calcium, a point before lateral lumens are formed, MARK2 colocalization with GFP-FIP1C(S234A) was observed. D. Colocalization of MARK2 and GFP-FIP1C(S234A) overall was weak. However, there was a statistically significant increase from NS to 4 HR. X/Z images are shown below X/Y images, < indicates where images were taken for X/Y and X/Z planes. All scale bars = 10 µm. In B and D, graphs plot mean Pearson's Coefficient and error bars represent standard deviation.

Similar articles

Cited by

References

    1. Guo S, Kemphues KJ. par-1, a gene required for establishing polarity in C. elegans embryos, encodes a putative Ser/Thr kinase that is asymmetrically distributed. Cell 1995; 81:611-20. - PubMed
    1. Elbert M, Rossi G, Brennwald P. The yeast par-1 homologs kin1 and kin2 show genetic and physical interactions with components of the exocytic machinery. Mol Biol Cell 2005; 16:532-49; PMID:15563607; http://dx.doi.org/10.1091/mbc.E04-07-0549 - DOI - PMC - PubMed
    1. Shulman JM, Benton R, St Johnston D. The Drosophila homolog of C. elegans PAR-1 organizes the oocyte cytoskeleton and directs oskar mRNA localization to the posterior pole. Cell 2000; 101:377-88. - PubMed
    1. Drewes G, Ebneth A, Preuss U, Mandelkow EM, Mandelkow E. MARK, a novel family of protein kinases that phosphorylate microtubule-associated proteins and trigger microtubule disruption. Cell 1997; 89:297-308; PMID:9108484; http://dx.doi.org/10.1016/S0092-8674(00)80208-1 - DOI - PubMed
    1. Cohen D, Brennwald PJ, Rodriguez-Boulan E, Musch A. Mammalian PAR-1 determines epithelial lumen polarity by organizing the microtubule cytoskeleton. J Cell Biol 2004; 164:717-27; PMID:14981097; http://dx.doi.org/10.1083/jcb.200308104 - DOI - PMC - PubMed

LinkOut - more resources