. 2017 Feb 23;7(4):533-549.
doi: 10.1002/2211-5463.12201. eCollection 2017 Apr.

Thermo-kinetic analysis space expansion for cyclophilin-ligand interactions - identification of a new nonpeptide inhibitor using Biacore™ T200

Affiliations

Thermo-kinetic analysis space expansion for cyclophilin-ligand interactions - identification of a new nonpeptide inhibitor using Biacore™ T200

Martin A Wear et al. FEBS Open Bio. .

Abstract

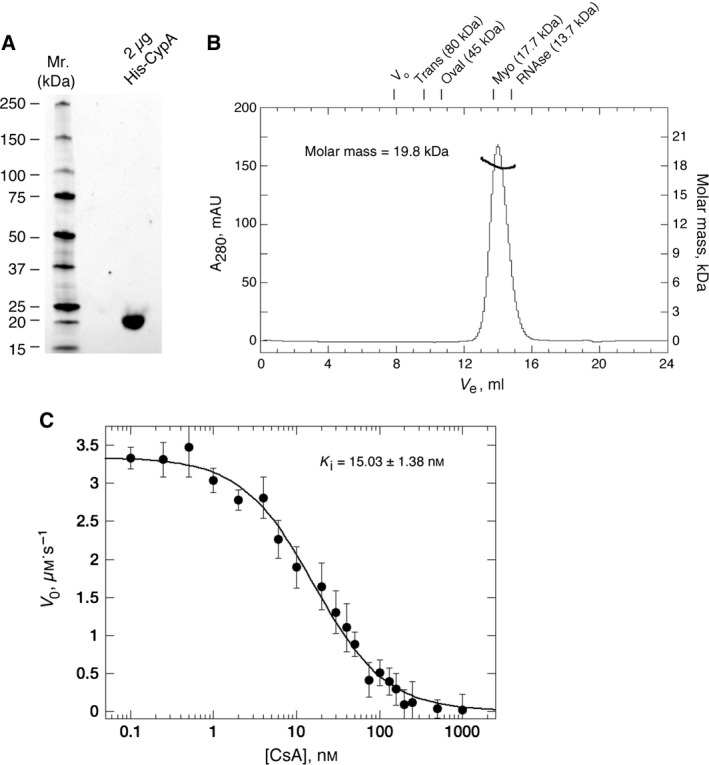
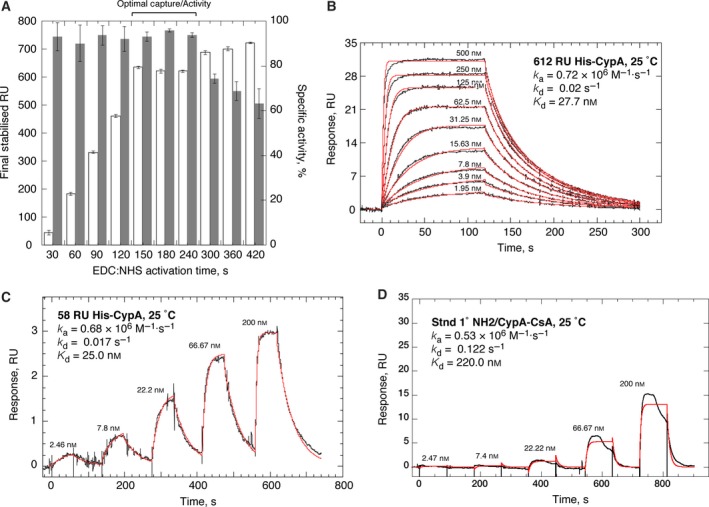
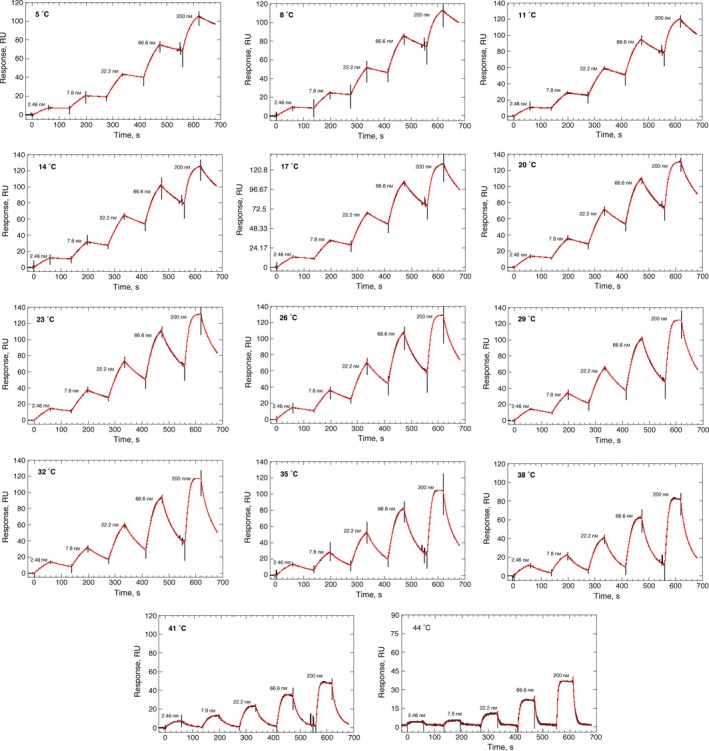
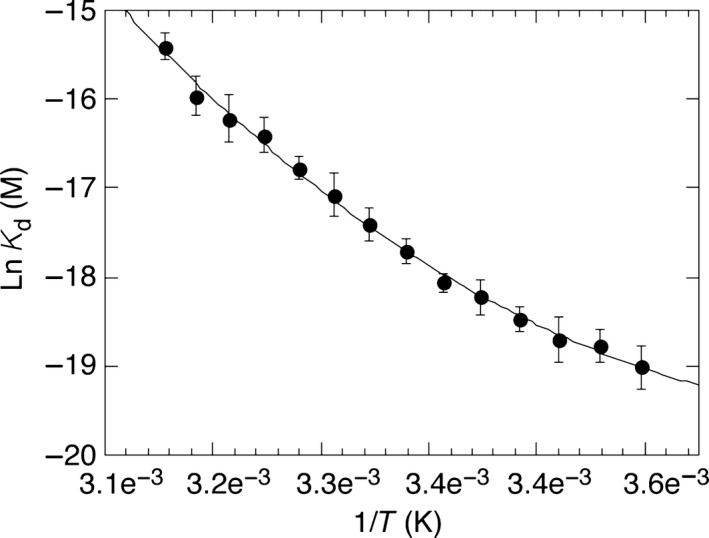
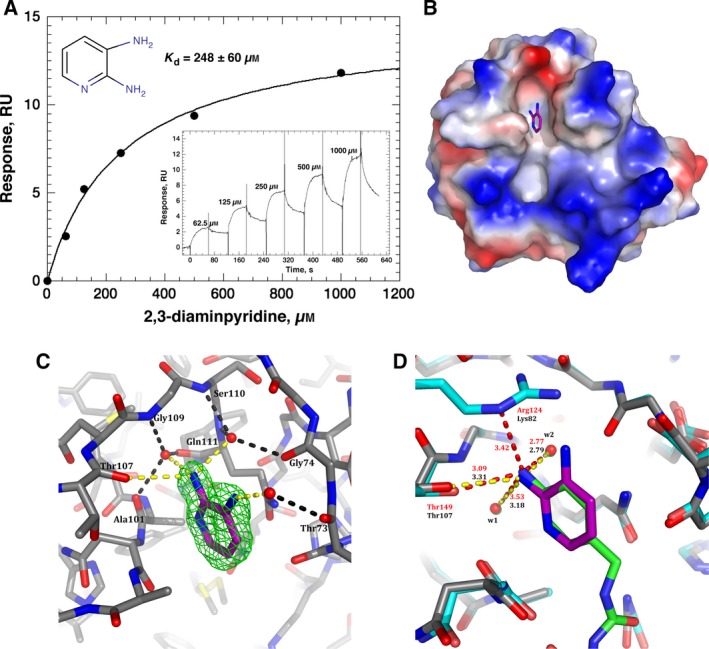
We have established a refined methodology for generating surface plasmon resonance sensor surfaces of recombinant his-tagged human cyclophilin-A. Our orientation-specific stabilisation approach captures his-tagged protein under 'physiological conditions' (150 mm NaCl, pH 7.5) and covalently stabilises it on Ni2+-nitrilotriacetic acid surfaces, very briefly activated for primary amine-coupling reactions, producing very stable and active surfaces (≥ 95% specific activity) of cyclophilin-A. Variation in protein concentration with the same contact time allows straightforward generation of variable density surfaces, with essentially no loss of activity, making the protocol easily adaptable for studying numerous interactions; from very small fragments, ~ 100 Da, to large protein ligands. This new method results in an increased stability and activity of the immobilised protein and allowed us to expand the thermo-kinetic analysis space, and to determine accurate and robust thermodynamic parameters for the cyclophilin-A-cyclosporin-A interaction. Furthermore, the increased sensitivity of the surface allowed identification of a new nonpeptide inhibitor of cyclophilin-A, from a screen of a fragment library. This fragment, 2,3-diaminopyridine, bound specifically with a mean affinity of 248 ± 60 μm. The X-ray structure of this 109-Da fragment bound in the active site of cyclophilin-A was solved to a resolution of 1.25 Å (PDB: 5LUD), providing new insight into the molecular details for a potential new series of nonpeptide cyclophilin-A inhibitors.

Keywords: cyclophilin‐A; inhibitor; nonpeptide; surface plasmon resonance; thermodynamics.


Figures

Figure 1
Figure 1
(A) Ultrapure, monodisperse and highly active protein is used for sensor‐surface generation. (A) 4–15% acrylamide SDS Stain‐free TGX gel (BioRad, Hercules, CA, USA) illustrating the final purity of His‐CypA (2 μg total protein). Standards are shown to the left. (B) Size‐exclusion chromatography (ÅKTA‐Micro; GE Healthcare) coupled with UV, static light scattering and RI detection (Viscotec SECMALS 20 and Viscotek RI Detector:VE3580; Malvern Instruments), were used to determine the molar mass of His‐CypA in solution. About 100 μL of 1 mg·mL−1 His‐CypA was run on a Superdex‐75 10/300 GL (GE Healthcare) size exclusion column pre‐equilibrated in 10 mm NaH2 PO 4, pH 7.5; 150 mm NaCl at 22 °C, at 0.8 mL·min−1. Light scattering, RI and A 280 nm were analysed by a homo‐polymer model (omnisec software, v 5.1; Malvern Instruments) using the following parameters: ∂A/∂c at 280 nm 0.71 AU·mL−1·mg−1 and ∂n/∂c of 0.185 mL·g−1. His‐CypA protein elutes a single sharp peak with a correlative R s of 1.82 ± 0.1 nm (mean ± SEM, n = 5). Elution positions for standards are shown above the chromatograph. The molar mass average across the elution profile is 19.8 kDa with excellent monodispersity (Mw/Mn = 1.003). The theoretical molecular weight of His‐CypA is 21.04 kDa. DLS analysis (data not shown) also indicates high monodispersity for His‐CypA solutions with a mean R h of 1.85 ± 0.17 nm (mean ± SEM, n = 5), a polydispersity index of ≤ 0.1, and a correlative molecular weight of between 19 and 21 kDa, consistent with a highly pure and monomeric protein solution. (C) Inhibition of His‐CypA's PPIase activity by CsA. Initial background corrected reaction (V 0) rate in μm·s−1 is plotted versus the concentration of CsA in nm. Solid lines are a least squares fit of the data to Eqn (1) (see Material and methods). Each point is the mean ± SE, n = 3. The mean K i value for CsA, at 12 °C, is 15.03 ± 1.38 nm.
Figure 2
Figure 2
Optimisation of capture/stabilisation parameters on modified nitrilotriacetic acid‐sensor surfaces. (A) Graphical representation comparing the EDCNHS activation time with the final levels of immobilised His‐CypA (white bars, left axis) and the corresponding specific activity of the surfaces (dark grey bars, right axis). Contact time in each experiment was 30 s with a 100 nm solution of His‐CypA. In all cases the experimental RU max value was generated by passing 1.2 μm CsA in 10 mm NaH2 PO 4, pH 7.5, 150 mm NaCl, 50 μm EDTA; 0.05% surfactant P20; 1% ethanol over the surface. (B) Representative reference corrected SPR sensorgrams (black), monitored on a surface with 612 RU of covalently stabilised His‐CypA (100 nm, 30 s of contact following 180 s of activation). A twofold dilution series of CsA, from 500 nm to 1.95 nm, was run at 25 °C in 10 mm NaH2 PO 4, pH 7.5, 150 mm NaCl, 1 mm EDTA; 0.05% surfactant P20; 1% ethanol at 100 μL·min−1. The on‐ and off‐rate constants were by globally fitting (red) a 1 : 1 kinetic binding model to the sensorgrams using the analysis software (v2.02; GE Healthcare) supplied with the instrument. Mean values (n = 5, ±SEM) determined for the on‐rate (k a), off‐rate (k d) and equilibrium dissociation constants (K d) are (0.79 ± 0.06) × 106 m −1?s−1, 0.018 ± 0.004 s−1 and 22.8 ± 3.6 nm respectively. (C) Reference corrected SPR single‐cycle kinetic sensorgrams (black), monitored on a surface with 58 RU of covalently stabilised His‐CypA (10 nm, 30 s of contact following 180 s of activation). A threefold dilution series of CsA, from 200 to 2.46 nm, was run at 25 °C in 10 mm NaH2 PO 4, pH 7.5, 150 mm NaCl, 1 mm EDTA; 0.05% surfactant P20; 1% ethanol at 100 μL·min−1. The on‐ and off‐rate constants were by globally fitting (red) a 1 : 1 kinetic binding model to the sensorgrams using the analysis software (v2.02; GE Healthcare) supplied with the instrument. Mean values (n = 3, ±SEM) determined for the on‐rate (k a), off‐rate (k d) and equilibrium dissociation constants (K d) are (0.73 ± 0.07) × 106 m −1?s−1, 0.018 ± 0.006 s−1 and 24.7 ± 5.3 nm respectively. (D) Reference corrected SPR single‐cycle kinetic sensorgrams (black), monitored on a surface with 780 RU of His‐CypA immobilised utilising standard amine coupling chemistry (100 μg·mL−1 His‐CypA in 10 mm acetate, pH 5.8, with a 30‐s contact time with the activated surface). A threefold dilution series of CsA, from 200 to 2.46 nm, was run at 25 °C in 10 mm NaH2 PO 4, pH 7.5, 150 mm NaCl, 1 mm EDTA; 0.05% surfactant P20; 1% ethanol at 100 μL·min−1. The on‐ and off‐rate constants were by globally fitting (red) a 1 : 1 kinetic binding model to the sensorgrams using the analysis software (v2.02; GE Healthcare) supplied with the instrument. Mean values (n = 3, ±SEM) determined for the on‐rate (k a), off‐rate (k d) and equilibrium dissociation constants (K d) are (0.48 ± 0.1) × 106 m −1?s−1, 0.14 ± 0.1 s−1 and 291.7 ± 104 nm respectively.
Figure 3
Figure 3
Effect of temperature on the binding of CsA to His‐CypA. Reference corrected SPR single‐cycle kinetic sensorgrams (black), monitored on a surface with 2378 RU of covalently stabilised His‐CypA (250 nm, 30‐s contact following 180‐s activation) for the indicated CsA concentrations (200–2.46 nm) from 5 °C to 44 °C in 3 °C increments. The on‐ and off‐rate constants were by globally fitting (red) a 1 : 1 kinetic binding model to the sensorgrams using the analysis software (v2.02; GE Healthcare) supplied with the instrument. Mean values (n = 3, ±SEM) determined for the on‐rate (k a), off‐rate (k d) and equilibrium dissociation constants (K d) are shown in Table 1.
Figure 4
Figure 4
Thermodynamic characterisation of the CypA–CsA interaction by SPR Biacore™ T200. Plot of lnKd versus 1/T in K. Data were fit (solid line) to Eqn (4) using kaleidagraph v4.1.3 software (Synergy Software). Thermodynamic parameters calculated from these data are shown in Table 1.
Figure 5
Figure 5
Binding and structural analysis of His‐CypA–2,3‐diaminopyridine complex. (A) Reference corrected SPR single‐cycle kinetic sensorgrams (black), monitored on a surface with 2866 RU of covalently stabilised His‐CypA (300 nm, 30‐s contact following 180‐s activation) for the indicated 2,3‐diaminopyridine concentrations (1 mm–62.5 μm). The apparent equilibrium dissociation was determined by fitting (red) a 1 : 1 Langmuir binding model (inset) to the sensorgrams using the analysis software (v2.02; GE Healthcare) supplied with the instrument. The mean K d value is 248 ± 60 μm (n = 3, ±SEM). (B) Electrostatic surface of the structure of CypA in complex with 2,3‐diaminopyridine (PDB: 5LUD). The ligand is drawn with purple carbons and is observed in the Abu pocket, the hydrophobic active site is below in the orientation shown. (C) Electron density and 2,3‐diaminopyridine–CypA interaction details. The omit electron density (F o − F c) contoured at 3σ is shown around the 2,3‐diaminopyridine ligand as a green mesh, all ligand atoms are clearly defined in density. Direct hydrogen bond interactions to the ligand are represented as yellow dashes, while bridged water–protein hydrogen bonds are represented as black dashes. (D) Comparison of the CypA–2,3‐diaminopyridine structure (grey carbons – protein, purple carbons – ligand) and the CypD–ligand structure of 4J5C (Cyan carbons – protein, Green carbons – ligand). Comparitive distances in the respective complexes are indicated (yellow dashes/black labels, CypA–2,3‐diaminopyridine; red dashes/red labels CypD–ligand structure 4J5C).

Similar articles

Cited by

References

    1. Zeidan E, Kepley CL, Sayes C and Sandros MG (2015) Surface plasmon resonance: a label‐free tool for cellular analysis. Nanomedicine 10, 1833–1846. - PubMed
    1. Lee TH, Hirst DJ and Aguilar MI (2015) New insights into the molecular mechanisms of biomembrane structural changes and interactions by optical biosensor technology. Biochim Biophys Acta 1848, 1868–1885. - PubMed
    1. Nguyen HH, Park J, Kang S and Kim M (2015) Surface plasmon resonance: a versatile technique for biosensor applications. Sensors 15, 10481–10510. - PMC - PubMed
    1. Aristotelous T, Hopkins AL and Navratilova I (2015) Surface plasmon resonance analysis of seven‐transmembrane receptors. Methods Enzymol 556, 499–525. - PubMed
    1. Wittenberg NJ, Wootla B, Jordan LR, Denic A, Warrington AE, Oh SH and Rodriguez M (2014) Applications of SPR for the characterization of molecules important in the pathogenesis and treatment of neurodegenerative diseases. Expert Rev Neurother 14, 449–463. - PMC - PubMed