. 2017 Apr 11:6:e22519.
doi: 10.7554/eLife.22519.

Co-option of an endogenous retrovirus envelope for host defense in hominid ancestors

Affiliations

Co-option of an endogenous retrovirus envelope for host defense in hominid ancestors

Daniel Blanco-Melo et al. Elife. .

Abstract

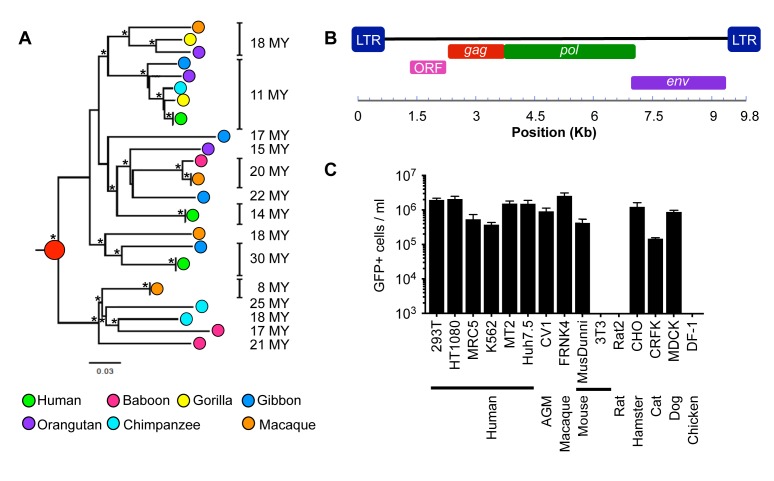
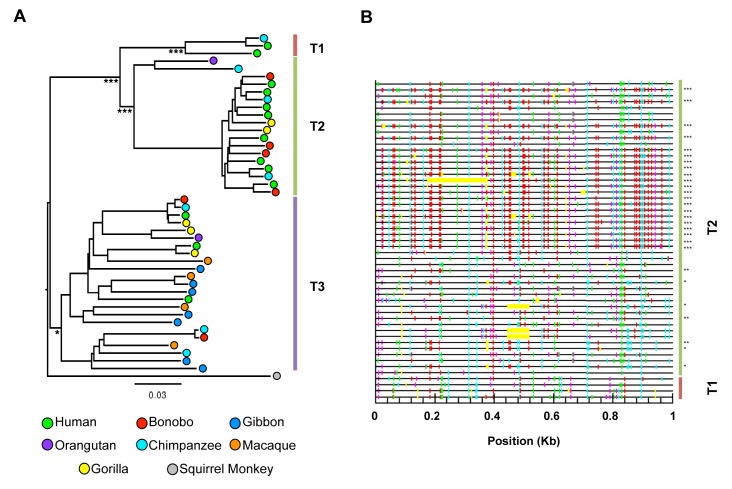
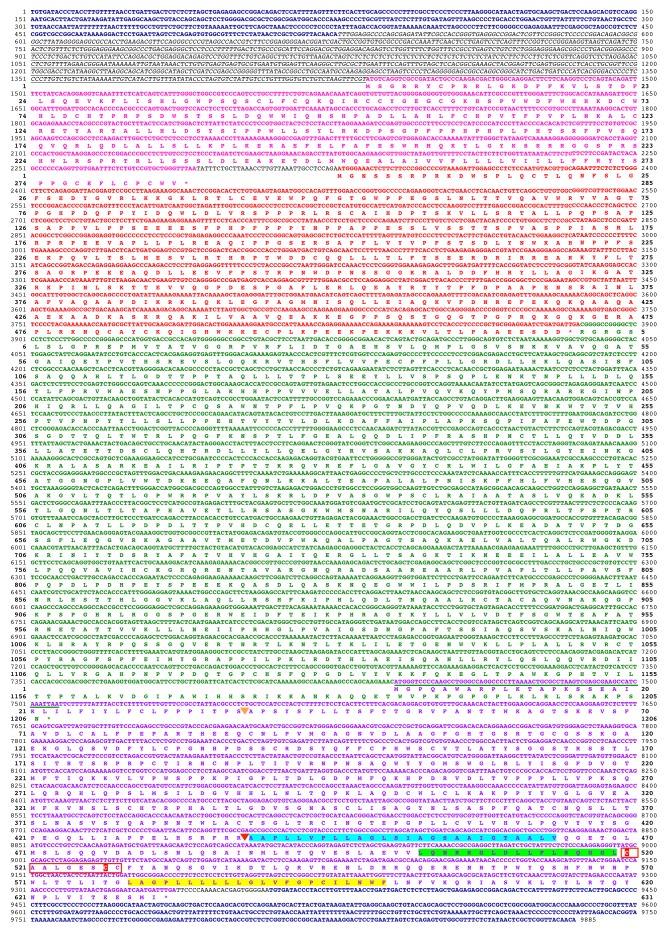
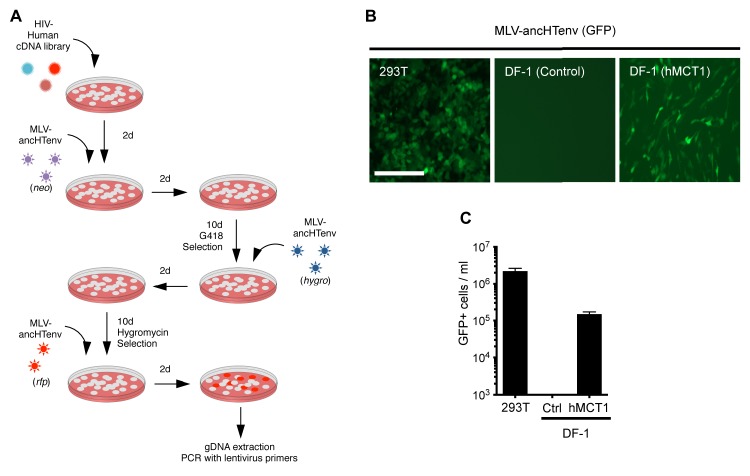
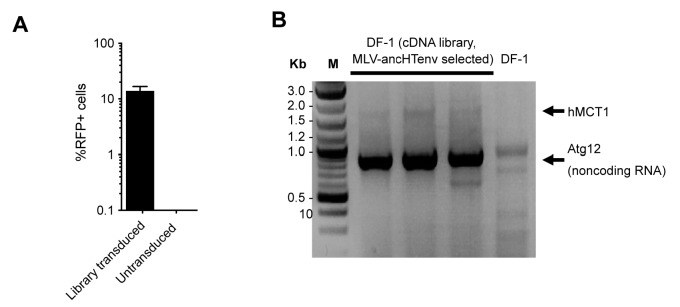
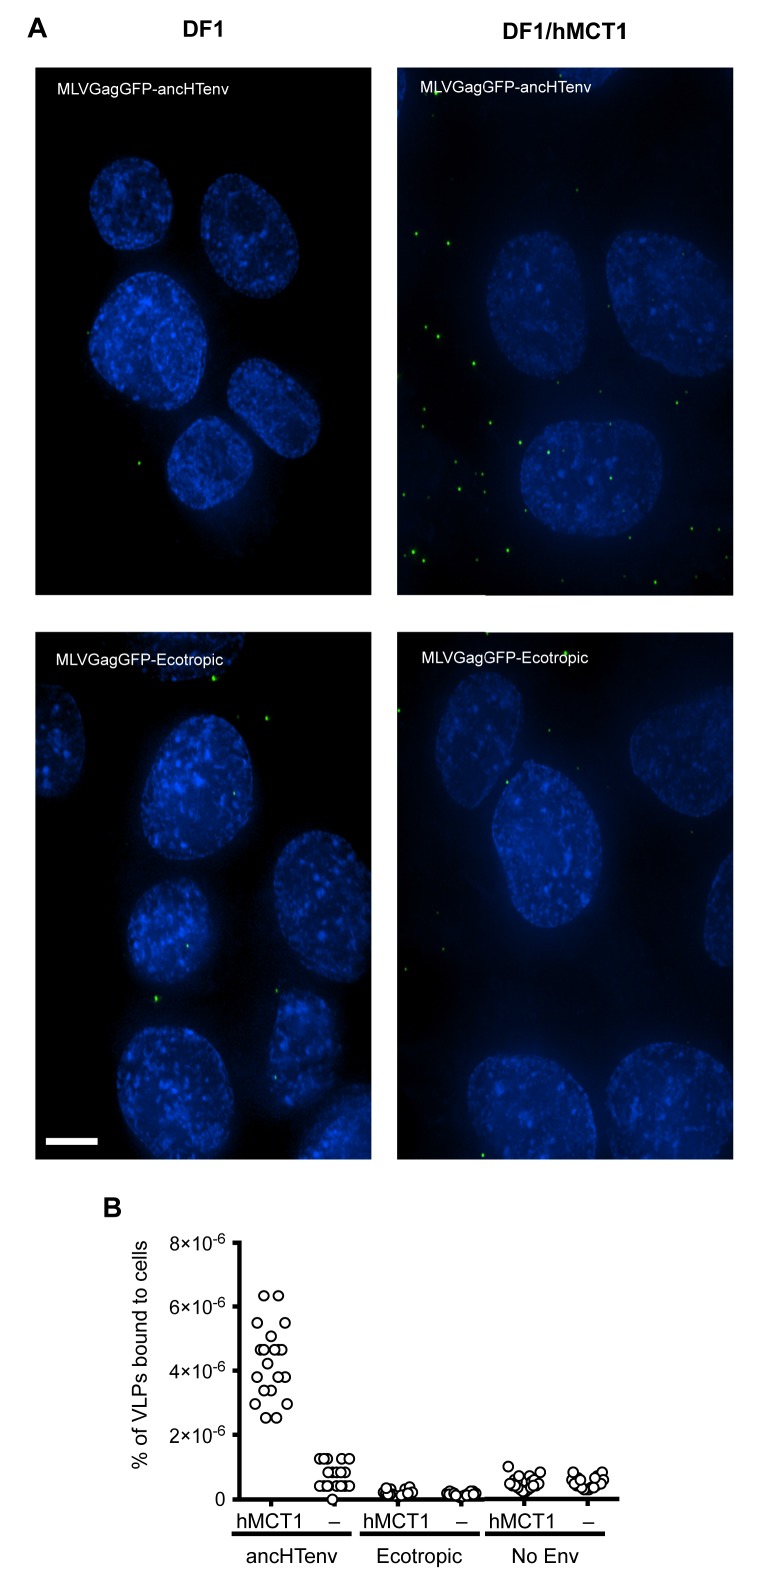
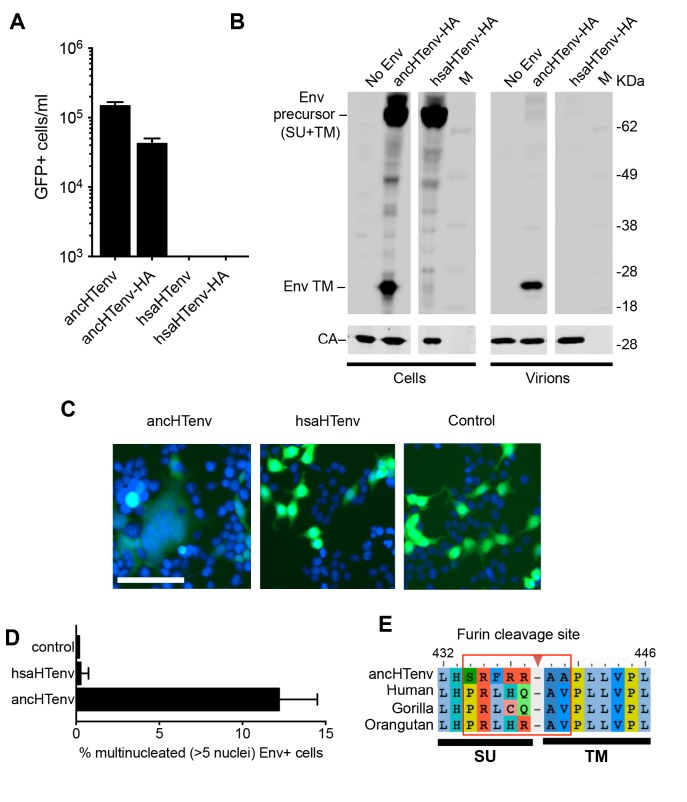
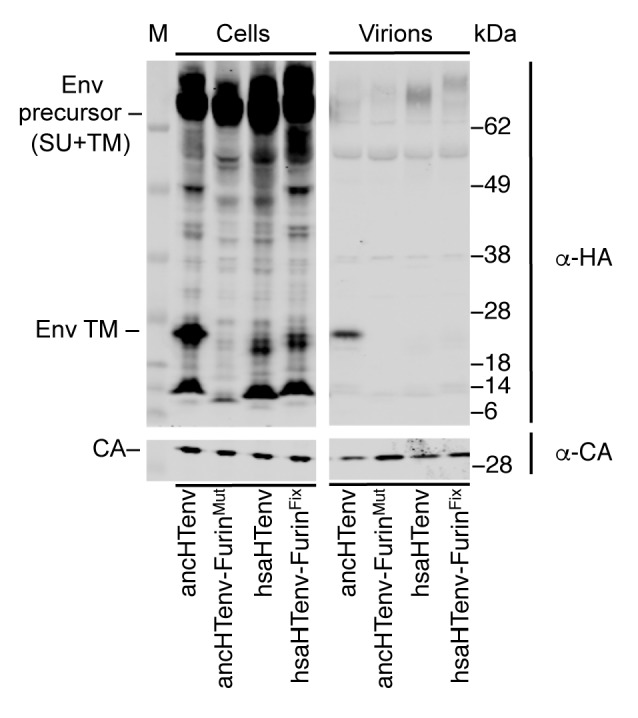
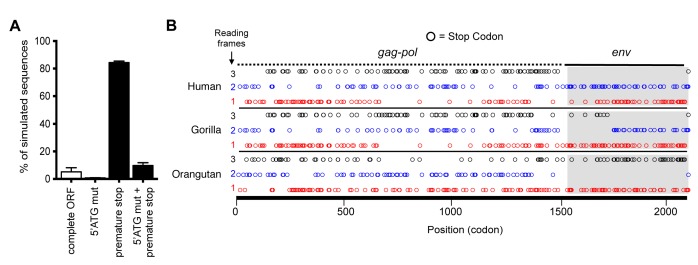
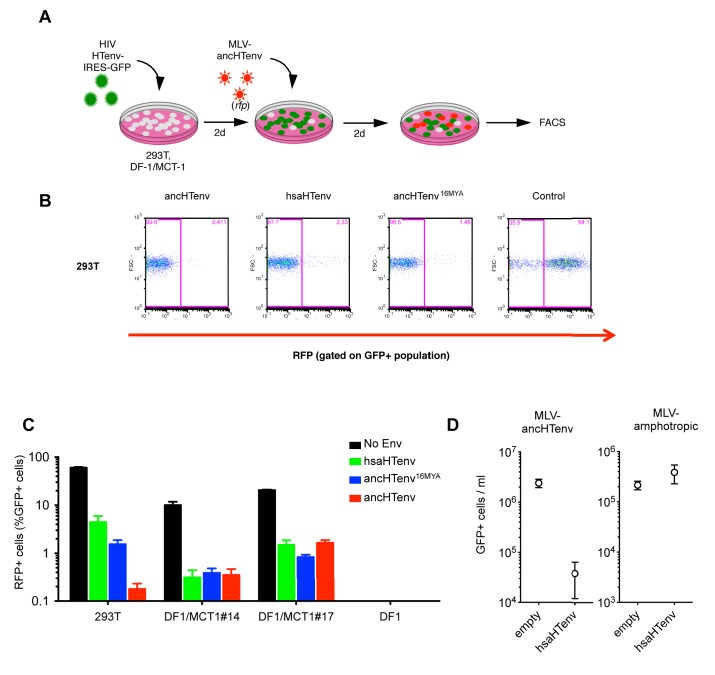
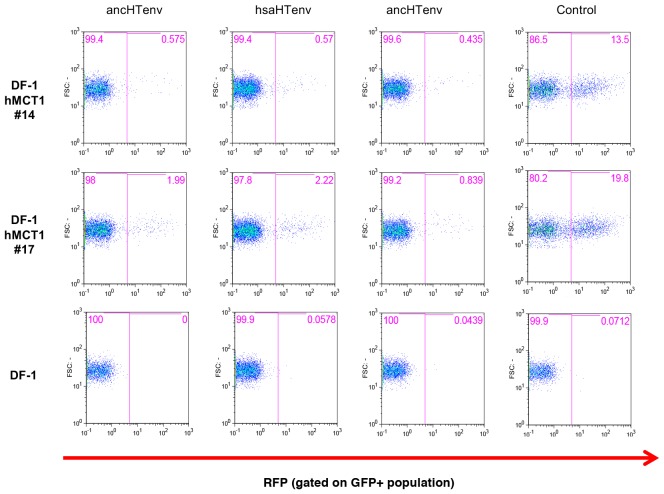
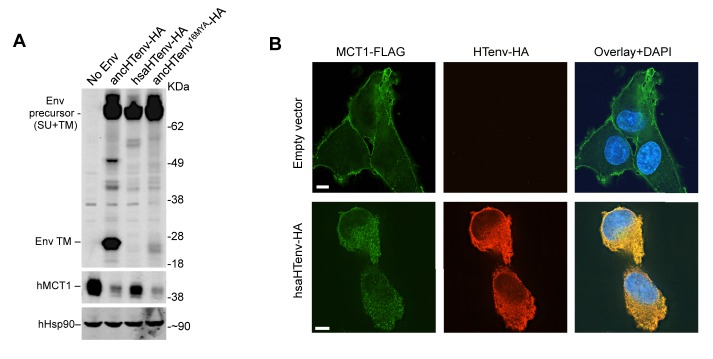
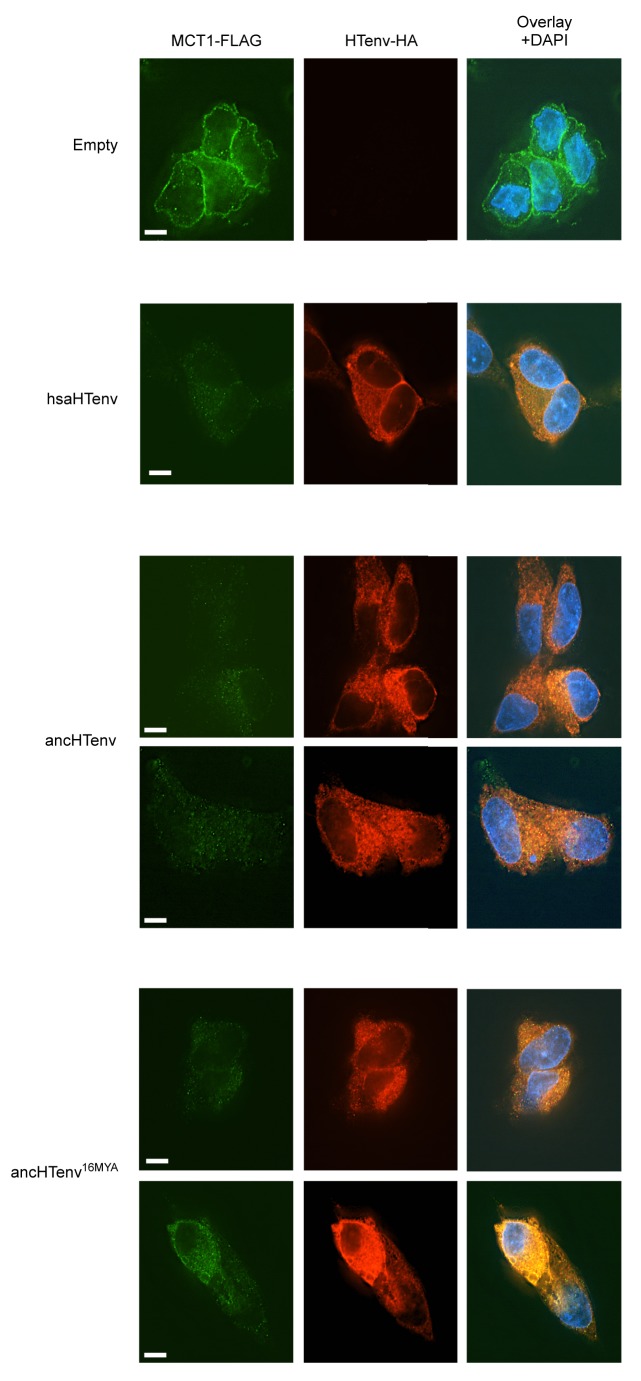
Endogenous retroviral sequences provide a molecular fossil record of ancient infections whose analysis might illuminate mechanisms of viral extinction. A close relative of gammaretroviruses, HERV-T, circulated in primates for ~25 million years (MY) before apparent extinction within the past ~8 MY. Construction of a near-complete catalog of HERV-T fossils in primate genomes allowed us to estimate a ~32 MY old ancestral sequence and reconstruct a functional envelope protein (ancHTenv) that could support infection of a pseudotyped modern gammaretrovirus. Using ancHTenv, we identify monocarboxylate transporter-1 (MCT-1) as a receptor used by HERV-T for attachment and infection. A single HERV-T provirus in hominid genomes includes an env gene (hsaHTenv) that has been uniquely preserved. This apparently exapted HERV-T env could not support virion infection but could block ancHTenv mediated infection, by causing MCT-1 depletion from cell surfaces. Thus, hsaHTenv may have contributed to HERV-T extinction, and could also potentially regulate cellular metabolism.

Keywords: Endogenous retrovirus; Hominid; Paleovirology; evolutionary biology; genomics; human; infectious disease; microbiology; receptors; virus.


Conflict of interest statement

The authors declare that no competing interests exist.

Figures

Figure 1.
Figure 1.. Functional reconstruction of a ~32 MY old HERV-T envelope protein.
(A) Phylogenetic tree of HERV-T3 proviral sequences in OWM and apes. Orthologous sequences are bracketed and estimated integration times indicated. * >90% bootstrap support. Red circle = ancestral root node. (B) Ancestral HERV-T3 genome with ORFs indicated. (C) Infectivity of MLV particles containing a GFP reporter and pseudotyped with the ancHTenv protein (Mean ± SD, n = 3 replicates). See also Figure 1—figure supplements 1–2. DOI: http://dx.doi.org/10.7554/eLife.22519.003
Figure 1—figure supplement 1.
Figure 1—figure supplement 1.. HERV-T proviruses cluster into four monophyletic clades.
(A) Maximum likelihood phylogenetic tree of 44 HERV-T proviruses. Three distinct clades in OWM and apes (HERV-T1, HERV-T2 and HERV-T3) are indicated by colored blocks. HERV-T1 had LTRs that shared 64% and 55% identity with HERV-T2 and HERV-T3 s respectively. The tree was rooted using a related outgroup sequence from the squirrel monkey (Saimiri boliviensis). Bootstrap support for internal nodes is indicated by asterisks: (*)>80%, (***)>99% (1000 bootstrap replicates). The temporal appearance of these HERV-T-like integrations and the geographical separation of the platyrrhini and catarrhini primate lineages, suggest that platyrrhini and catarrhini HERV-T-like sequences most likely result from independent germ line invasion events. (B) Proviral sequences were aligned to a consensus HERV-T sequence and analysed using Hypermut 2.0 with default parameters. Image corresponds to nucleotides 6877 to 7876 spanning the junction of the pol and env genes. Lines in red, cyan green and magenta represent (GG to AG, GA to AA, GC to AC and GT to AT transitions, respectively). Asterisks indicate statistical significance in a fisher-exact test for APOBEC3-mediated hypermutation. (*) p-value<0.05, (**) p-value<0.01, (***) p-value<0.001. DOI: http://dx.doi.org/10.7554/eLife.22519.005
Figure 1—figure supplement 2.
Figure 1—figure supplement 2.. Deduced sequence of a 32MY old ancestral HERV-T3.
Nucleotide and translated amino acid sequence of the reconstructed ancestral HERV-T3 sequence. LTRs are shown in deep blue and bold. The leader sequence is shown in italics and underlined. The pre-gag, gag, pol and env ORFs are indicated in pink, red, green and purple color, respectively. Underlined in green is the sequence overlap between pol and env. The predicted signal peptide and furin cleavage sites are indicated by orange and red triangles, respectively. The predicted fusion peptide, immunosuppressive and transmembrane domains are highlighted in cyan, green and yellow, respectively. The CX6CC motif is indicated with a red box, and the cysteine residues involved in the disulfide-bonded loop are highlighted in red. Cleavage sites were predicted using ProP 1.0. DOI: http://dx.doi.org/10.7554/eLife.22519.006
Figure 2.
Figure 2.. MCT-1 functions as a receptor for ancestral HERV-T.
(A) Scheme of the receptor screening strategy. DF-1 cells were transduced with a lentiviral cDNA library. Two days later, the cells were challenged with MLV-ancHTenv containing a neo gene. After a further two days, cells were placed in G418 selection. After another 10 days, G418-resistant cells were replated and challenged with MLV-ancHTenv containing a hygromycin resistance gene. Two days later cells were placed in hygromycin selection. After a further 10 days, Hygromycin-resistant cells were replated and challenged with MLV-ancHTenv containing RFP and were found to be highly susceptible to infection (Figure 2—figure supplement 1A). Genomic DNA (gDNA) was extracted from this cell population and subjected to PCR using primers specific to the lentiviral vector (Figure 2—figure supplement 1B). (B) Fluorescent micrographs of 293T and DF-1 cells, expressing hMCT1 or a control protein, following infection with MLV-ancHTenv expressing GFP as reporter. Scale bar = 200 μm. (C) Titers of MLV-ancHTenv/GFP on 293T and DF-1 cells expressing hMCT1 or a control protein (Mean ± SD, n = 2 replicates, one of two separate experiments). DOI: http://dx.doi.org/10.7554/eLife.22519.007
Figure 2—figure supplement 1.
Figure 2—figure supplement 1.. HERV-T receptor identification.
(A) Relative MLV-ancHTenv/RFP sensitivity of library transduced (Mean ± SD, n = 3 separate pools of cells assayed once each), and untransduced DF1 cells subjected to the infection selection strategy outlined in (Figure 2A). (B) Products of PCR reactions from three RFP positive DF-1 cell populations, and control DF-1 cells. DOI: http://dx.doi.org/10.7554/eLife.22519.008
Figure 3.
Figure 3.. Binding of ancHTenv-pseudotyped MLV particles to DF1 cells expressing MCT1.
(A) Fluorescent micrographs of MLV Gag-GFP VLPs pseudotyped with ancHTenv or ecotropic MLV, bound to DF-1 cells expressing hMCT1 or an empty vector. Scale bar = 5 μm. (B) Enumeration of MLV Gag-GFP VLPs bearing the indicated Env proteins bound to DF-1 cells expressing MCT-1 or an empty vector. Each data point represents an individual cell (n = 20 for each condition). DOI: http://dx.doi.org/10.7554/eLife.22519.009
Figure 4.
Figure 4.. The human genome encodes a HERV-T Env ORF that does not function as a retroviral envelope.
(A) Infectiousness of MLV particles pseudotyped with untagged or C-terminally HA-tagged ancHTenv or hsaHTenv (Mean ± SD, n = 3 replicates, one of two experiments). (B) Western blot analyses (α-CA and α-HA) of cell lysates and MLV virions generated following expression of C-terminally HA-tagged ancHTenv or hsaHTenv M: markers. (C) Examples of cell fusion in 293T cell cultures expressing ancHTenv or hsaHTenv linked to IRES-GFP. Scale bar = 100 μm. (D) Percentage of GFP+ multinucleated cells (>5 nuclei/cell) in 293T cell cultures expressing ancHTenv or hsaHTenv linked to IRES-GFP (Mean ± SD, n = 3 groups of ten microscopic fields, one of two experiments) Blue: DAPI. (E) Alignment of ancHTenv and intact or nearly intact HERV-T Env protein sequences encoded by hominid genomes, proximal to the furin cleavage site. See also Figure 4—figure supplement 1. DOI: http://dx.doi.org/10.7554/eLife.22519.012
Figure 4—figure supplement 1.
Figure 4—figure supplement 1.. Effects of mutations at the furin cleavage site on ancHTenv and hsaHTenv processing.
Western blot (anti-CA and anti-HA) analyses of cell lysates and virions following expression of MLV Gag-Pol and HA-tagged ancHTenv, hsaHTenv, or furin cleavage site-modified derivatives. AncHTenv-FurinMut contains the furin cleavage site residues from hsaHTenv. HsaHTenv-FurinFix contains the furin cleavage site residues from ancHTenv. M= molecular weight markers. DOI: http://dx.doi.org/10.7554/eLife.22519.013
Figure 5.
Figure 5.. Preservation of hsaHTenv and its orthologs in hominids.
(A) Monte-Carlo simulations of ancHTenv16MYA evolution for 13.45–19.68 MY using a human neutral substitution rate. The percentage of 10,000 simulated sequences of each type is plotted with error bars indicating maximum and minimum estimates. (B) Distribution of stop codons (colored circles) in the Gag, Pol and Env coding sequence of proviruses orthologous to the HERV-T provirus containing hsaHTenv. DOI: http://dx.doi.org/10.7554/eLife.22519.014
Figure 6.
Figure 6.. The hsaHTenv protein specifically inhibits HERV-T infection.
(A) Scheme of the antiviral assay. Cells, 293T or DF-1 expressing hMCT1, were transduced with lentiviral vectors expressing HERV-T Env proteins or an unrelated protein (No Env) together with a GFP reporter gene to monitor expression. Cells were challenged with MLV particles pseudotyped with ancHTenv that expresses RFP upon infection. Cell populations were analyzed by FACS 2 days after infection. (B) Representative experiment based on the scheme depicted in (A) conducted using 293T cells expressing the indicated Env proteins. (C) Infectivity of MLV-ancHTenv on 293T cells or two clones of MCT1-expressing DF1 cells (#14, #17), expressing HERV-T envelope proteins according to the scheme described in (A). Plots describe the percentage of RFP positive cells (infected) after gating on the GFP positive (Env-expressing) cell population. (Mean ± SD, n = 3 independent experiments). (D) Susceptibility of clones of 293T cells expressing an empty vector or hsaHTenv-HA to infection by MLV-ancHTenv/GFP or amphotropic MLV/GFP (Mean ± SD, n = 3 three independent single cell clones assayed once each). See also Figure 6—figure supplement 1. DOI: http://dx.doi.org/10.7554/eLife.22519.016
Figure 6—figure supplement 1.
Figure 6—figure supplement 1.. Antiviral activity of HERV-T Env proteins.
Single cell clones of DF-1 cells that expressed hMCT1-HA, or naïve DF-1 cells, were transduced with lentiviral vectors expressing HERV-T Env proteins or an unrelated protein (Control) together with a GFP reporter gene to monitor expression. Cell populations were analyzed by FACS 2 days after infection. A represesentative experiments is shown in which the percentage of RFP positive (infected) cells is determined after gating on the on the GFP positive (Env-expressing) cell population. DOI: http://dx.doi.org/10.7554/eLife.22519.017
Figure 7.
Figure 7.. The hsaHTenv protein causes depletion of hMCT1 from the cell surface.
(A) Western blot analyses (α-HA, α-hMCT1 and α-hHsp90) of 293T cell lysates generated following transduction with lentiviral vectors encoding C-terminally HA-tagged HERV-T envelopes. (B) Immunofluorescent micrographs of hMCT1-Flag-expressing DF-1 cells transduced with vectors expressing hsaHTenv-HA or an empty vector. Green: α-Flag, red: α-HA, Blue: DAPI. Scale bar = 5 μm. See also Figure 7—figure supplement 1. DOI: http://dx.doi.org/10.7554/eLife.22519.018
Figure 7—figure supplement 1.
Figure 7—figure supplement 1.. Additional examples of MCT-1 depletion and releocalization following expression of HERV-T Env proteins.
Immunofluorescent micrographs of hMCT1-Flag-expressing DF-1 cells transduced with lentiviral vectors expressing various HA-tagged HERV-T envelopes or an empty vector. Green: α-Flag, red: α-HA, Blue: DAPI. Scale bar = 5 μm. DOI: http://dx.doi.org/10.7554/eLife.22519.019

Comment in

  • Pushing the envelope.
    Wildschutte JH, Coffin JM. Wildschutte JH, et al. Elife. 2017 Apr 13;6:e26397. doi: 10.7554/eLife.26397. Elife. 2017. PMID: 28406395 Free PMC article.

Similar articles

Cited by

References

    1. Bao W, Kojima KK, Kohany O. Repbase update, a database of repetitive elements in eukaryotic genomes. Mobile DNA. 2015;6:11. doi: 10.1186/s13100-015-0041-9. - DOI - PMC - PubMed
    1. Best S, Le Tissier P, Towers G, Stoye JP. Positional cloning of the mouse retrovirus restriction gene Fv1. Nature. 1996;382:826–829. doi: 10.1038/382826a0. - DOI - PubMed
    1. Bénit L, Dessen P, Heidmann T. Identification, phylogeny, and evolution of retroviral elements based on their envelope genes. Journal of Virology. 2001;75:11709–11719. doi: 10.1128/JVI.75.23.11709-11719.2001. - DOI - PMC - PubMed
    1. Blusch JH, Haltmeier M, Frech K, Sander I, Leib-Mösch C, Brack-Werner R, Werner T. Identification of endogenous retroviral sequences based on modular organization: proviral structure at the SSAV1 locus. Genomics. 1997;43:52–61. doi: 10.1006/geno.1997.4790. - DOI - PubMed
    1. Chuong EB, Elde NC, Feschotte C. Regulatory evolution of innate immunity through co-option of endogenous retroviruses. Science. 2016;351:1083–1087. doi: 10.1126/science.aad5497. - DOI - PMC - PubMed

Publication types

MeSH terms