. 2017 Apr 11:7:46116.
doi: 10.1038/srep46116.

Second harmonic generation imaging of corneal stroma after infection by Pseudomonas aeruginosa

Affiliations

Second harmonic generation imaging of corneal stroma after infection by Pseudomonas aeruginosa

Danielle M Robertson et al. Sci Rep. .

Abstract

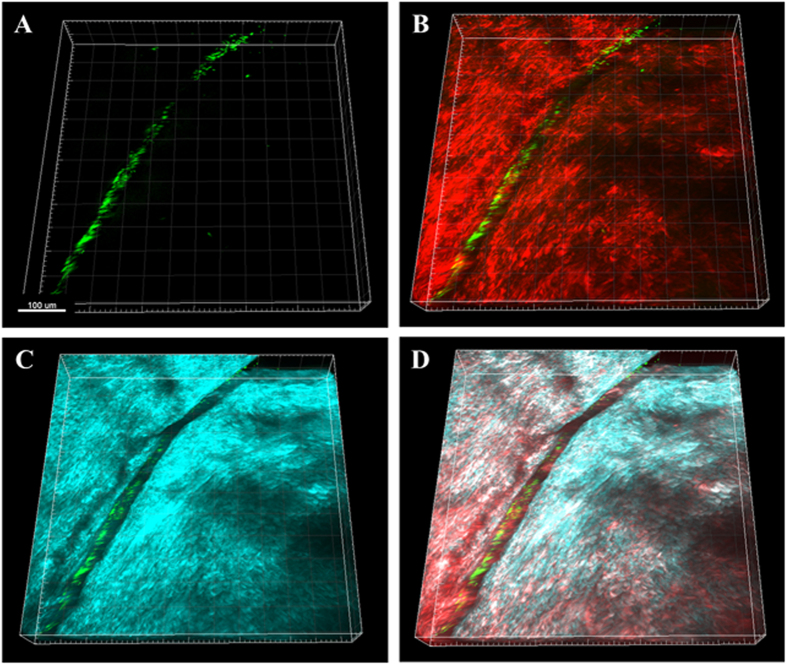
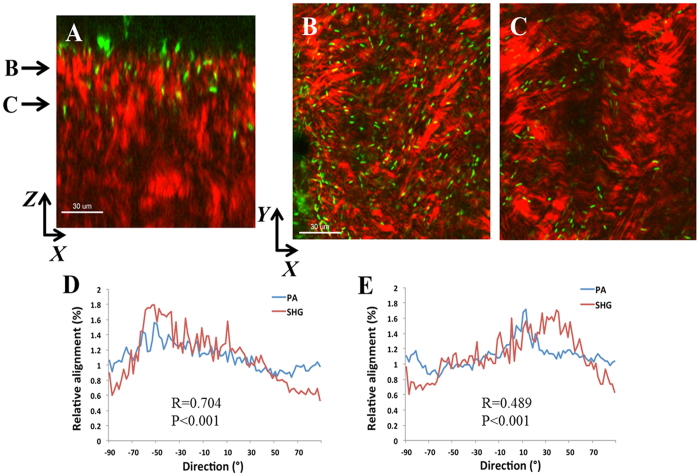
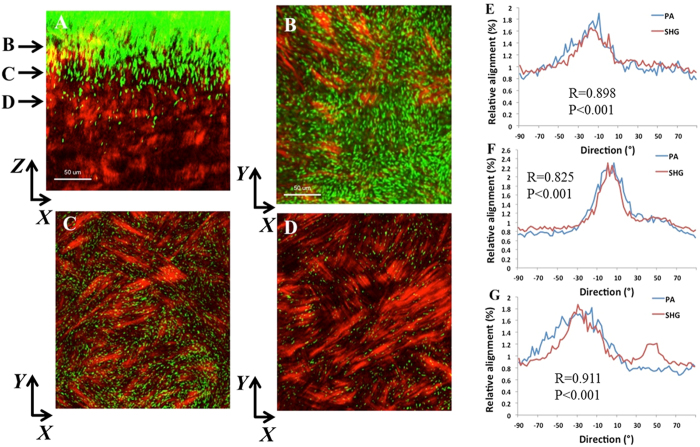
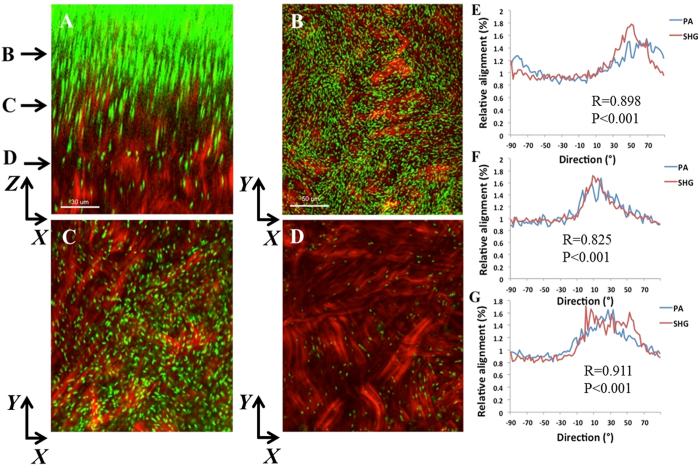
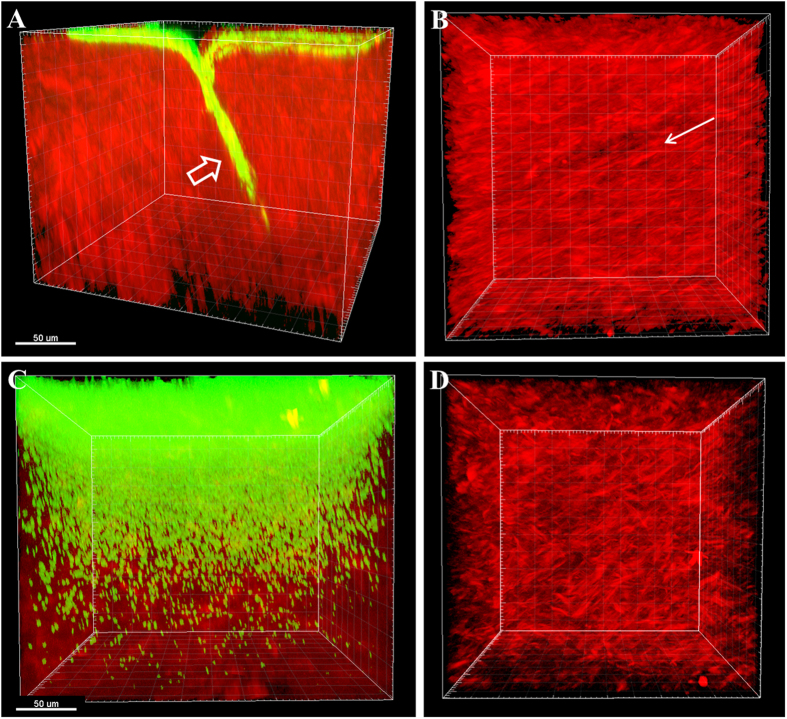
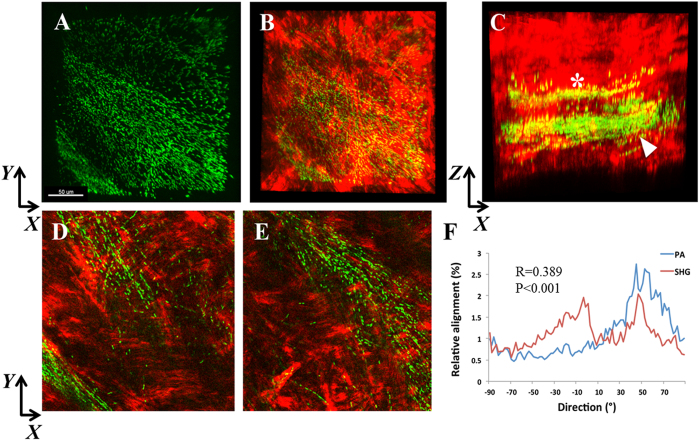
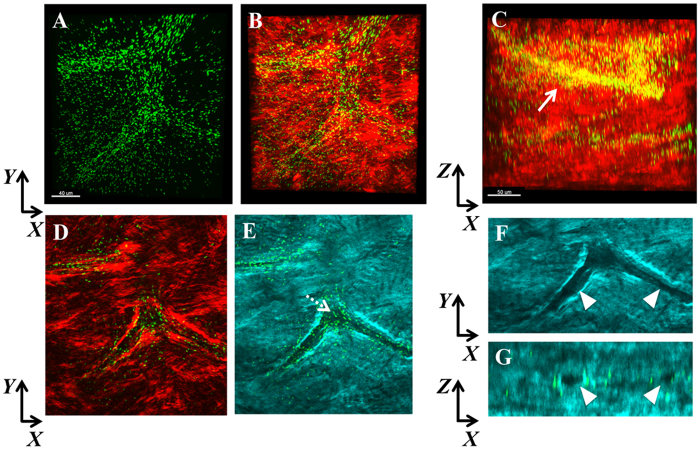
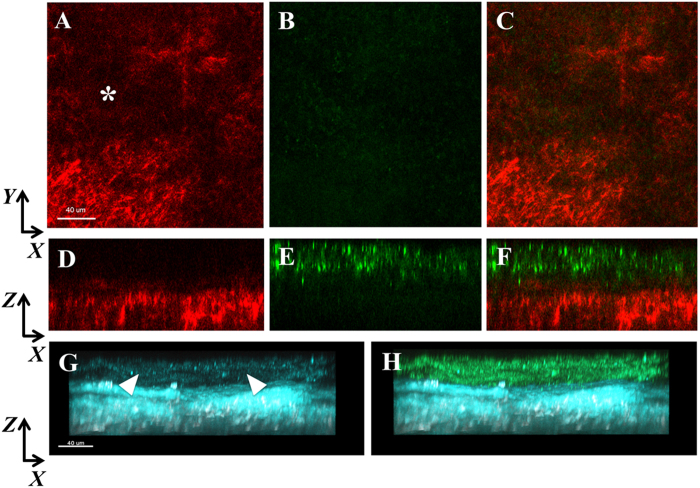
Pseudomonas aeruginosa is a pathogenic gram-negative organism that has the ability to cause blinding corneal infections following trauma and during contact lens wear. In this study, we investigated the directional movement and orientation of an invasive corneal isolate of P. aeruginosa in the corneal stroma during infection of ex vivo and in vivo rabbit corneas using multiphoton fluorescence and second harmonic generation (SHG) imaging. Ex vivo, rabbit corneas were subject to three partial thickness wounds prior to inoculation. In vivo, New Zealand white rabbits were fit with P. aeruginosa laden contact lenses in the absence of a penetrating wound. At all time points tested, infiltration of the corneal stroma by P. aeruginosa revealed a high degree of alignment between the bacteria and collagen lamellae ex vivo (p < 0.001). In vivo, P. aeruginosa traveled throughout the stroma in discrete regions or bands. Within each region, the bacteria showed good alignment with collagen lamellae (P = 0.002). Interestingly, in both the in vitro and in vivo models, P. aeruginosa did not appear to cross the corneal limbus. Taken together, our findings suggest that P. aeruginosa exploits the precise spacing of collagen lamellae in the central cornea to facilitate spread throughout the stroma.


Conflict of interest statement

The authors declare no competing financial interests.

Figures

Figure 1
Figure 1. PA localization in the rabbit cornea 2 hours post-inoculation showing PA localization along the wound margin.
(A) 3-dimensional image showing the distribution of PA (green) in the wounded cornea. (B) 3-dimensional image showing the overlay of PA (green) and the forward SHG signal (red). (C) 3-dimensional image showing the overlay of PA (green) and the backward SHG signal (teal). (D) Combined 3-dimensional image of PA (green), forward SHG signal (red) and backward SHG signal (teal). Images representative of at least 3 repeated experiments. Scale bar: 100 μm.
Figure 2
Figure 2. PA localization and orientation in the rabbit cornea 6 hours post-inoculation.
(A) XZ slice showing depth of penetration at 6 hours between collagen fibrils (forward signal in red, PA in green). Scale bar: 30 μm. (B and C) XY slices that correspond to depth arrows in A showing the linear arrangement of PA (green) along the red collagen lamellae. (D and E) The relationship between the orientation of PA and the collagen fibrils was calculated from the total image (1024 × 1024 pixels). There was a significant correlation in directionality between PA and fibril orientation at all depths, although the correlation was decreased deeper in the stroma due to few bacteria being present (R = 0.704 ± 0.069, P < 0.001 for plane B and R = 0.489 ± 0.059, P < 0.001 for plane C; n = 3 images for each plane). Data representative of at least 3 repeated experiments. Scale bar: 30 μm.
Figure 3
Figure 3. PA localization and orientation in the rabbit cornea 18 hours post-inoculation.
(A) XZ slice showing density of PA and depth of penetration at 24 hours (forward SHG signal in red, PA in green). Scale bar: 50 μm. (BD) XY slices that correspond to depth arrows in A showing the linear arrangement between PA and collagen lamellae. Scale bar: 50 μm. (EG) Relative alignment between PA and collagen fibrils. Results calculated from the total image (1024 × 1024 pixels). There was a significant correlation in directionality at all depths. Three images from each depth plane were analyzed. Results calculated from the total image (1024 × 1024 pixels). (E) R = 0.898 ± 0.075, P < 0.001. (F) R = 0.825 ± 0.017, P < 0.001). (G) R = 0.911 ± 0.006, P < 0.001). Data representative of at least 3 repeated experiments. Scale bar 30 μm.
Figure 4
Figure 4. PA localization and orientation in the rabbit cornea 24 hours post-inoculation.
(A) XZ slice showing density and depth of penetration at 24 hours (forward SHG signal in red, PA in green). Scale bar: 30 μm. (BD) XY slices that correspond to depth arrows in A. Scale bar: 50 μm. (EG) The relative alignment between PA and collagen fibrils. (E) R = 0.782 ± 0.056, P < 0.001; (F) R = 0.739 ± 0.025, P < 0.001; (G) R = 0.870 ± 0.072, P < 0.001). Results calculated from the total image (1024 × 1024 pixels). Three images from each depth plane were analyzed. Data representative of at least 3 repeated experiments.
Figure 5
Figure 5. PA spread through the limbus and central cornea at 48 hours.
(A) 3-dimensional image showing PA invasion into the limbus at the incision site at 48 hours. PA (green) and forward SHG signal (red). PA localized along the apical side of cornea and moved directly in to the wound margin (open arrow). (B) En face image of apical side of cornea showing distribution of PA across the surface of the collagen. Note the linear arrangement of collagen lamellae (arrow). (C) Spread of PA through the corresponding central cornea of the same eye at 48 hours. Massive distribution of PA was seen throughout the stroma. (D) En face image of the apical surface of the stroma without the green channel showing the characteristic crosshatch appearance of the central cornea, as opposed to the linear arrangement of collagen in the limbus (B). Data representative of at least 3 repeated experiments. Scale bar: 50 μm.
Figure 6
Figure 6. SHG imaging of the infected rabbit cornea in vivo.
(A) XY slice showing PA (green) localization within bands of collagen in an apparent linear structure. (B) PA combined with forward SHG signal (red). (C) XZ slice showing the distribution of PA within discrete bands throughout the mid-stromal region. A smaller band (*) was apparent in the mid-stroma, and a larger band (arrowhead) was present more posteriorly. (D) XY slice corresponding to asterisk region in C showing linearized organization of PA. (E) XY slice corresponding to arrowhead region in C showing the linearized organization of PA. Scale bar: 50 μm. (F) Directionality analysis of segmented region (256 × 256 pixels) isolating the areas of banding showed a small, but significant correlation between the relative alignment of PA and collagen fibrils (R = 0.389 ± 0.171, P < 0.001). Depending on the plane depth, R values ranged from 0.209 to 0.668. In areas outside of the yellow banding, no significant correlation was detected. Data representative of 3 independent rabbits.
Figure 7
Figure 7
SHG imaging of the infected rabbit cornea in vivo showing co-localization of PA with what appears to be a stromal nerve. (A) XY slice showing the distribution of PA (green). (B) XY slice showing merged imaged of PA with forward SHG signal (red). Scale bar: 40 μm. (C) Representative XZ slice of merged imaged showing the spatial distribution of PA within the stroma. Scale bar: 50 μm. (D) XY slice showing PA combined with the forward SHG signal at a different depth than in A. (E) XY slice showing PA combined with the backward SHG signal at the corresponding depth as in D. Dotted arrow shows the complete absence of SHG signal. (F) Zoomed image of E without PA showing discrete regions without any backward SHG signal (arrowheads). (G) XZ slice showing discreet circular holes devoid of backward SHG signal that correspond to the regions in (F).
Figure 8
Figure 8. SHG forward signal in a dense infiltrate (corresponds to biomicroscopic image in Supplementary Figure 2C).
(A) XY slice showing deterioration of the collagen SHG forward signal (red, asterisk). (B) No PA (green) was visible corresponding to the forward SHG signal. (C) Merged overlay. (DF) XZ slices of images (AC), respectively showing distinct regions of PA and the forward SHG signal. In areas of dense PA, the forward SHG signal was very weak to non-detectable. (GH) Backward SHG signal (teal) showing loss of signal in apical region (arrowheads). In areas of dense PA, a weak backward SHG is visible. (F) Merged overlay. Scale bar: 40 μm.

Similar articles

Cited by

References

    1. Pachigolla G., Blomquist P. & Cavanagh H. D. Microbial keratitis pathogens and antibiotic susceptibilities: a 5-year review of cases at an urban county hospital in North Texas. Eye & Contact Lens 33, 45–49 (2007). - PubMed
    1. Bourcier T., Thomas F., Borderie V., Chaumeil C. & Laroche L. Bacterial keratitis: predisposing factors, clinical and microbiological review of 300 cases. Br J Ophthalmol 87, 834–838 (2003). - PMC - PubMed
    1. Ormerod L. D. & Smith R. E. Contact lens-associated microbial keratitis. Arch Ophthalmol 104, 79–83 (1986). - PubMed
    1. Schein O. D. et al.. Microbiology of contact lens-related keratitis. Cornea 8, 281–285 (1989). - PubMed
    1. Schein O. D., Glynn R. J., Poggio E. C., Seddon J. M. & Kenyon K. R. The relative risk of ulcerative keratitis among users of daily-wear and extended-wear soft contact lenses. A case-control study. Microbial Keratitis Study Group. N Engl J Med 321, 773–778 (1989). - PubMed

MeSH terms

LinkOut - more resources