

Dynamics of archaea at fine spatial scales in Shark Bay mat microbiomes
- PMID: 28397816
- PMCID: PMC5387419
- DOI: 10.1038/srep46160
Dynamics of archaea at fine spatial scales in Shark Bay mat microbiomes
Abstract
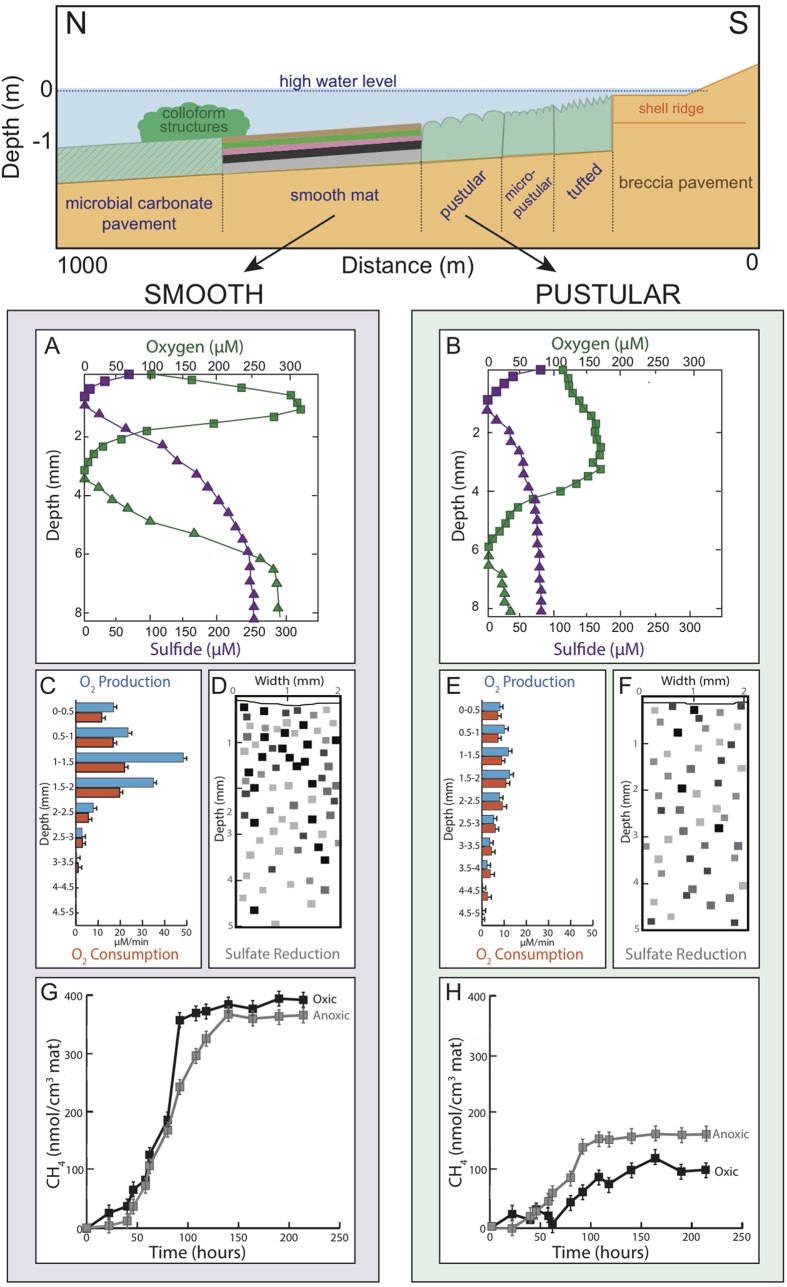
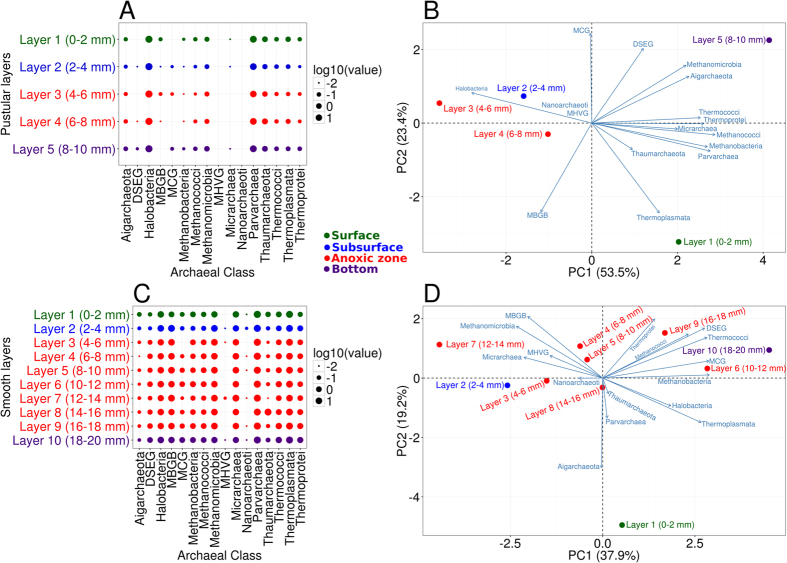
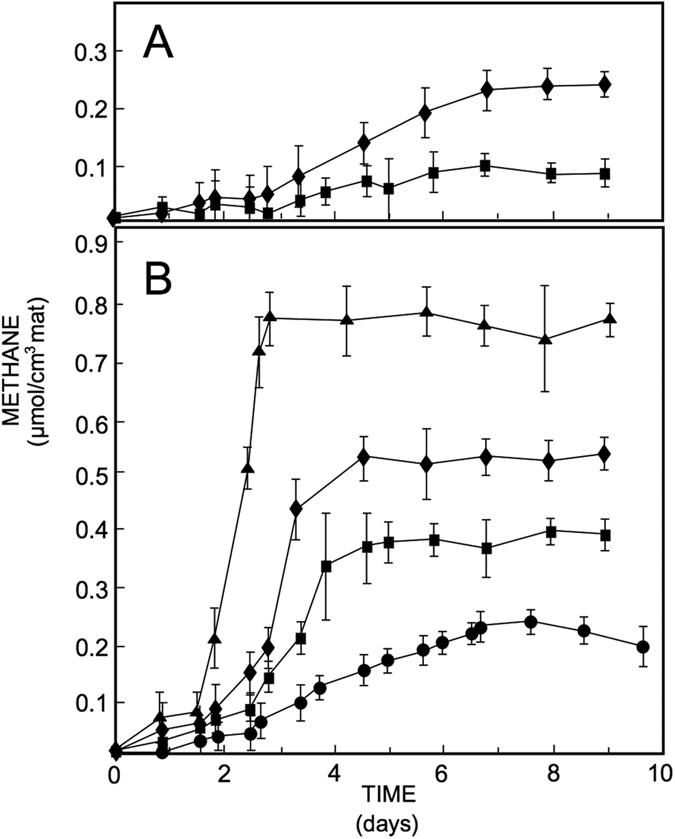
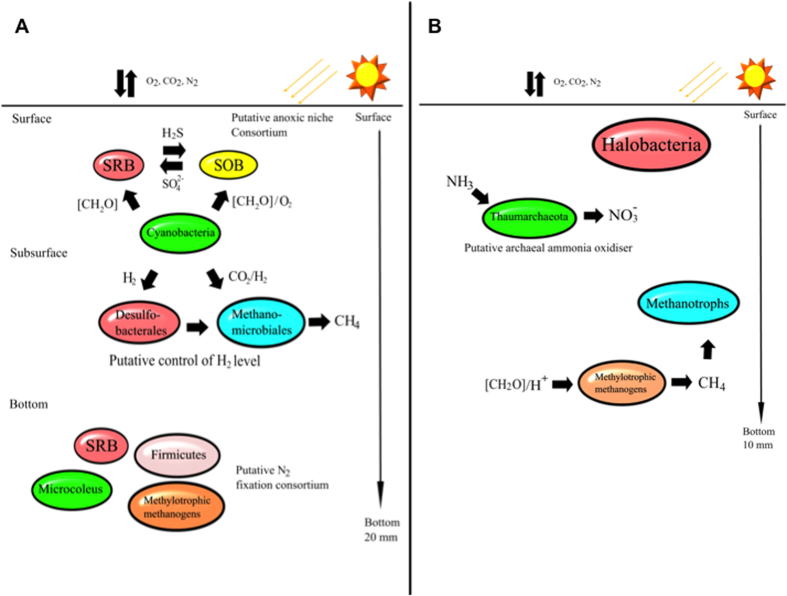
The role of archaea in microbial mats is poorly understood. Delineating the spatial distribution of archaea with mat depth will enable resolution of putative niches in these systems. In the present study, high throughput amplicon sequencing was undertaken in conjunction with analysis of key biogeochemical properties of two mats (smooth and pustular) from Shark Bay, Australia. One-way analysis of similarity tests indicated the archaeal community structures of smooth and pustular mats were significantly different (global R = 1, p = 0.1%). Smooth mats possessed higher archaeal diversity, dominated by Parvarchaeota. The methanogenic community in smooth mats was dominated by hydrogenotrophic Methanomicrobiales, as well as methylotrophic Methanosarcinales, Methanococcales, Methanobacteriales and Methanomassiliicoccaceae. Pustular mats were enriched with Halobacteria and Parvarchaeota. Key metabolisms (bacterial and archaeal) were measured, and the rates of oxygen production/consumption and sulfate reduction were up to four times higher in smooth than in pustular mats. Methane production peaked in the oxic layers and was up to seven-fold higher in smooth than pustular mats. The finding of an abundance of anaerobic methanogens enriched at the surface where oxygen levels were highest, coupled with peak methane production in the oxic zone, suggests putative surface anoxic niches in these microbial mats.
Conflict of interest statement
The authors declare no competing financial interests.
Figures
Similar articles
-
Bacterial and archaeal profiling of hypersaline microbial mats and endoevaporites, under natural conditions and methanogenic microcosm experiments.Extremophiles. 2018 Nov;22(6):903-916. doi: 10.1007/s00792-018-1047-2. Epub 2018 Aug 17. Extremophiles. 2018. PMID: 30120599
-
Niche differentiation of bacterial communities at a millimeter scale in Shark Bay microbial mats.Sci Rep. 2015 Oct 26;5:15607. doi: 10.1038/srep15607. Sci Rep. 2015. PMID: 26499760 Free PMC article.
-
Unravelling core microbial metabolisms in the hypersaline microbial mats of Shark Bay using high-throughput metagenomics.ISME J. 2016 Jan;10(1):183-96. doi: 10.1038/ismej.2015.87. Epub 2015 May 29. ISME J. 2016. PMID: 26023869 Free PMC article.
-
The host-associated archaeome.Nat Rev Microbiol. 2020 Nov;18(11):622-636. doi: 10.1038/s41579-020-0407-y. Epub 2020 Jul 20. Nat Rev Microbiol. 2020. PMID: 32690877 Review.
-
Archaea in symbioses.Archaea. 2012;2012:596846. doi: 10.1155/2012/596846. Epub 2012 Dec 27. Archaea. 2012. PMID: 23326206 Free PMC article. Review.
Cited by
-
Bacterial and archaeal profiling of hypersaline microbial mats and endoevaporites, under natural conditions and methanogenic microcosm experiments.Extremophiles. 2018 Nov;22(6):903-916. doi: 10.1007/s00792-018-1047-2. Epub 2018 Aug 17. Extremophiles. 2018. PMID: 30120599
-
Deciphering the functional and structural complexity of the Solar Lake flat mat microbial benthic communities.mSystems. 2024 Jun 18;9(6):e0009524. doi: 10.1128/msystems.00095-24. Epub 2024 May 10. mSystems. 2024. PMID: 38727215 Free PMC article.
-
The Vulnerability of Microbial Ecosystems in A Changing Climate: Potential Impact in Shark Bay.Life (Basel). 2019 Sep 2;9(3):71. doi: 10.3390/life9030071. Life (Basel). 2019. PMID: 31480795 Free PMC article. Review.
-
Understanding the Mechanisms Behind the Response to Environmental Perturbation in Microbial Mats: A Metagenomic-Network Based Approach.Front Microbiol. 2018 Nov 28;9:2606. doi: 10.3389/fmicb.2018.02606. eCollection 2018. Front Microbiol. 2018. PMID: 30555424 Free PMC article.
-
Perspective on the use of methanogens in lithium recovery from brines.Front Microbiol. 2023 Aug 2;14:1233221. doi: 10.3389/fmicb.2023.1233221. eCollection 2023. Front Microbiol. 2023. PMID: 37601371 Free PMC article.
References
-
- Peeters K. et al.. Heterotrophic bacterial diversity in aquatic microbial mat communities from Antartica. Polar. Biol. 35, 543–554 (2012).
Publication types
MeSH terms
Substances
LinkOut - more resources
Full Text Sources
Other Literature Sources
