. 2017 Apr 11:7:46143.
doi: 10.1038/srep46143.

Cardiac kinematic parameters computed from video of in situ beating heart

Affiliations

Cardiac kinematic parameters computed from video of in situ beating heart

Lorenzo Fassina et al. Sci Rep. .

Abstract

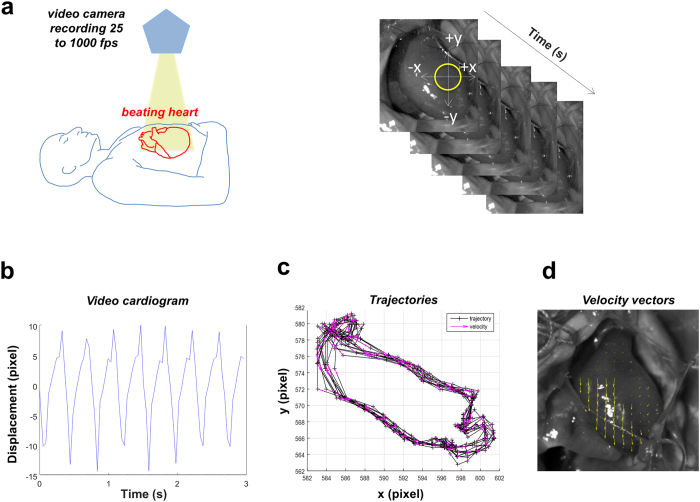
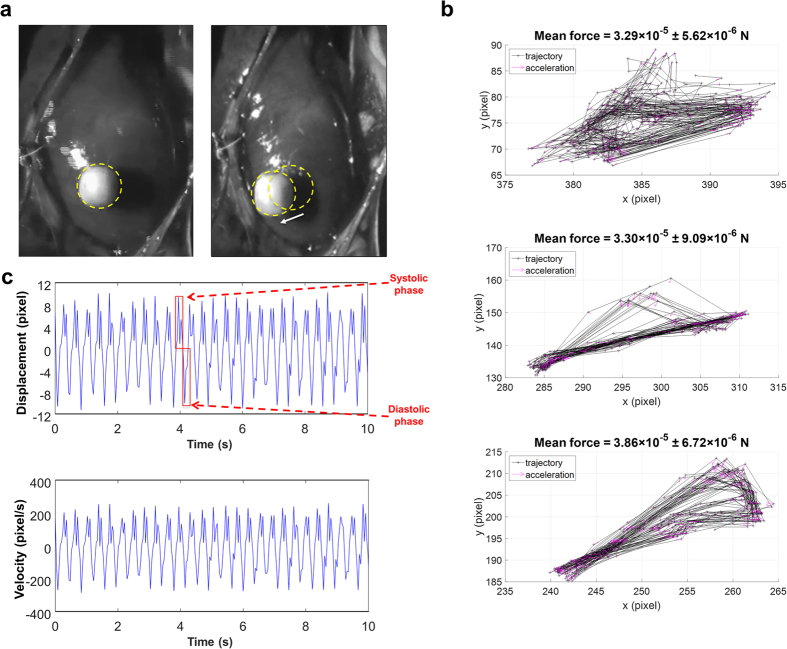
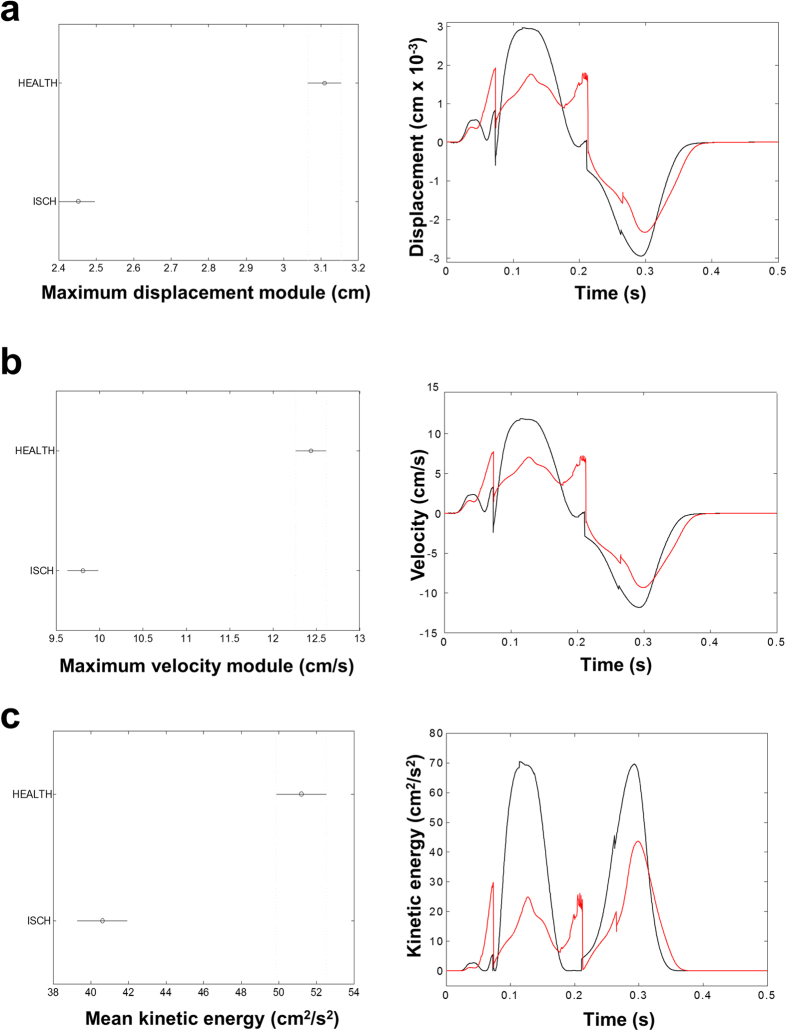
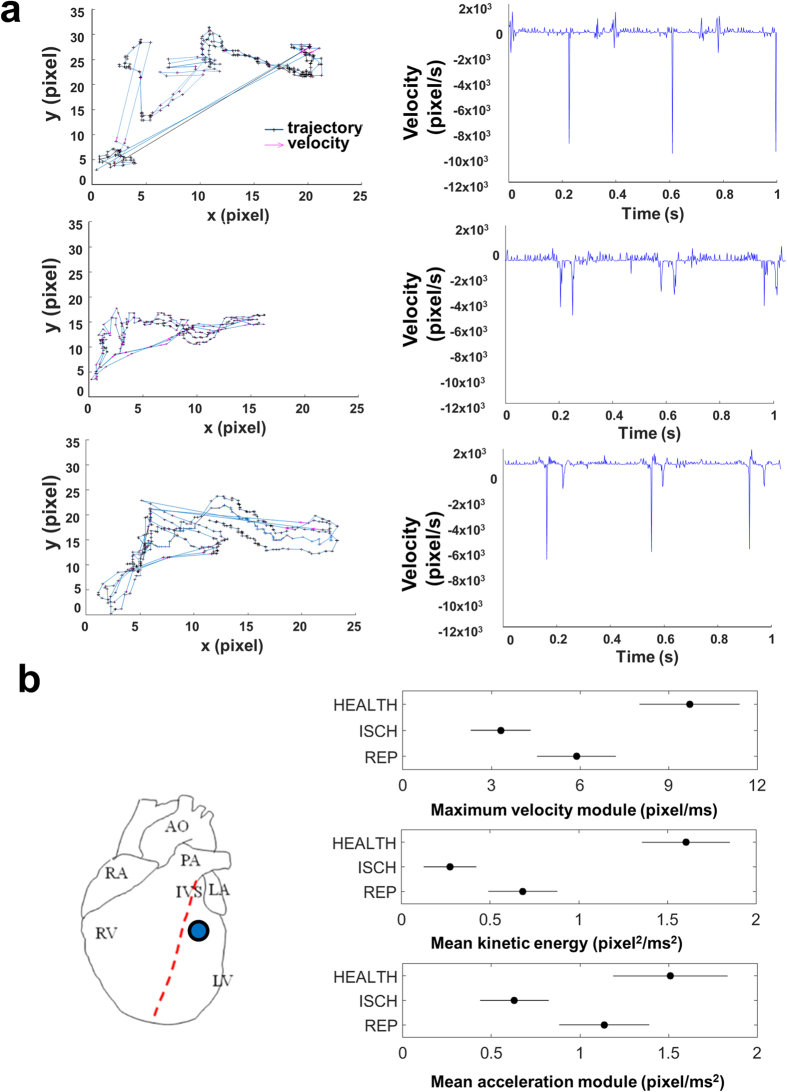
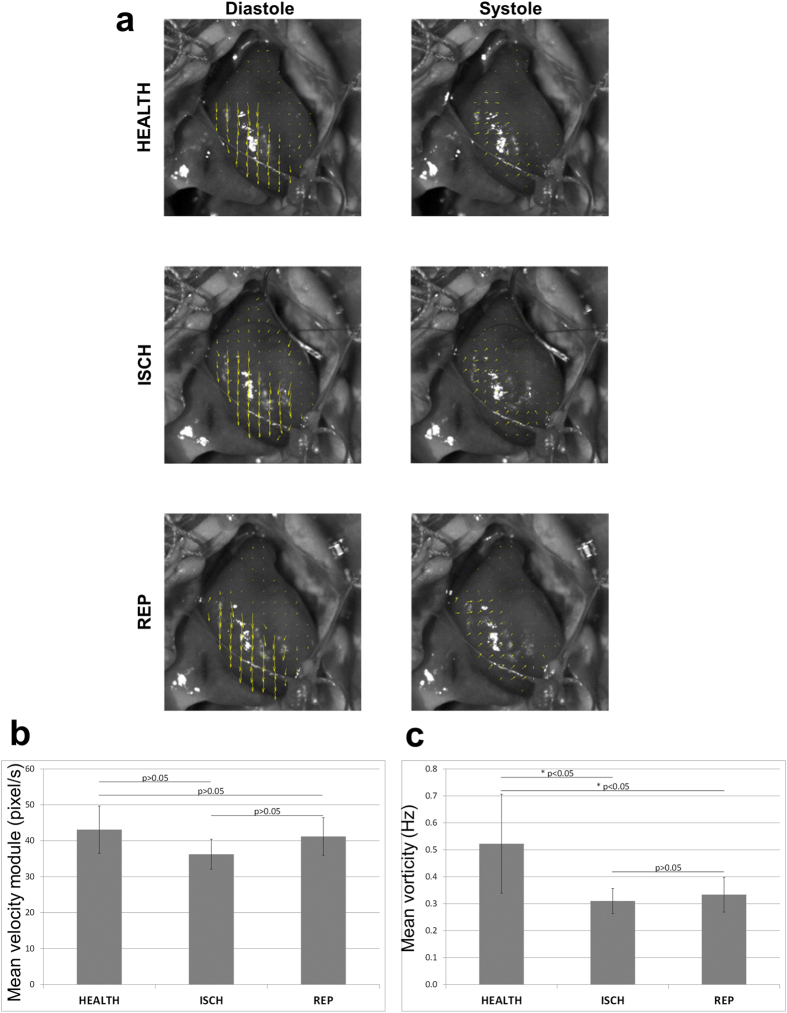
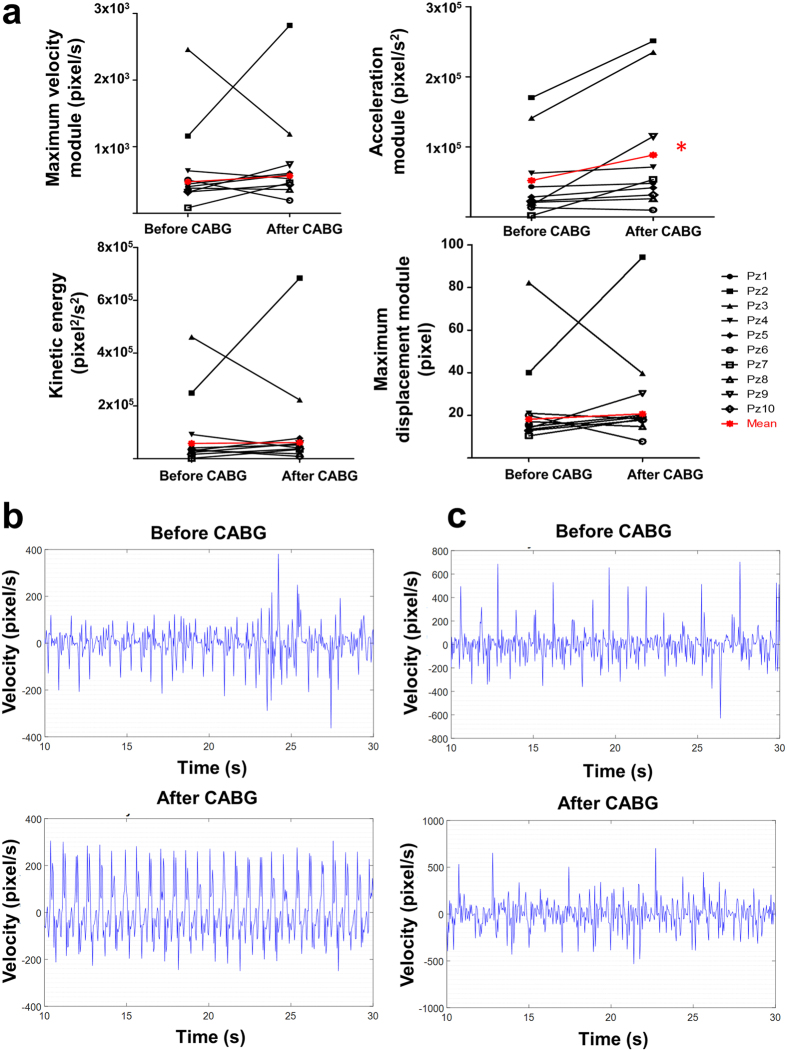
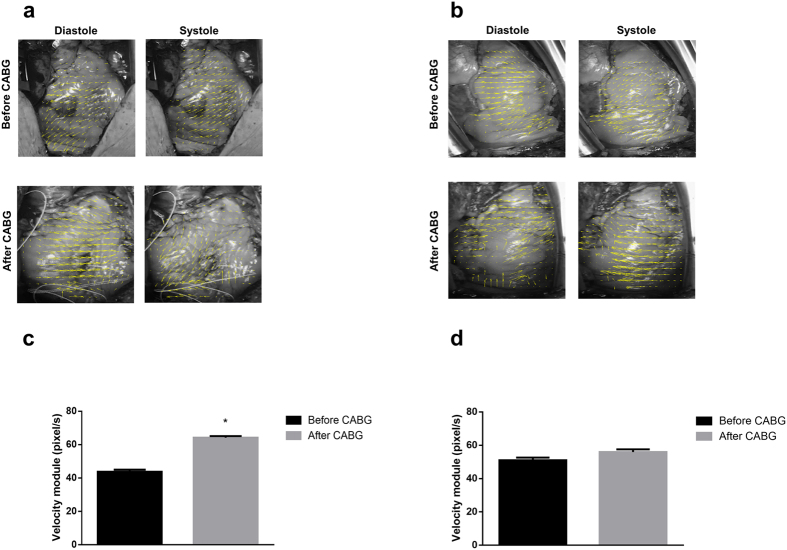
Mechanical function of the heart during open-chest cardiac surgery is exclusively monitored by echocardiographic techniques. However, little is known about local kinematics, particularly for the reperfused regions after ischemic events. We report a novel imaging modality, which extracts local and global kinematic parameters from videos of in situ beating hearts, displaying live video cardiograms of the contraction events. A custom algorithm tracked the movement of a video marker positioned ad hoc onto a selected area and analyzed, during the entire recording, the contraction trajectory, displacement, velocity, acceleration, kinetic energy and force. Moreover, global epicardial velocity and vorticity were analyzed by means of Particle Image Velocimetry tool. We validated our new technique by i) computational modeling of cardiac ischemia, ii) video recordings of ischemic/reperfused rat hearts, iii) videos of beating human hearts before and after coronary artery bypass graft, and iv) local Frank-Starling effect. In rats, we observed a decrement of kinematic parameters during acute ischemia and a significant increment in the same region after reperfusion. We detected similar behavior in operated patients. This modality adds important functional values on cardiac outcomes and supports the intervention in a contact-free and non-invasive mode. Moreover, it does not require particular operator-dependent skills.


Conflict of interest statement

The authors declare no competing financial interests.

Figures

Figure 1
Figure 1. Workflow with video camera positioning, video recording and evaluation of the systolic and diastolic phases.
(a) Left. Schematic representation of the camera positioned using an articulating arm on top of the open chest. The authors drew the scheme. Right. Sequence of video frames captured at 500 fps from a beating heart with the video marker (yellow circle) ‘anchored’ to the cardiac tissue while moving in x-y directions. (b) Video cardiogram (ViCG) showing the displacement of a selected video marker with contraction/relaxation peaks and peak-to-peak intervals. (c) Counterclockwise trajectories of contraction (left to right) and relaxation (right to left) for every cardiac cycle with related velocity vectors (pink arrows). The graph shows a typical overlapping in the x-y movements of the selected video marker. (d) Particle Image Velocimetry (PIV) showing the velocity vectors (yellow arrows) of the beating cardiac tissue.
Figure 2
Figure 2. Validation of contraction force measured with a known spherical mass anchored onto the epicardial surface.
(a) Position of the spherical mass at the start of systole (left) and at the start of diastole (right) with the related displacement vector (white arrow) between the two preceding moments. (b) Trajectory and acceleration of the mass in three different rat hearts with the mean contraction force (N) during the observation period (10 s). Data are expressed as mean ± SEM. (c) Video cardiograms of displacement vs. time (top) and of velocity vs. time (bottom). Systolic and diastolic phases are underlined in red.
Figure 3
Figure 3. Simulation of kinematics in ischemic heart.
(a) Left. Maximum displacement module, as defined in Table 1, in marker trajectories (frame distance = 0.25 ms), which was averaged across 48 healthy (HEALTH) and 48 ischemic (ISCH) sites. The horizontal bars are the 95% confidence intervals for the differences between means according to one-way ANOVA and LSD (Least Significant Difference) post hoc test. There is a statistically significant difference between the means with non-overlapping bars (p < 0.05). Right. Time evolution of the displacement of a single sample site; comparison between healthy (black) and ischemic (red) site. (b) Same as (a) for the maximum velocity module. (c) Same as (a) for the mean kinetic energy.
Figure 4
Figure 4. Kinematic parameters and ViCGs obtained by using a high-speed video camera during ischemia/reperfusion protocol in rats.
(a) Left column. Trajectories and velocities measured from a 1-s recording at 500 fps during ischemia/reperfusion protocol. Top: healthy tissue. Middle: ischemic tissue, 6 min after coronary ligation. Bottom: reperfused tissue, 6 min after reperfusion. Right column. Video cardiogram of velocity vs. time in the three conditions: healthy (top), ischemic (middle) and reperfused (bottom) tissue. (b) Left. Representative video marker position (blue circle) on a schematic rat heart. A video marker with a radius of 20 pixel was selected onto the tissue underneath the coronary ligation. Right. Top. Maximum velocity module measured in healthy (HEALTH), ischemic (ISCH) and reperfused (REP) tissue. Middle. Same for mean kinetic energy. Bottom. Same for mean acceleration module. See the text for statistical significances. The horizontal bars are the 95% confidence intervals for the differences between means according to one-way ANOVA and LSD (Least Significant Difference) post hoc test. There is a statistically significant difference between the means with non-overlapping bars (p < 0.05). n = 6.
Figure 5
Figure 5. Particle Image Velocimetry (PIV) analysis in ischemic/reperfused rat hearts.
(a) PIV showing the velocity vectors for a rat heart as example in diastole (left column) and in systole (right column) for the HEALTH, ISCH and REP conditions. (b) Velocity module calculated by PIV analysis in the three aforementioned conditions. (c) Same as (b) for vorticity. The p-value was *p < 0.05, calculated from Student’s t test (paired). n = 6.
Figure 6
Figure 6. Kinematic parameters and video cardiograms in patients underwent coronary artery bypass graft (CABG).
(a) Top. Maximum velocity module and acceleration module measured by using a low-speed video camera. Bottom. Same for kinetic energy and maximum displacement module. (b) Video cardiogram (velocity vs. time) for the patient #1 before (top) and after (bottom) CABG. (c) Same as (b) for patient #3.
Figure 7
Figure 7. Particle Image Velocimetry (PIV) analysis in CABG patients.
(a) PIV analysis for patient #1 before (top) and after (bottom) CABG for the diastolic (left) and systolic (right) phases. (b) Same as (a) for patient #3. (c) Velocity module calculated by PIV analysis for patient #1 before and after CABG (*p < 0.05). (d) Same as (c) for patient #3. Calculated from one-way ANOVA, LSD post hoc test. n = 1,732 video frames for patient #1 and n = 992 video frames for patient #3.

References

    1. Luciani G. B. et al.. Severe ischemic left ventricular failure: coronary operation or heart transplantation? The Annals of thoracic surgery 55, 719–723 (1993). - PubMed
    1. Wong S. C. & Leon M. B. Intracoronary stents. Current opinion in cardiology 10, 404–411 (1995). - PubMed
    1. Weintraub W. S. et al.. Comparative effectiveness of revascularization strategies. The New England journal of medicine 366, 1467–1476, doi: 10.1056/NEJMoa1110717 (2012). - DOI - PMC - PubMed
    1. Sipahi I., Akay M. H., Dagdelen S., Blitz A. & Alhan C. Coronary artery bypass grafting vs percutaneous coronary intervention and long-term mortality and morbidity in multivessel disease: meta-analysis of randomized clinical trials of the arterial grafting and stenting era. JAMA internal medicine 174, 223–230, doi: 10.1001/jamainternmed.2013.12844 (2014). - DOI - PubMed
    1. Danad I., Fayad Z. A., Willemink M. J. & Min J. K. New Applications of Cardiac Computed Tomography: Dual-Energy, Spectral, and Molecular CT Imaging. JACC. Cardiovascular imaging 8, 710–723, doi: 10.1016/j.jcmg.2015.03.005 (2015). - DOI - PMC - PubMed

Publication types

LinkOut - more resources