

Cellular Microbiaxial Stretching to Measure a Single-Cell Strain Energy Density Function
- PMID: 28397957
- PMCID: PMC5467040
- DOI: 10.1115/1.4036440
Cellular Microbiaxial Stretching to Measure a Single-Cell Strain Energy Density Function
Abstract
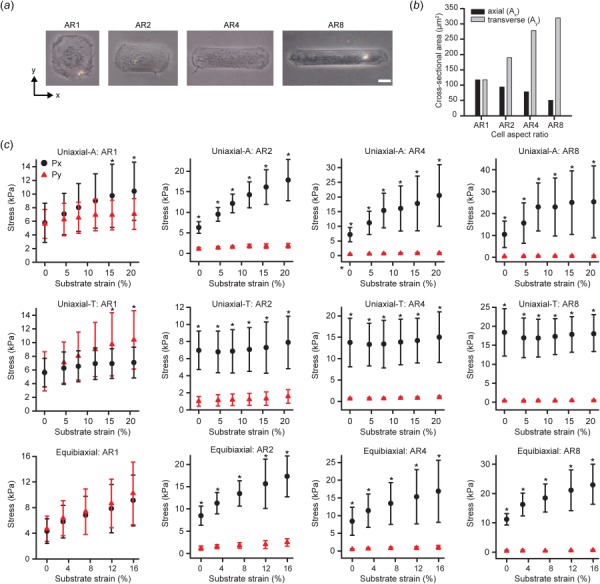
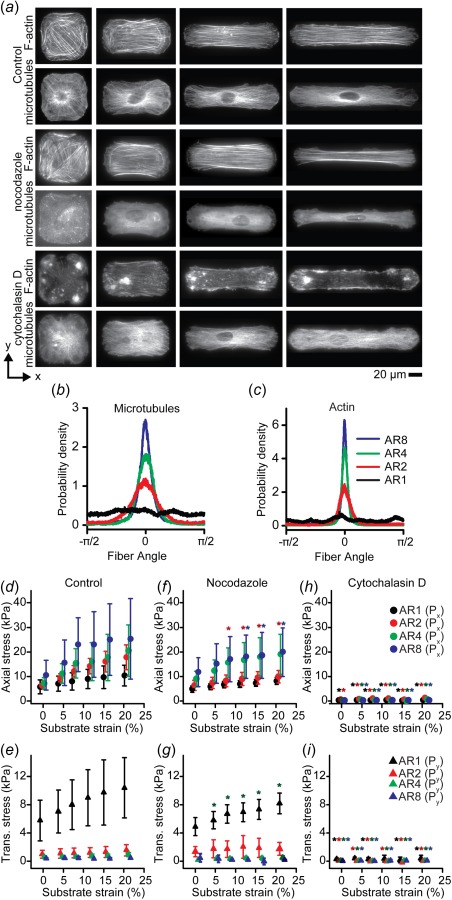
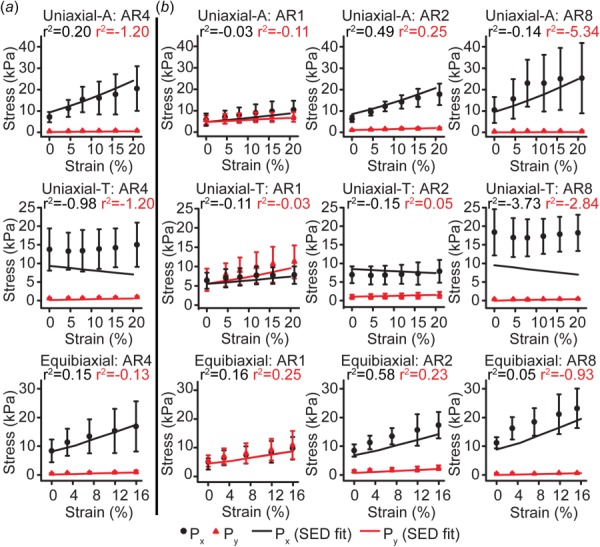
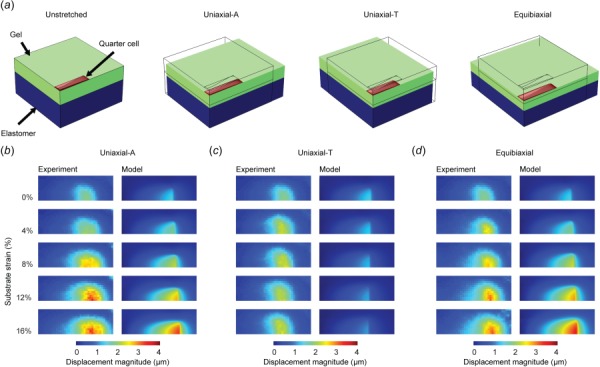
The stress in a cell due to extracellular mechanical stimulus is determined by its mechanical properties, and the structural organization of many adherent cells suggests that their properties are anisotropic. This anisotropy may significantly influence the cells' mechanotransductive response to complex loads, and has important implications for development of accurate models of tissue biomechanics. Standard methods for measuring cellular mechanics report linear moduli that cannot capture large-deformation anisotropic properties, which in a continuum mechanics framework are best described by a strain energy density function (SED). In tissues, the SED is most robustly measured using biaxial testing. Here, we describe a cellular microbiaxial stretching (CμBS) method that modifies this tissue-scale approach to measure the anisotropic elastic behavior of individual vascular smooth muscle cells (VSMCs) with nativelike cytoarchitecture. Using CμBS, we reveal that VSMCs are highly anisotropic under large deformations. We then characterize a Holzapfel-Gasser-Ogden type SED for individual VSMCs and find that architecture-dependent properties of the cells can be robustly described using a formulation solely based on the organization of their actin cytoskeleton. These results suggest that cellular anisotropy should be considered when developing biomechanical models, and could play an important role in cellular mechano-adaptation.
Figures
Similar articles
-
Large-deformation strain energy density function for vascular smooth muscle cells.J Biomech. 2020 Oct 9;111:110005. doi: 10.1016/j.jbiomech.2020.110005. Epub 2020 Aug 28. J Biomech. 2020. PMID: 32911443
-
Cellular Microbiaxial Stretching Assay for Measurement and Characterization of the Anisotropic Mechanical Properties of Micropatterned Cells.Curr Protoc. 2022 Feb;2(2):e370. doi: 10.1002/cpz1.370. Curr Protoc. 2022. PMID: 35195953
-
Architecture-Dependent Mechano-Adaptation in Single Vascular Smooth Muscle Cells.J Biomech Eng. 2021 Oct 1;143(10):101002. doi: 10.1115/1.4051117. J Biomech Eng. 2021. PMID: 33972987
-
Tensile properties of vascular smooth muscle cells: bridging vascular and cellular biomechanics.J Biomech. 2012 Mar 15;45(5):745-55. doi: 10.1016/j.jbiomech.2011.11.014. Epub 2011 Dec 15. J Biomech. 2012. PMID: 22177671 Review.
-
Molecular basis of the effects of mechanical stretch on vascular smooth muscle cells.J Biomech. 2007;40(5):947-60. doi: 10.1016/j.jbiomech.2006.04.011. Epub 2006 Jul 25. J Biomech. 2007. PMID: 16867303 Review.
Cited by
-
A computational bridge between traction force microscopy and tissue contraction.J Appl Phys. 2023 Aug 21;134(7):074901. doi: 10.1063/5.0157507. Epub 2023 Aug 15. J Appl Phys. 2023. PMID: 37593660 Free PMC article.
-
Bimodal sensing of guidance cues in mechanically distinct microenvironments.Nat Commun. 2018 Nov 20;9(1):4891. doi: 10.1038/s41467-018-07290-y. Nat Commun. 2018. PMID: 30459308 Free PMC article.
-
Orientation of neurites influences severity of mechanically induced tau pathology.Biophys J. 2021 Aug 17;120(16):3272-3282. doi: 10.1016/j.bpj.2021.07.011. Epub 2021 Jul 20. Biophys J. 2021. PMID: 34293301 Free PMC article.
-
A structural bio-chemo-mechanical model for vascular smooth muscle cell traction force microscopy.Biomech Model Mechanobiol. 2023 Aug;22(4):1221-1238. doi: 10.1007/s10237-023-01713-6. Epub 2023 Apr 1. Biomech Model Mechanobiol. 2023. PMID: 37004657 Free PMC article.
-
A Graphical Approach to Visualize and Interpret Biochemically Coupled Biomechanical Models.J Biomech Eng. 2024 May 1;146(5):054504. doi: 10.1115/1.4064970. J Biomech Eng. 2024. PMID: 38421368 Free PMC article.
References
-
- Trepat, X. , Wasserman, M. R. , Angelini, T. E. , Millet, E. , Weitz, D. A. , Butler, J. P. , and Fredberg, J. J. , 2009, “ Physical Forces During Collective Cell Migration,” Nat. Phys., 5(6), pp. 426–430.10.1038/nphys1269 - DOI
MeSH terms
LinkOut - more resources
Full Text Sources
Other Literature Sources
