

doi: 10.1038/nbt.3772.
Toil enables reproducible, open source, big biomedical data analyses
Affiliations
- PMID: 28398314
- PMCID: PMC5546205
- DOI: 10.1038/nbt.3772
Item in Clipboard
Toil enables reproducible, open source, big biomedical data analyses
Nat Biotechnol.
.
No abstract available
Conflict of interest statement
The authors declare competing financial interests: details are available in the online version of the paper.
Figures
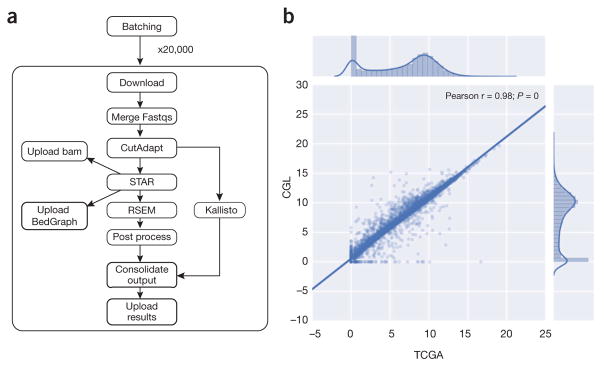
RNA-seq pipeline and expression concordance. (a) A dependency graph
of the RNA-seq pipeline we developed (named CGL). CutAdapt was used to remove
extraneous adapters, STAR was used for alignment and read coverage, and RSEM and
Kallisto were used to produce quantification data. (b) Scatter plot
showing the Pearson correlation between the results of the TCGA best-practices
pipeline and the CGL pipeline. 10,000 randomly selected sample and/or gene pairs
were subset from the entire TCGA cohort and the normalized counts were plot
against each other; this process was repeated five times with no change in
Pearson correlation. The unit for counts is:
log2(norm_counts+1).
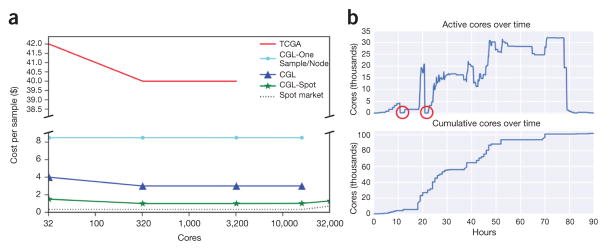
Costs and core usage. (a) Scaling tests were run to ascertain the
price per sample at varying cluster sizes for the different analysis methods.
TCGA (red) shows the cost of running the TCGA best-practices pipeline as
re-implemented as a Toil workflow (for comparison). CGL-One-Sample/Node (cyan)
shows the cost of running the revised Toil pipeline, one sample per node. CGL
(blue) denotes the pipeline running samples across many nodes. CGL-Spot (green)
is the same as CGL, but denotes the pipeline run on the Amazon spot market. The
slight rise in cost per sample at 32,000 cores was due to a couple of factors:
aggressive instance provisioning directly affected the spot price (dotted line),
and saving bam and bedGraph files for each
sample. (b) Tracking number of cores during the recompute. The two
red circles indicate where all worker nodes were terminated and subsequently
restarted shortly thereafter.
References
-
- Zhang J, et al. Database. 2011 http://dx.doi.org/10.1093/database/bar026. - DOI - PubMed
-
- Siva N. Lancet. 2015;385:103–104. - PubMed
-
- UNC Bioinformatics. TCGA mRNA-seq pipeline for UNC data. 2013 https://webshare.bioinf.unc.edu/public/mRNAseq_TCGA/UNC_mRNAseq_summary.pdf.
Publication types
MeSH terms
Grants and funding
LinkOut - more resources
Full Text Sources
Other Literature Sources
