. 2017 Jun 20;45(11):6388-6403.
doi: 10.1093/nar/gkx234.

MLL3/MLL4 are required for CBP/p300 binding on enhancers and super-enhancer formation in brown adipogenesis

Affiliations

MLL3/MLL4 are required for CBP/p300 binding on enhancers and super-enhancer formation in brown adipogenesis

Binbin Lai et al. Nucleic Acids Res. .

Abstract

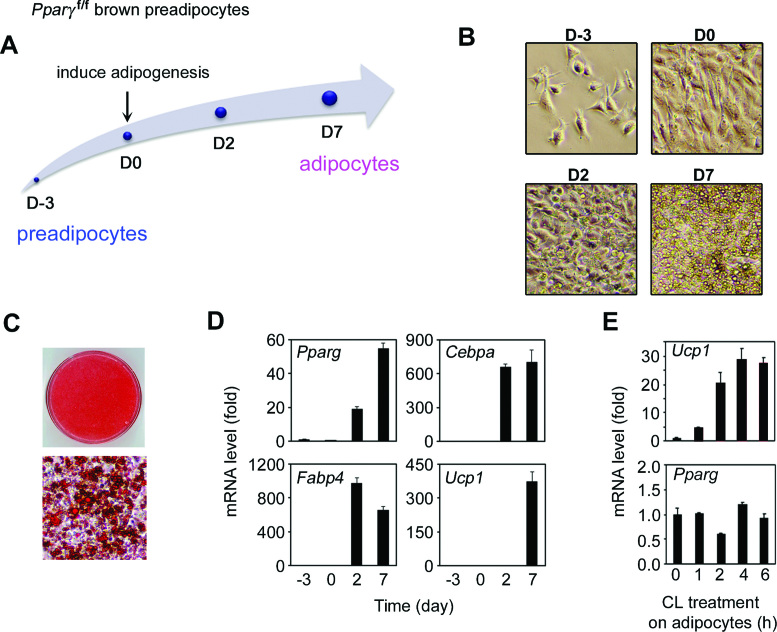
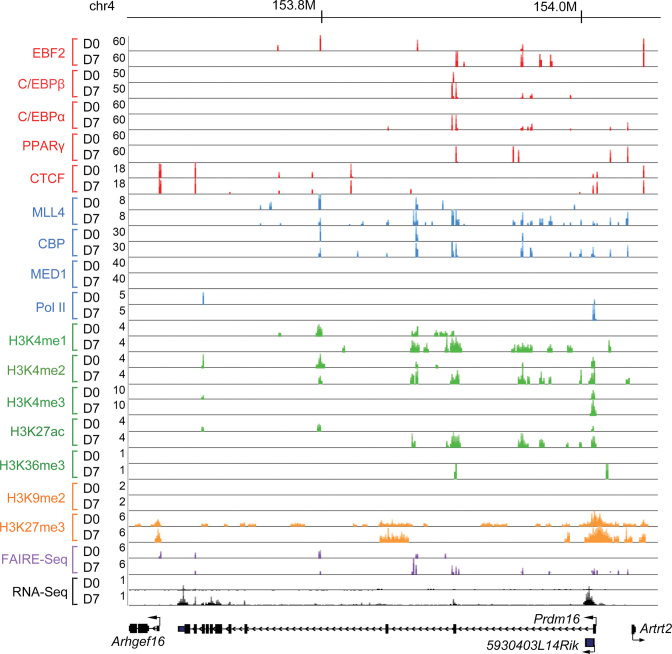
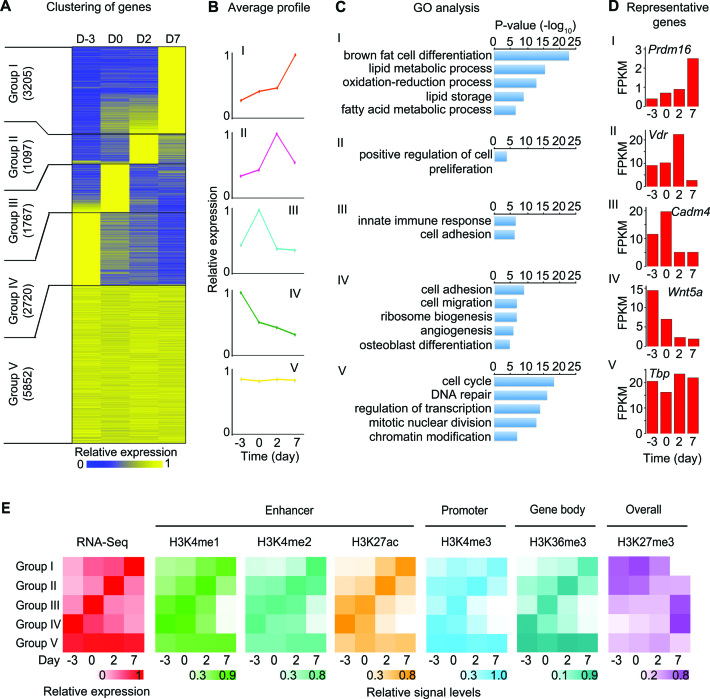
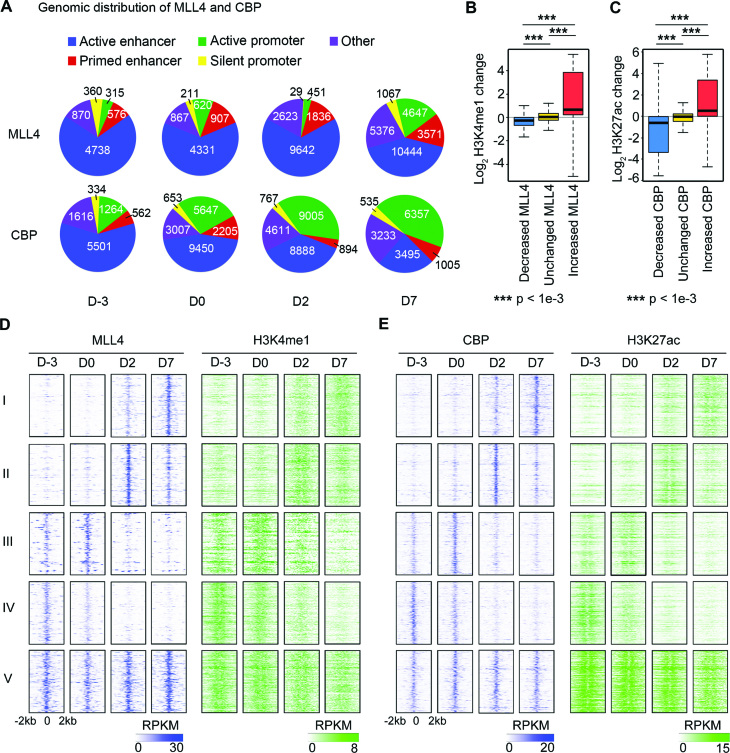
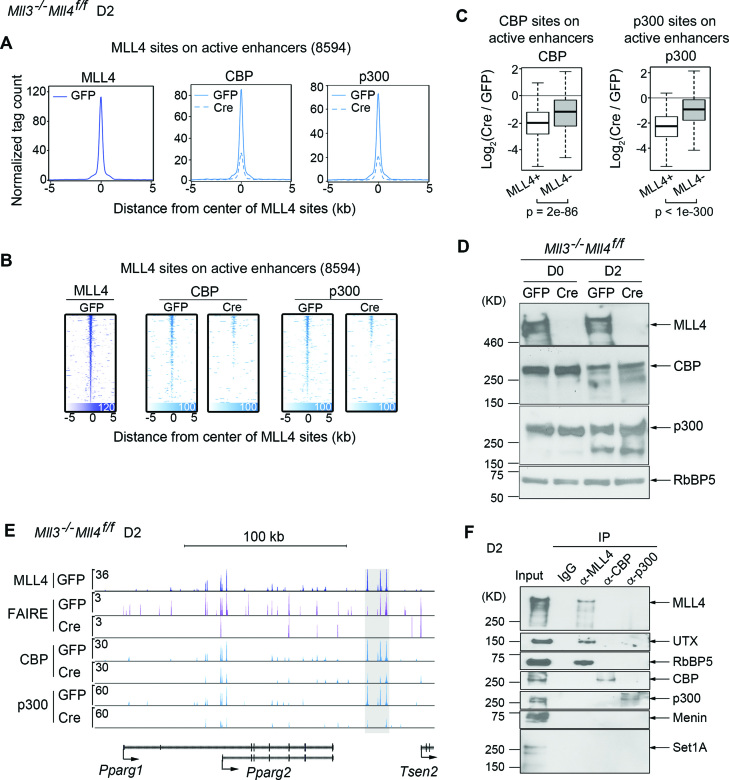
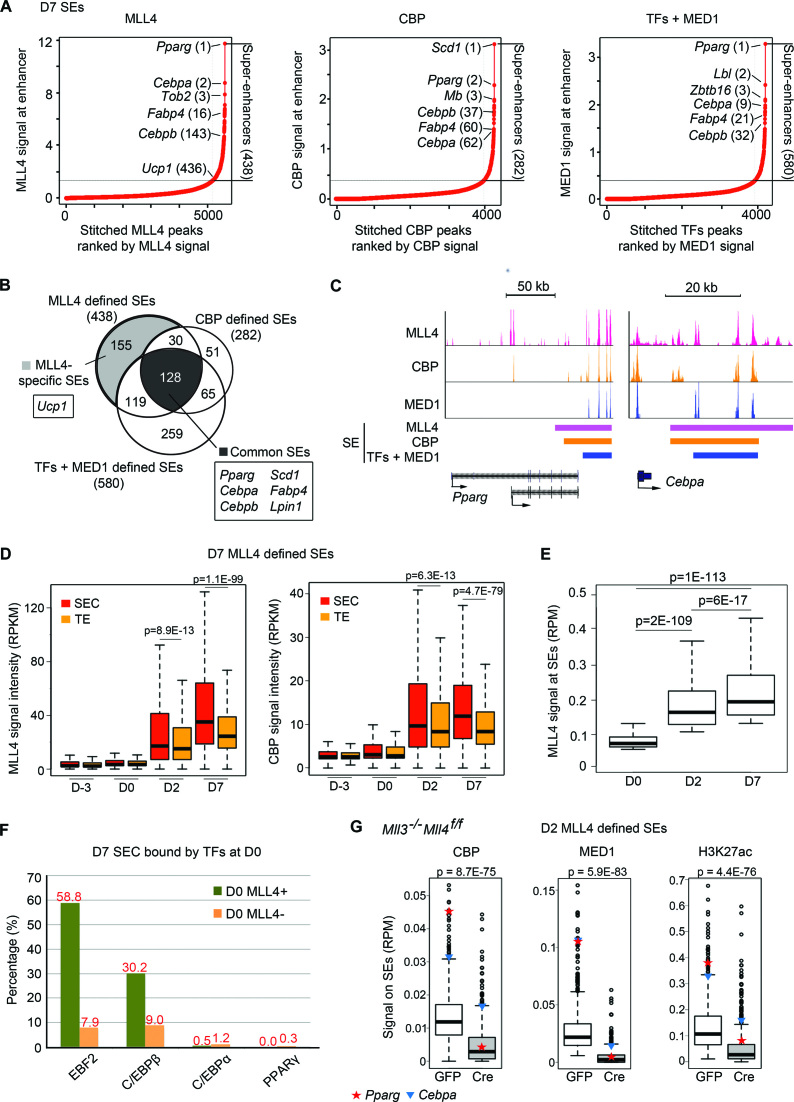
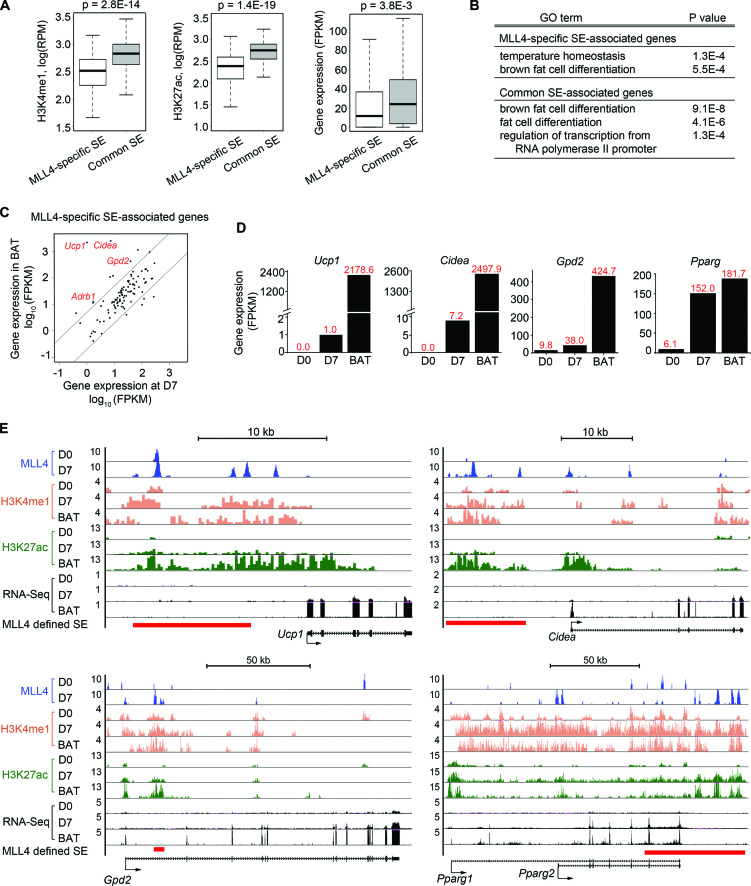
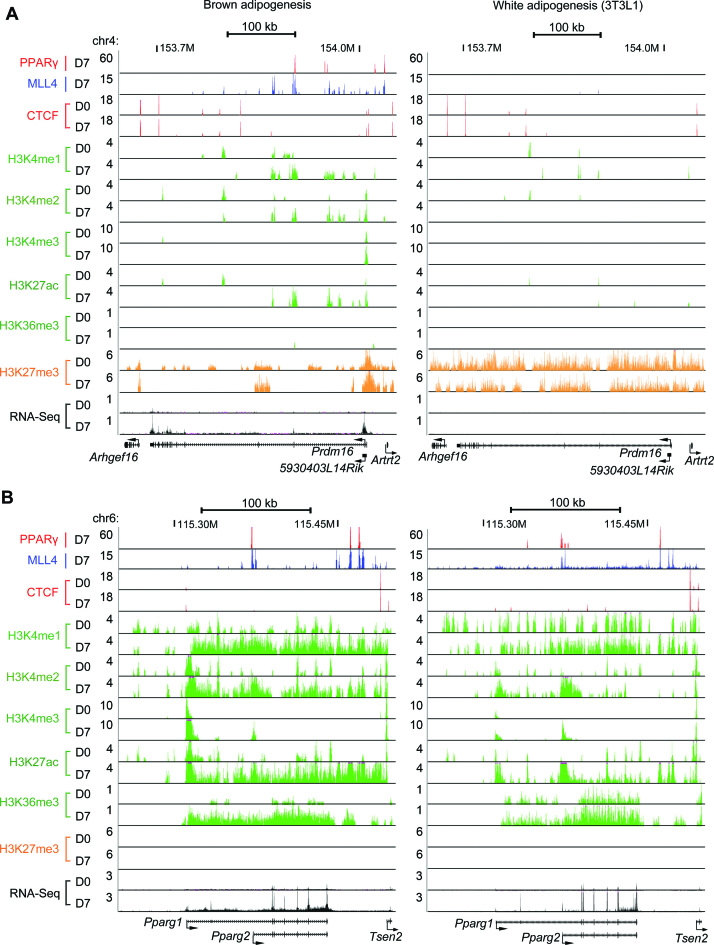
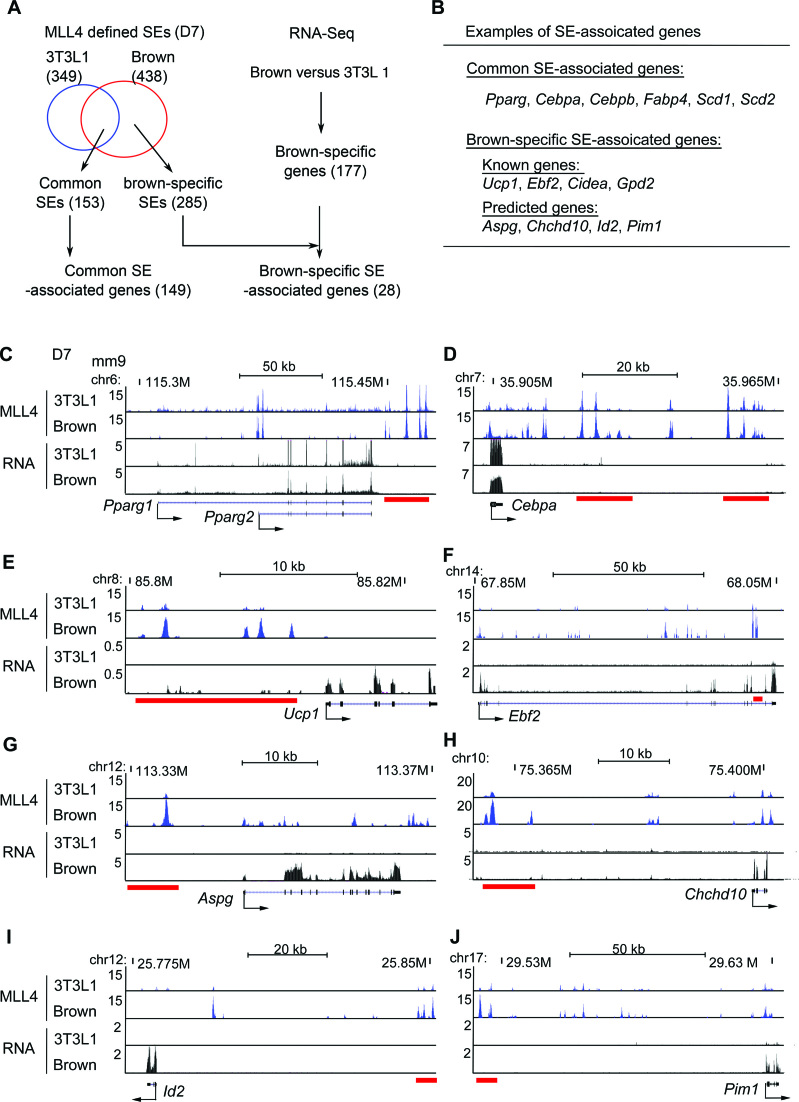
Histone H3K4me1/2 methyltransferases MLL3/MLL4 and H3K27 acetyltransferases CBP/p300 are major enhancer epigenomic writers. To understand how these epigenomic writers orchestrate enhancer landscapes in cell differentiation, we have profiled genomic binding of MLL4, CBP, lineage-determining transcription factors (EBF2, C/EBPβ, C/EBPα, PPARγ), coactivator MED1, RNA polymerase II, as well as epigenome (H3K4me1/2/3, H3K9me2, H3K27me3, H3K36me3, H3K27ac), transcriptome and chromatin opening during adipogenesis of immortalized preadipocytes derived from mouse brown adipose tissue (BAT). We show that MLL4 and CBP drive the dynamic enhancer epigenome, which correlates with the dynamic transcriptome. MLL3/MLL4 are required for CBP/p300 binding on enhancers activated during adipogenesis. Further, MLL4 and CBP identify super-enhancers (SEs) of adipogenesis and that MLL3/MLL4 are required for SE formation. Finally, in brown adipocytes differentiated in culture, MLL4 identifies primed SEs of genes fully activated in BAT such as Ucp1. Comparison of MLL4-defined SEs in brown and white adipogenesis identifies brown-specific SE-associated genes that could be involved in BAT functions. These results establish MLL3/MLL4 and CBP/p300 as master enhancer epigenomic writers and suggest that enhancer-priming by MLL3/MLL4 followed by enhancer-activation by CBP/p300 sequentially shape dynamic enhancer landscapes during cell differentiation. Our data also provide a rich resource for understanding epigenomic regulation of brown adipogenesis.


Figures

Figure 1.
Figure 1.
Characterization of immortalized brown preadipocytes derived from BAT. (A) Schematic of the adipogenesis assay. (B) Cell morphology under microscope. (C) Oil Red O staining of differentiated cells 7 days after inducing adipogenesis. (D) qRT-PCR analysis of gene expression at indicated time points of adipogenesis. (E) qRT-PCR analysis of Ucp1 and Pparg gene expression in fully differentiated adipocytes (D7, day 7) that were treated with 100 nM CL-316 243 for up to 6 h.
Figure 2.
Figure 2.
Genome browser view of the Prdm16 locus before and after brown adipogenesis. ChIP-Seq, FAIRE-Seq and RNA-Seq data at the Prdm16 locus before (D0) and after (D7) adipogenesis of brown preadipocytes are shown. D0, day 0; D7, day 7.
Figure 3.
Figure 3.
Dynamic enhancer epigenome correlates with the dynamic transcriptome during adipogenesis. (A–D) Characterization of the dynamic transcriptome. Genes are clustered according to their dynamic expression pattern during adipogenesis. (A) Heat map of clustered gene expression during adipogenesis. The number of genes in each group is indicated. (B) Temporal profile of average relative expression levels for each group of genes. (C) Gene ontology (GO) analysis of each group of genes. (D) Expression levels of a representative gene for each gene group during adipogenesis. (E) Dynamic epigenome correlates well with the dynamic transcriptome during adipogenesis. Shown are heat maps of average gene expression levels determined by RNA-Seq, H3K4me1/2 and H3K27ac levels on enhancers, H3K4me3 levels on promoters, H3K36me3 levels over gene bodies and overall (gene body, promoter and distal region) H3K27me3 levels for the five groups of genes during adipogenesis.
Figure 4.
Figure 4.
MLL4 and CBP drive the dynamic enhancer epigenome in adipogenesis. Only MLL4 and CBP binding sites within enhancers are included. (A) Genomic distribution of MLL4 and CBP binding in adipogenesis. (B and C) Relationship between changes in MLL4 (B) or CBP (C) binding intensity and their respective histone modification levels. MLL4 and CBP sites were classified into three groups according to their changes in binding intensity between neighboring time points: decreased, unchanged and increased (see Supplementary Figure S2A for details). (D and E) MLL4 and CBP drive the dynamics of their respective histone modifications on enhancers. Only MLL4/CBP binding sites corresponding to the most enriched temporal pattern for each group were included when generating the heat maps. The enrichment of temporal MLL4/CBP binding patterns is shown in Supplementary Figure S2B. (D) Heat maps of MLL4 and H3K4me1 on enhancer MLL4 binding sites. (E) Heat maps of CBP and H3K27ac on enhancer CBP binding sites.
Figure 5.
Figure 5.
MLL3/MLL4 are required for CBP/p300 binding on enhancers activated in adipogenesis. Mll3−/−Mll4f/f brown preadipocytes were infected with adenoviral GFP or Cre as described (5). Cells were collected at D2 of adipogenesis for ChIP-Seq of CBP and p300. Cells were collected at D0 and D2 of adipogenesis for western blot analysis of MLL4, CBP and p300. (A–C) MLL3/MLL4 facilitate CBP/p300 binding on active enhancers at D2. (A) Aggregated profiles. (B) Heat maps. (C) Deletion of Mll4 causes more severe impairment of CBP/p300 binding at MLL4+ than at MLL4 CBP/p300 sites on active enhancers. (D) Western blot analysis of MLL4, CBP and p300 at D0 and D2. RbBP5 serves as the loading control. (E) Genome browser view of enhancers (highlighted in gray) around the Pparg locus, where the deletion of Mll3/Mll4 resulted in decreases of CBP and p300 binding at D2. (F) MLL4 physically interacts with UTX and RbBP5 but not CBP/p300 during adipogenesis. Nuclear extracts of cells collected at D2 of adipogenesis were incubated with MLL4, CBP or p300 antibody. Immunoprecipitates were analyzed by western blot using antibodies indicated on the right.
Figure 6.
Figure 6.
MLL4 identifies and is required for super-enhancer (SE) formation in adipogenesis. (A–C) MLL4 and CBP identify SEs in D7 brown adipocytes. (A) D7 SEs identified using MLL4, CBP or TFs + MED1 (29). (B) Venn diagram showing the overlaps between three groups of SEs identified in (A). Representative genes associated with MLL4-specific and common SEs are indicated. (C) SEs on Pparg and Cebpa loci. SE regions identified by each approach are indicated by color bars. (D) MLL4 and CBP are preferentially enriched on SE constituents (SECs). MLL4 and CBP signal levels are shown for SECs and typical enhancers (TEs) from D-3 to D7. SEs were identified using MLL4 in D7 brown adipocytes. See Supplementary Figure S5 for results on SEs identified using CBP or TFs + MED1. (E) MLL4 signal intensities on SEs increase from D0 to D7. SEs are defined by MLL4 at each time point. (F) D7 SECs pre-marked by MLL4 at D0 are enriched with the binding of EBF2 and C/EBPβ but not C/EBPα and PPARγ. (G) Deletion of Mll4 from Mll3 KO preadipocytes severely decreases CBP, MED1 and H3K27ac levels at SEs identified by MLL4 in D2 cells. D2 SEs were identified by MLL4 as shown in Supplementary Figure S7. The signal levels on SEs of Pparg (red star) and Cebpa (blue triangle) are indicated.
Figure 7.
Figure 7.
MLL4 identifies primed SEs of BAT-selective genes Ucp1, Cidea and Gpd2 in brown adipocytes differentiated in culture. (A) MLL4-specific SEs show lower levels of H3K4me1, H3K27ac and expression levels of SE-associated genes than common SEs do. Significance was determined using Mann–Whitney test. (B) GO analysis of MLL4-specific and common SE-associated genes. (C) Comparison of MLL4-specific SE-associated gene expression in D7 brown adipocytes and in BAT. Data were obtained by RNA-Seq. (D) Expression levels of BAT-selective genes (Ucp1, Cidea and Gpd2) and Pparg in preadipocytes (D0) and adipocytes (D7) during brown adipogenesis and in BAT. (E) Genome browser views of MLL4 binding, H3K4me1 and H3K27ac levels, and RNA-Seq at Ucp1, Cidea, Gpd2 and Pparg loci. Red bars underneath the genome browser tracks indicate MLL4-defined SE regions.
Figure 8.
Figure 8.
Comparative epigenomic profiling of brown and white adipogenesis on Prdm16 and Pparg loci. ChIP-Seq and RNA-Seq data on Prdm16(A) and Pparg(B) loci before (D0) and after (D7) adipogenesis of brown preadipocytes (left) and 3T3L1 white preadipocytes (right) are shown.
Figure 9.
Figure 9.
Identification of brown-specific SE-associated genes. (A) Flowchart of identifying common and brown-specific SE-associated genes. (B) Examples of common and brown-specific SE-associated genes. See Supplementary Table S4 for the full list. (C–J) Genome browser views of MLL4 ChIP-Seq and RNA-Seq data at D7 of adipogenesis of 3T3L1 and brown preadipocytes on selected SE-associated genes. Red bars underneath the genome browser tracks indicate MLL4-defined SE regions in brown adipocytes. (C–D) Common SE-associated genes Pparg and Cebpa are shown. (E–J) Brown-specific SE-associated genes Ucp1, Ebf2, Aspg, Chchd10, Id2 and Pim1 are shown.

Similar articles

Cited by

References

    1. Heinz S., Romanoski C.E., Benner C., Glass C.K.. The selection and function of cell type-specific enhancers. Na.t Rev. Mol. Cell Biol. 2015; 16:144–154. - PMC - PubMed
    1. Heintzman N.D., Stuart R.K., Hon G., Fu Y., Ching C.W., Hawkins R.D., Barrera L.O., Van Calcar S., Qu C., Ching K.A. et al. . Distinct and predictive chromatin signatures of transcriptional promoters and enhancers in the human genome. Nat. Genet. 2007; 39:311–318. - PubMed
    1. Calo E., Wysocka J.. Modification of enhancer chromatin: what, how, and why?. Mol. Cell. 2013; 49:825–837. - PMC - PubMed
    1. Creyghton M.P., Cheng A.W., Welstead G.G., Kooistra T., Carey B.W., Steine E.J., Hanna J., Lodato M.A., Frampton G.M., Sharp P.A. et al. . Histone H3K27ac separates active from poised enhancers and predicts developmental state. Proc. Natl. Acad. Sci. U.S.A. 2010; 107:21931–21936. - PMC - PubMed
    1. Lee J.E., Wang C., Xu S., Cho Y.W., Wang L., Feng X., Baldridge A., Sartorelli V., Zhuang L., Peng W. et al. . H3K4 mono- and di-methyltransferase MLL4 is required for enhancer activation during cell differentiation. Elife. 2013; 2:e01503. - PMC - PubMed