. 2017 Jul 1;158(7):2190-2199.
doi: 10.1210/en.2017-00051.

Skeletal Muscle PGC1α -1 Nucleosome Position and -260 nt DNA Methylation Determine Exercise Response and Prevent Ectopic Lipid Accumulation in Men

Affiliations

Skeletal Muscle PGC1α -1 Nucleosome Position and -260 nt DNA Methylation Determine Exercise Response and Prevent Ectopic Lipid Accumulation in Men

Sudip Bajpeyi et al. Endocrinology. .

Abstract

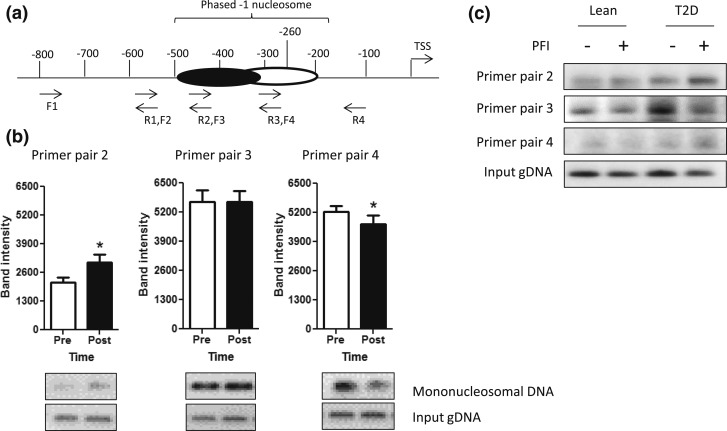
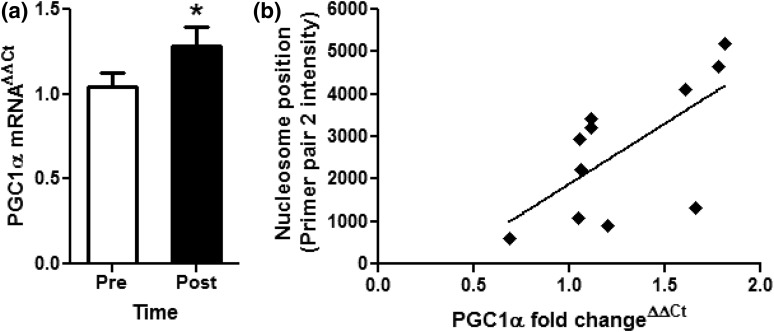
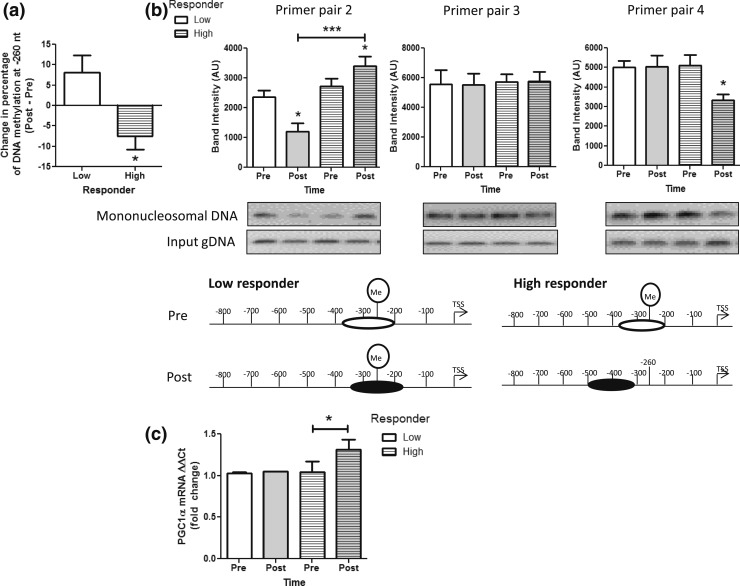
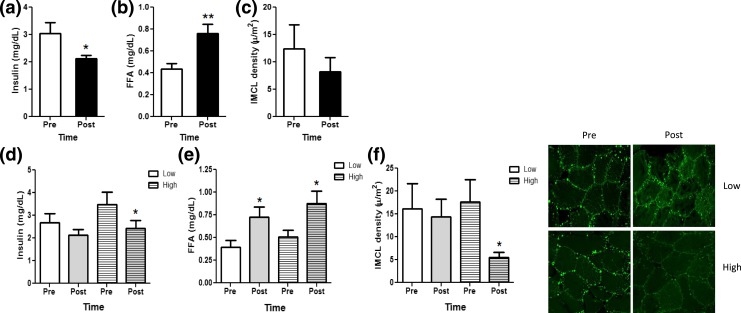
Endurance exercise has been shown to improve lipid oxidation and increase mitochondrial content in skeletal muscle, two features that have shown dependence on increased expression of the peroxisome proliferator-activated receptor-γ coactivator 1α (PGC1α). It is also hypothesized that exercise-related alterations in PGC1α expression occur through epigenetic regulation of nucleosome positioning in association with differential DNA methylation status within the PGC1α promoter. In this study, we show that when primary human myotubes from obese patients with type 2 diabetes are exposed to lipolytic stimulus (palmitate, forskolin, inomycin) in vitro, nucleosome occupancy surrounding the -260 nucleotide (nt) region, a known regulatory DNA methylation site, is reduced. This finding is reproduced in vivo in the vastus lateralis from 11 healthy males after a single, long endurance exercise bout in which participants expended 650 kcal. Additionally, we show a significant positive correlation between fold change of PGC1α messenger RNA expression and -1 nucleosome repositioning away from the -260 nt methylation site in skeletal muscle tissue following exercise. Finally, we found that when exercise participants are divided into high and low responders based on the -260 nt methylation status, the -1 nucleosome is repositioned away from the regulatory -260 nt methylation site in high responders, those exhibiting a significant decrease in -260 nt methylation, but not in low responders. Additionally, high but not low responders showed a significant decrease in intramyocellular lipid content after exercise. These findings suggest a potential target for epigenetic modification of the PGC1α promoter to stimulate the therapeutic effects of endurance exercise in skeletal muscle.


Figures

Figure 1.
Figure 1.
PGC1α −1 N position in lean and diabetic primary myotubes and in skeletal muscle before and after acute endurance exercise. (a) Nucleosome position was determined via scanning PCR, using four overlapping primer pairs that spanned the PGC1α promoter from approximately the −100 nt to approximately the −800 nt. A phased −1 N was found to be present from approximately the −200 to −500 nt and is depicted. (b) Densitometry of scanning PCR results are shown as the mean ± standard error of the mean for primer pairs in which the phased −1 N was present in the PGC1α promoter (primer pairs 2, 3, and 4) in skeletal muscle samples before (Pre; open bars) and immediately after (Post; filled bars) an acute exercise bout. Representative gel images are shown below each graph. *P < 0.05. (c) Scanning PCR results from primer pairs 2, 3, and 4 are shown in myotubes isolated from lean or T2D individuals with or without the exercise mimetic PFI. F, forward; gDNA, genomic DNA; R, reverse.
Figure 2.
Figure 2.
Fold change of PGC1α gene expression and DNA methylation. (a) qRT-CPR was performed to measure fold change of PGC1α expression in skeletal muscle sample before (Pre; open bar) and immediately after (Post; filled bar) exercise. Results are as the mean ± standard error of the mean fold change using the ΔΔCt method. *P < 0.05. (b) Correlation analysis was performed between mRNA expression of PGC1α and after primer pair 2 intensity measured via scanning PCR. PGC1α expression was positively correlated with nucleosome occupancy in the primer pair 2 region of the PGC1α promoter region, indicating repositioning of the −1 N farther upstream of the TSS in samples with higher PGC1α expression.
Figure 3.
Figure 3.
High vs low DNA methylation responders. (a) The −260 nt DNA methylation levels in the PGC1α promoter were determined by pyrosequencing and the change in methylation levels from pre-exercise to post-exercise were determined. Participants in the acute exercise bout showing no change or an increase in methylation were considered low responders (clear). Participants with a decrease in PGC1α −260 nt DNA methylation were considered high responders (striped). (b) Scanning PCR was performed in the promoter region of PGC1α in low (clear) and high responders (striped bars) before (Pre; white bars) and immediately after exercise (Post; gray bars), and densitometry results are shown for primer pairs 2, 3, and 4 [see Fig. 1(a)]. Representative gel images and a schematic of approximate positions of the −1 N within the PGC1α promoter are depicted below the scanning PCR result graphs for each condition. (c) PGC1α mRNA expression was determined by qRT-PCR in skeletal muscle samples from low (clear) and high responders (striped) before (Pre; white) and immediately after exercise (Post; gray). All data are presented as mean ± standard error of the mean. *P < 0.05; ***P < 0.001. gDNA, genomic DNA.
Figure 4.
Figure 4.
PGC1α-related gene expression in high vs low DNA methylation responders. (a) PPARα and (b) PDK4 mRNA expression was determined by qRT-PCR in skeletal muscle samples from low (clear bars) and high responders (striped bars) both before (Pre; white bars) and immediately after exercise (Post; gray bars). All data are presented as mean ± standard error of the mean. *P < 0.05; **P < 0.01.
Figure 5.
Figure 5.
Whole-body and IMCL responses to acute endurance exercise. (a) Serum insulin, (b) FFAs, and (c) skeletal muscle IMCL content were measured before (Pre; open bars) and immediately after (Post; filled bars) an acute exercise bout. (d) Serum insulin, (e) FFA, and (f) skeletal muscle IMCL content were determined also in low (clear bars) vs high (striped bars) responders before (Pre; white bars) and after (Post; gray bars) an acute exercise bout, and representative immunohistochemical images are shown. All data are shown as mean ± standard error of the mean. *P < 0.05; **P < 0.01.

Comment in

References

    1. Galgani JE, Johannsen NM, Bajpeyi S, Costford SR, Zhang Z, Gupta AK, Ravussin E. Role of skeletal muscle mitochondrial density on exercise-stimulated lipid oxidation. Obesity (Silver Spring). 2012;20(7):1387–1393. - PMC - PubMed
    1. Wu Z, Puigserver P, Andersson U, Zhang C, Adelmant G, Mootha V, Troy A, Cinti S, Lowell B, Scarpulla RC, Spiegelman BM. Mechanisms controlling mitochondrial biogenesis and respiration through the thermogenic coactivator PGC-1. Cell. 1999;98(1):115–124. - PubMed
    1. Dudley KJ, Sloboda DM, Connor KL, Beltrand J, Vickers MH. Offspring of mothers fed a high fat diet display hepatic cell cycle inhibition and associated changes in gene expression and DNA methylation. PLoS One. 2011;6(7):e21662. - PMC - PubMed
    1. Gallou-Kabani C, Junien C. Nutritional epigenomics of metabolic syndrome: new perspective against the epidemic. Diabetes. 2005;54(7):1899–1906. - PubMed
    1. Surwit RS, Kuhn CM, Cochrane C, McCubbin JA, Feinglos MN. Diet-induced type II diabetes in C57BL/6J mice. Diabetes. 1988;37(9):1163–1167. - PubMed

Publication types

MeSH terms

Substances