. 2017 Apr;7(3):152-171.
doi: 10.1089/brain.2016.0475.

FMRI Clustering in AFNI: False-Positive Rates Redux

Affiliations

FMRI Clustering in AFNI: False-Positive Rates Redux

Robert W Cox et al. Brain Connect. 2017 Apr.

Abstract

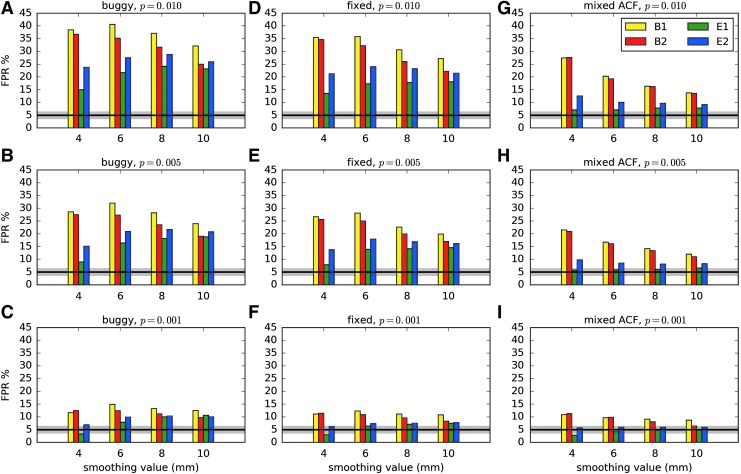
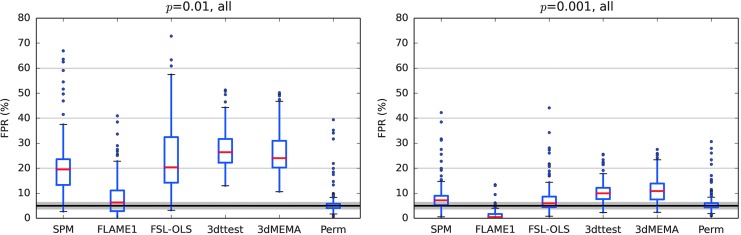
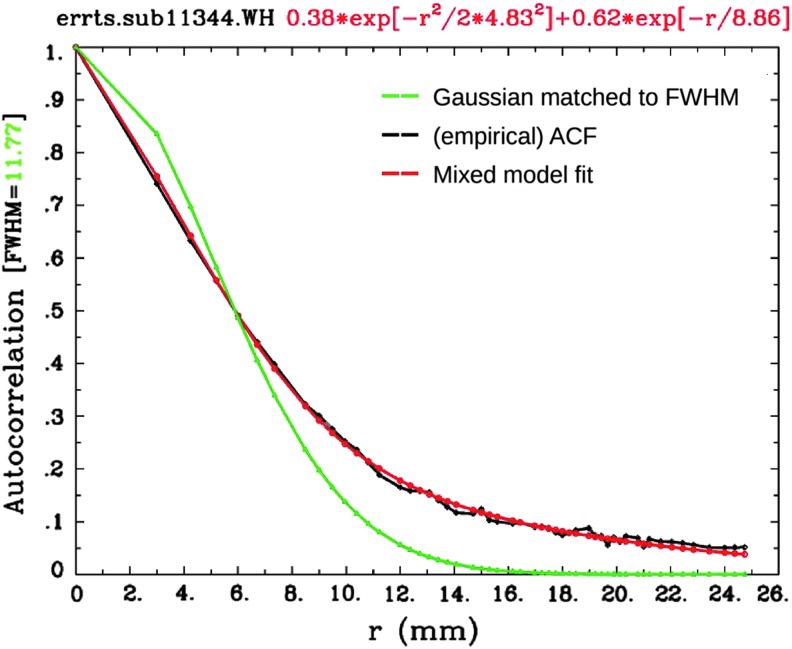
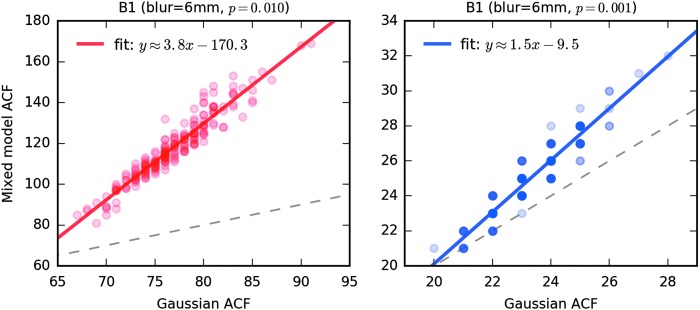
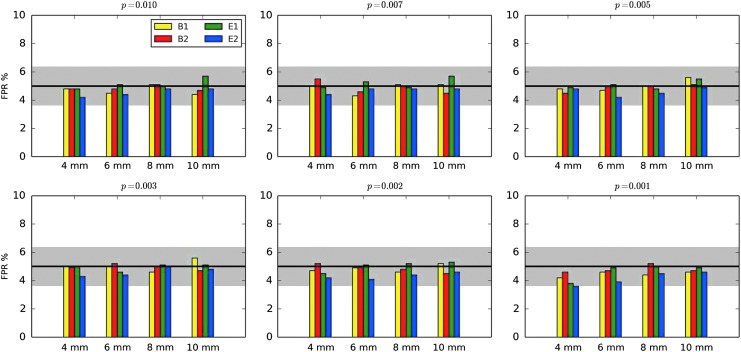
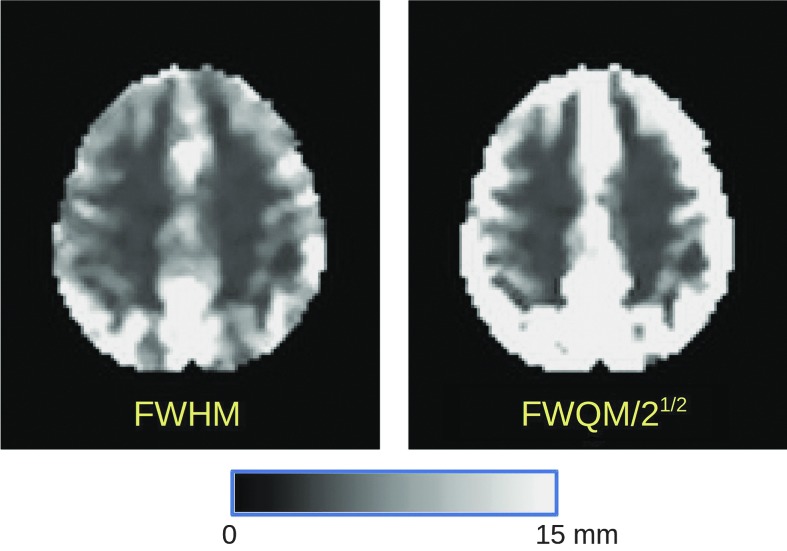
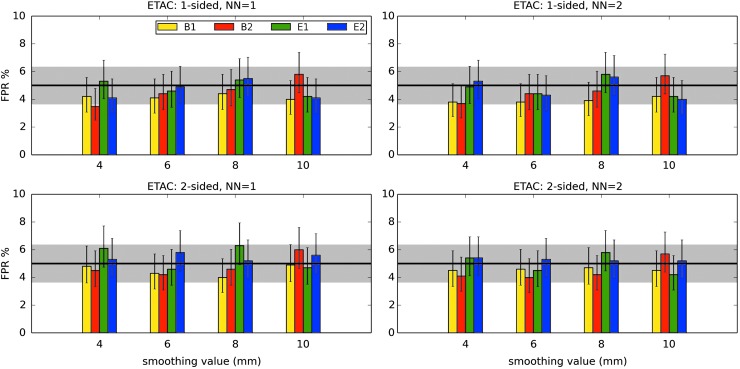
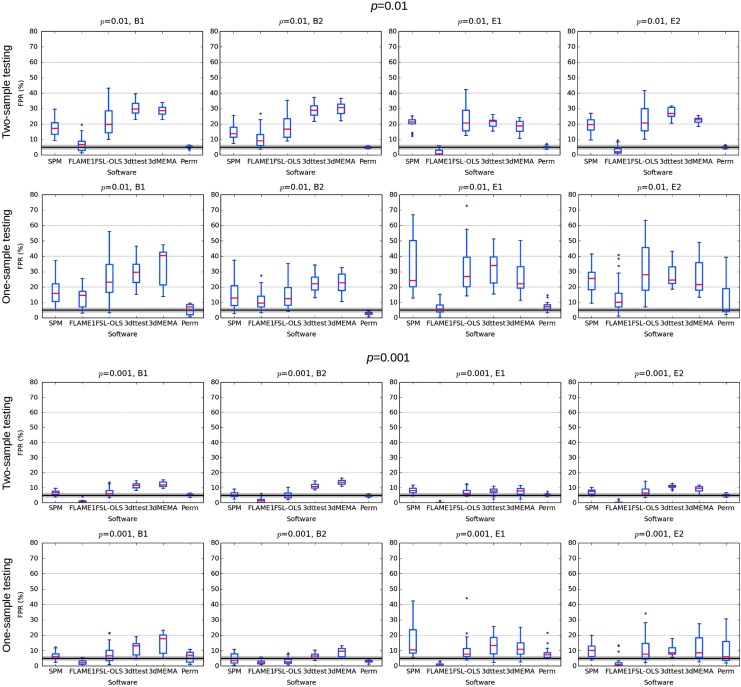
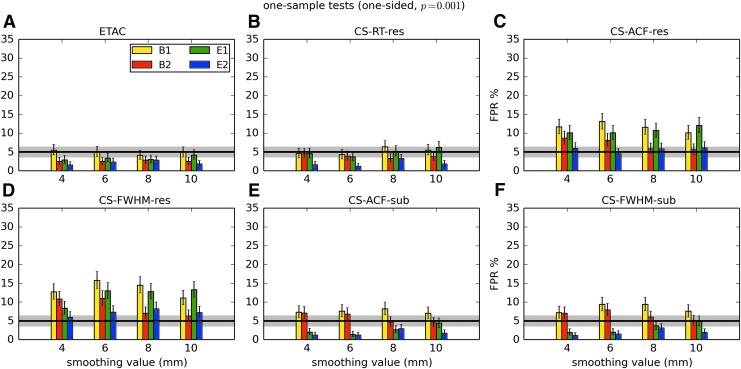
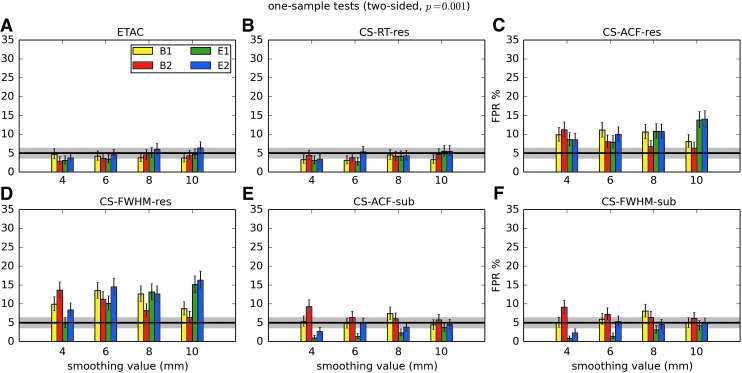
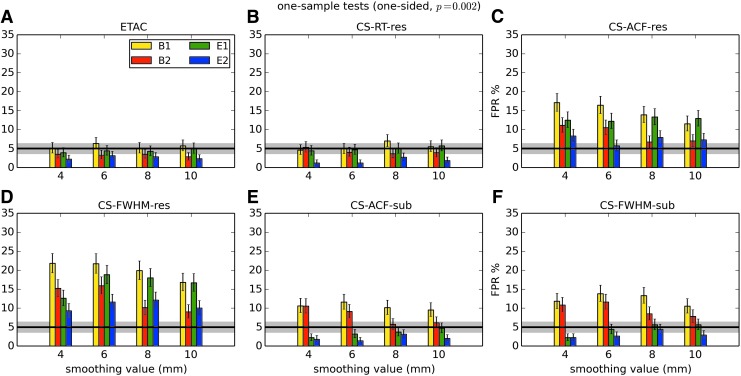
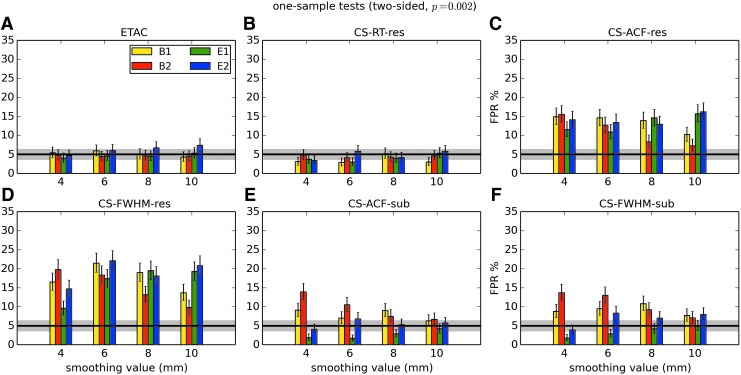
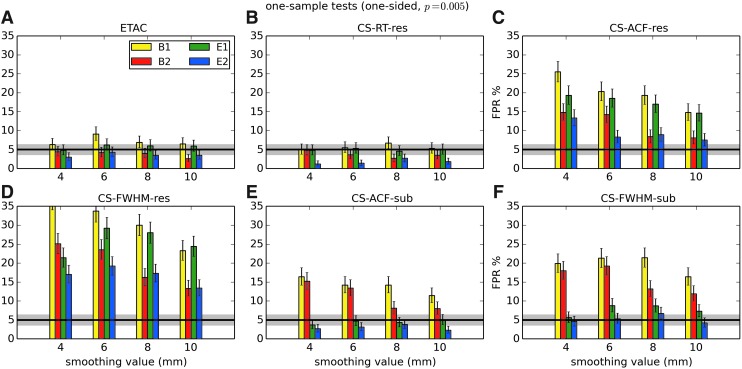
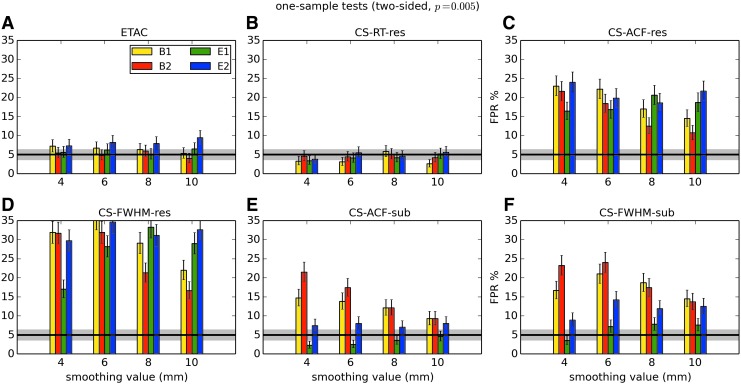
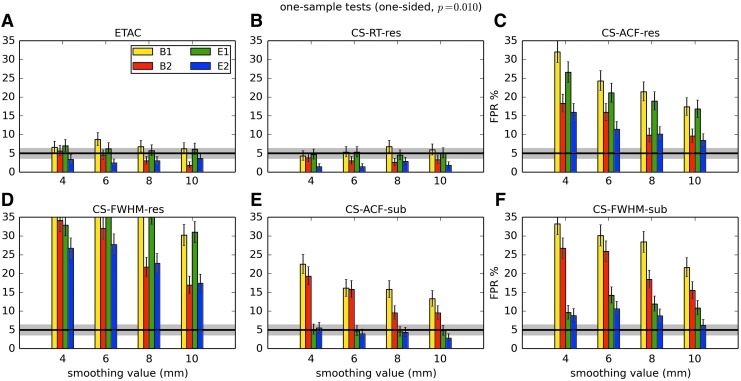
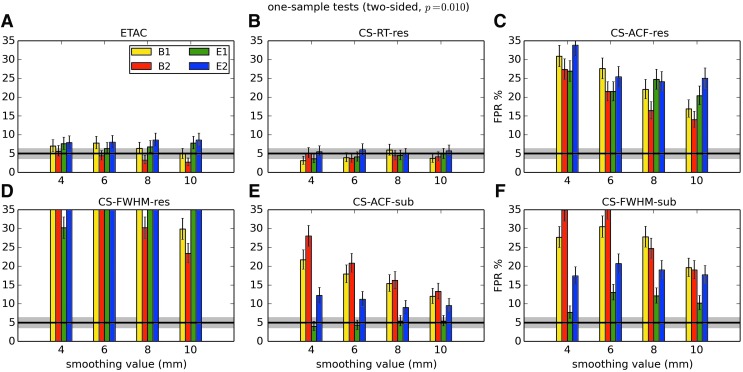
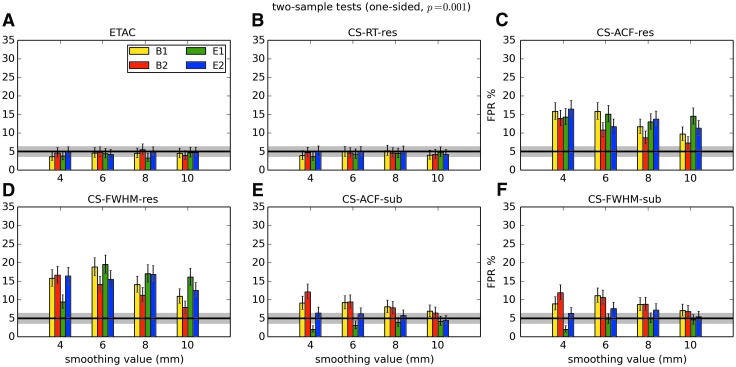
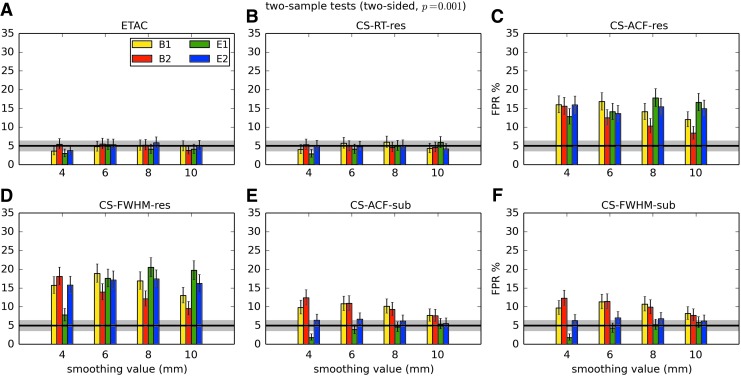
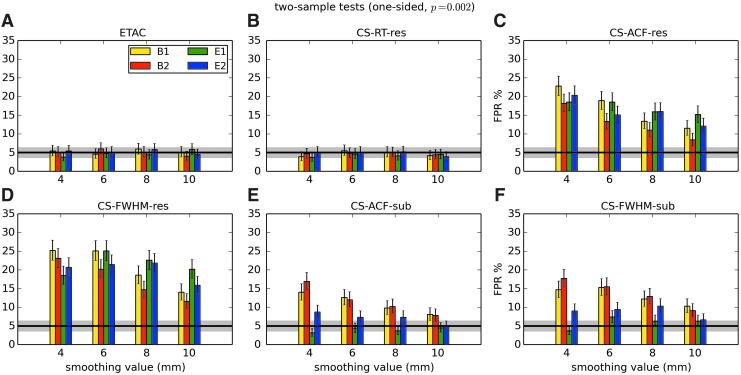
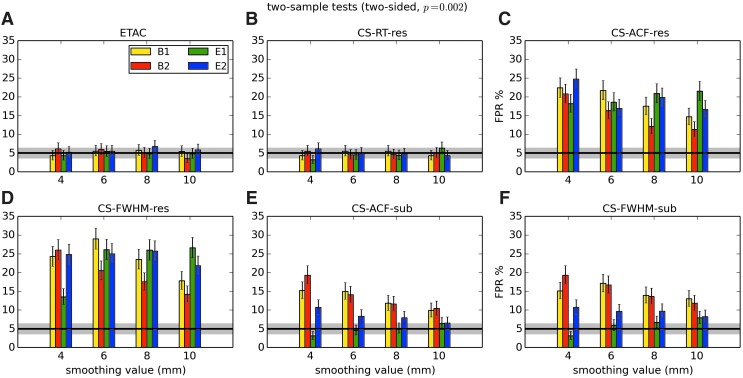
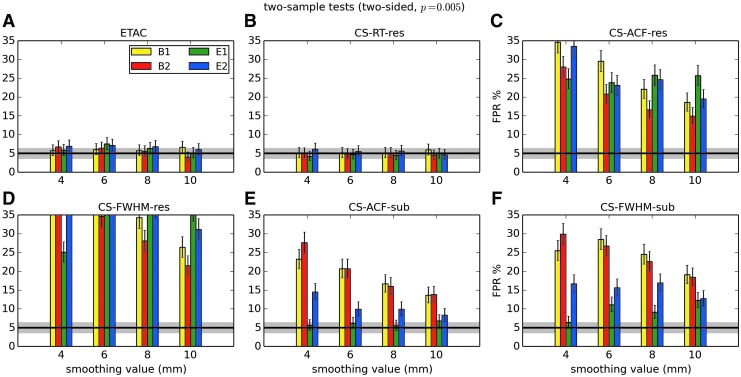
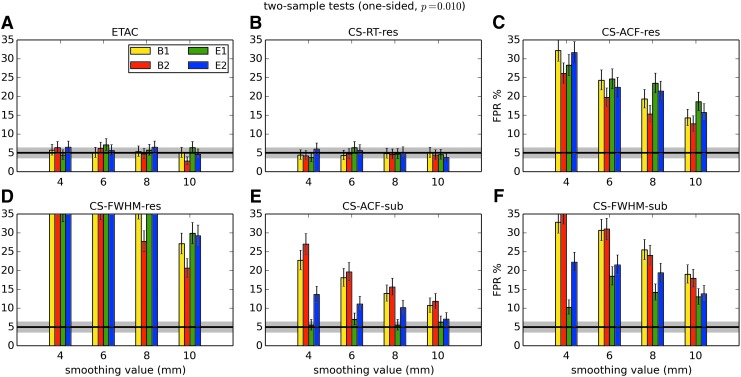
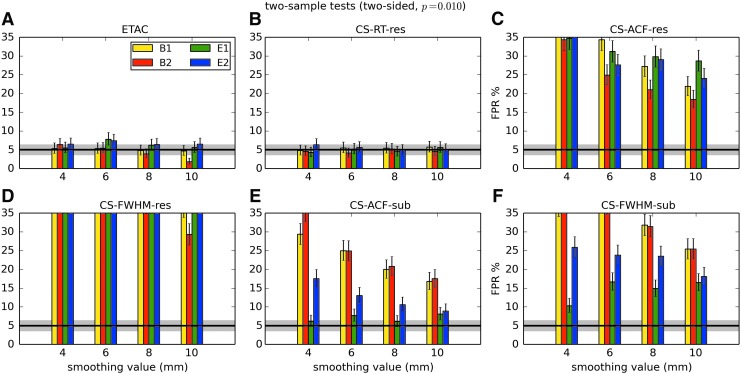
Recent reports of inflated false-positive rates (FPRs) in FMRI group analysis tools by Eklund and associates in 2016 have become a large topic within (and outside) neuroimaging. They concluded that existing parametric methods for determining statistically significant clusters had greatly inflated FPRs ("up to 70%," mainly due to the faulty assumption that the noise spatial autocorrelation function is Gaussian shaped and stationary), calling into question potentially "countless" previous results; in contrast, nonparametric methods, such as their approach, accurately reflected nominal 5% FPRs. They also stated that AFNI showed "particularly high" FPRs compared to other software, largely due to a bug in 3dClustSim. We comment on these points using their own results and figures and by repeating some of their simulations. Briefly, while parametric methods show some FPR inflation in those tests (and assumptions of Gaussian-shaped spatial smoothness also appear to be generally incorrect), their emphasis on reporting the single worst result from thousands of simulation cases greatly exaggerated the scale of the problem. Importantly, FPR statistics depends on "task" paradigm and voxelwise p value threshold; as such, we show how results of their study provide useful suggestions for FMRI study design and analysis, rather than simply a catastrophic downgrading of the field's earlier results. Regarding AFNI (which we maintain), 3dClustSim's bug effect was greatly overstated-their own results show that AFNI results were not "particularly" worse than others. We describe further updates in AFNI for characterizing spatial smoothness more appropriately (greatly reducing FPRs, although some remain >5%); in addition, we outline two newly implemented permutation/randomization-based approaches producing FPRs clustered much more tightly about 5% for voxelwise p ≤ 0.01.

Keywords: FMRI; autocorrelation function; clusters; false-positive rates; thresholding.


Conflict of interest statement

No competing financial interests exist.

Figures

<b>FIG. 1.</b>
FIG. 1.
FPRs for various software scenarios in AFNI, with 1000 two-sample 3D t-tests [as in Eklund and associates (2015, 2016)] using 20 subjects' data in each sample. “Buggy” (A–C) and “fixed” (D–F) mean that the cluster-size thresholds were selected using the Gaussian shape model with the FWHM being the median of the 40 individual subject values: “buggy” and “fixed” via 3dClustSim before and after the bug fix, respectively. “Mixed ACF” (G–I) means that the cluster-size threshold was selected using Eq. (3) for spatial correlation of the noise, with the a,b,c parameters being the median of the 40 individual subject's values (estimated via program 3dFWHMx). Three different voxelwise p value thresholds [one-sided tests, as used in Eklund and associates (2016)] are shown. The black line shows the nominal 5% FPR (out of 1000 trials), and the gray band shows its theoretical 95% confidence interval, 3.6–6.4%. As in ENK16, different smoothing values were tested (4–10 mm). B1 = 10-sec block; B2 = 30-sec block; E1 = regular event related; E2 = randomized event related. ACF, autocorrelation function; FPR, false-positive rate; FWHM, full-width at half-maximum.
<b>FIG. 2.</b>
FIG. 2.
Summary of the FPR results examined in Eklund and associates (2016), combining all their test results (available from their GitHub repository). The results of each software across all voxelwise p = 0.01 and p = 0.001 cases are shown separately. Red lines show the median; the box covers the 25–75% interquartile range; whiskers extend to the most extreme data point within 1.5 × the interquartile range; and outliers are shown as dots. For a given voxelwise p, results are similar across parametric methods, with typical ranges of 15–30% FPR for p = 0.01 and 5–15% FPR for p = 0.001.
<b>FIG. 3.</b>
FIG. 3.
An example comparison of the original Gaussian fit (green) and the globally estimated empirical ACF values (black) from a single subject, which have large differences (importantly, in the tail drop-off above r ∼ 8 mm). The proposed mixed model (red) after fitting parameters as described in Eq. (3) provides a much better fit of the data in this case (and in all cases in the data sets used herein). This plot is automatically generated in program 3dFWHMx.
<b>FIG. 4.</b>
FIG. 4.
Cluster-size thresholds from 3dClustSim ran over the estimated ACF for each of the 198 data sets in the Beijing-Zang cohort. The x-axis is the cluster-size threshold assuming a Gaussian-shaped ACF, with FWHM taken from the mixed model ACF estimate for each subject. The y-axis is the cluster-size threshold assuming the mixed model ACF of Eq. (3); the parameter estimates are computed from the residuals from the pseudostimulus B1, blur = 6 mm time series analyses. The left graph is for per voxel p threshold 0.010; the right graph is for p = 0.001. Approximate linear fits are shown overlaid; the dashed gray line shows x = y, providing a reference to indicate the disparity in cluster-size thresholds between the Gaussian and mixed-model ACF assumptions. Darker circles indicate points where multiple subjects had the same pair of thresholds (which are integer valued). Cluster-size thresholds are taken from the NN = 2, one-sided test table output from 3dClustSim (which also output tables for NN = 1 and NN = 3, and for two-sided tests).
<b>FIG. 5.</b>
FIG. 5.
FPRs with cluster-size thresholds now determined from the “-Clustsim” option of 3dttest++ (one-sided tests with NN = 1 clustering). See Figure 1 for description of labels, but note that the y-axis range has been significantly changed here for visual clarity.
<b>FIG. 6.</b>
FIG. 6.
Images of the FMRI noise FWHM and the FWQM from one subject (#11344) in the Beijing data set collection (after nominal smoothing with a Gaussian kernel of 4 mm FWHM during preprocessing). The scale in both images is linear from black = 0 to white = 15 mm (and above). If the ACF were Gaussian, FWQM = 21/2 × FHWM. The FWHM map shows that the noise smoothness is not uniform in space (even within gray matter), and the FWQM map shows that the non-Gaussianity of the noise smoothness is also nonuniform. The magnitude of this effect on the FPR and how to allow for it in thresholding are still under investigation. FWQM, full-width at quarter-maximum.
<b>FIG. 7.</b>
FIG. 7.
FPRs from the ETAC method, with the Beijing subset of FCON-1000. See Figure 1 for description of labels, but note that the y-axis range has been changed here for visual clarity. Three p value thresholds (0.005, 0.002, 0.001) are used simultaneously, and p-specific spatially variable cluster-size threshold maps are created from sign-randomized (and intersample permuted for the two-sample cases) simulations. For each of the 16 cases, 1000 random subsets of 40 subjects were selected, and a two-sample t-test was run between the first 20 and second 20 data sets for each of the 1000 instances. As labeled in each panel caption, results were calculated using either NN = 1 or NN = 2 neighborhoods (see Results section: The future, II: Equitable thresholding and clustering) to define the clusters, and either one-sided or two-sided t-testing to define the p value thresholding. All FPRs fall within the 95% nominal confidence interval; error bars show the 95% confidence interval estimated for each result. FPRs from the Cambridge subset of the FCON-1000 (also 198 subjects) yielded similar results. ETAC, equitable thresholding and clustering.
<b>APPENDIX FIG. 1.</b>
APPENDIX FIG. 1.
(A-1) Summary of the FPR results examined in ENK16, combining all their test results (available from their GitHub repository). The results of each software are shown separately based on voxelwise p ( = 0.01 or 0.001), statistical test (one or two sample), and task stimulus (blocks B1 or B2, or event-related E1 or E2). Red lines show the median; the box covers the 25–75% interquartile range; whiskers extend to the most extreme data point within 1.5× the interquartile range; and outliers are shown as dots. While results are fairly similar across parametric approaches, there is notable variation in FPR distribution among cases.
<b>APPENDIX FIG. 2.</b>
APPENDIX FIG. 2.
(B-1) One-sample, one-sided t-tests with voxelwise p = 0.001.
None
(B-2) One-sample, two-sided t-tests with voxelwise p = 0.001.
None
(B-3) One-sample, one-sided t-tests with voxelwise p = 0.002.
None
(B-4) One-sample, two-sided t-tests with voxelwise p = 0.002.
None
(B-5) One-sample, one-sided t-tests with voxelwise p = 0.005.
None
(B-6) One-sample, two-sided t-tests with voxelwise p = 0.005.
None
(B-7) One-sample, one-sided t-tests with voxelwise p = 0.010.
None
(B-8) One-sample, two-sided t-tests with voxelwise p = 0.010.
None
(B-9) Two-sample, one-sided t-tests with voxelwise p = 0.001.
None
(B-10) Two-sample, two-sided t-tests with voxelwise p = 0.001.
None
(B-11) Two-sample, one-sided t-tests with voxelwise p = 0.002.
None
(B-12) Two-sample, two-sided t-tests with voxelwise p = 0.002.
None
(B-13) Two-sample, one-sided t-tests with voxelwise p = 0.005.
None
(B-14) Two-sample, two-sided t-tests with voxelwise p = 0.005.
None
(B-15) Two-sample, one-sided t-tests with voxelwise p = 0.010.
None
(B-16) Two-sample, two-sided t-tests with voxelwise p = 0.010.

References

    1. BEC Crew. 2016. A bug in FMRI software could invalidate 15 years of brain research. www.sciencealert.com/a-bug-in-fmri-software-could-invalidate-decades-of-... Last accessed December3, 2016
    1. Biswal B, et al. . 2010. Toward discovery science of human brain function. Proc Natl Acad Sci USA 107:4734–4739 - PMC - PubMed
    1. Chen GC, Saad ZS, Britton JC, Pine DS, Cox RW. 2013. Linear mixed-effects modeling approach to FMRI group analysis. NeuroImage 73:176–190 - PMC - PubMed
    1. Chen GC, Taylor PA, Cox RW. 2016. Is the statistic value all we should care about in neuroimaging? NeuroImage [Epub ahead of print]; DOI:10.1016/j.neuroimage.2016.09.066 - DOI - PMC - PubMed
    1. Cox RW, Reynolds RC. 2016. Improved statistical testing for FMRI based group studies in AFNI:). OHBM; Geneva: https://afni.nimh.nih.gov/pub/dist/HBM2016/Cox_Poster_HBM2016.pdf

Publication types