. 2017 Apr;7(3):172-181.
doi: 10.1089/brain.2016.0471.

Neural Correlates of Consciousness at Near-Electrocerebral Silence in an Asphyxial Cardiac Arrest Model

Affiliations

Neural Correlates of Consciousness at Near-Electrocerebral Silence in an Asphyxial Cardiac Arrest Model

Donald E Lee et al. Brain Connect. 2017 Apr.

Abstract

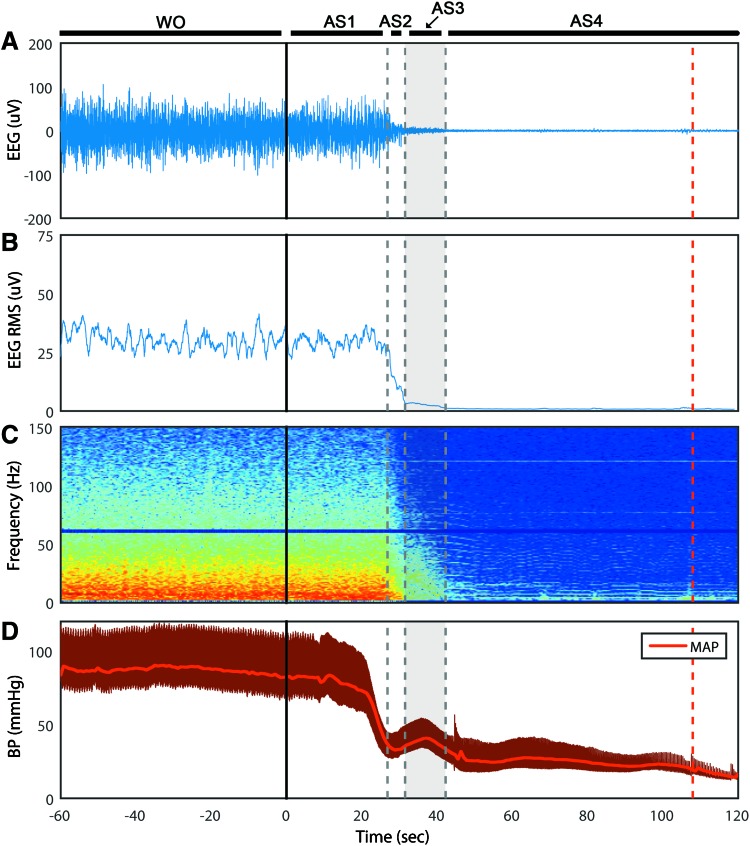
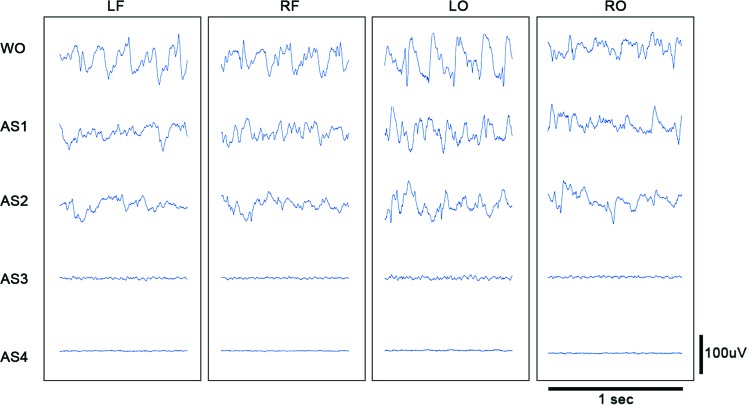
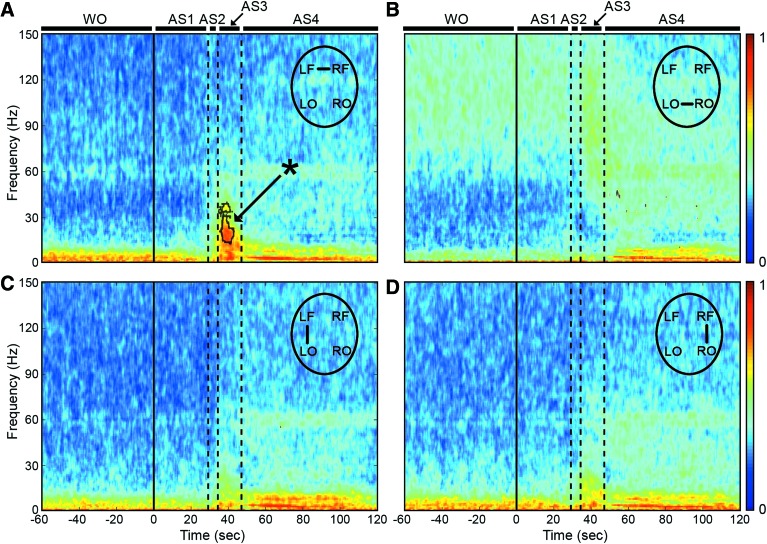
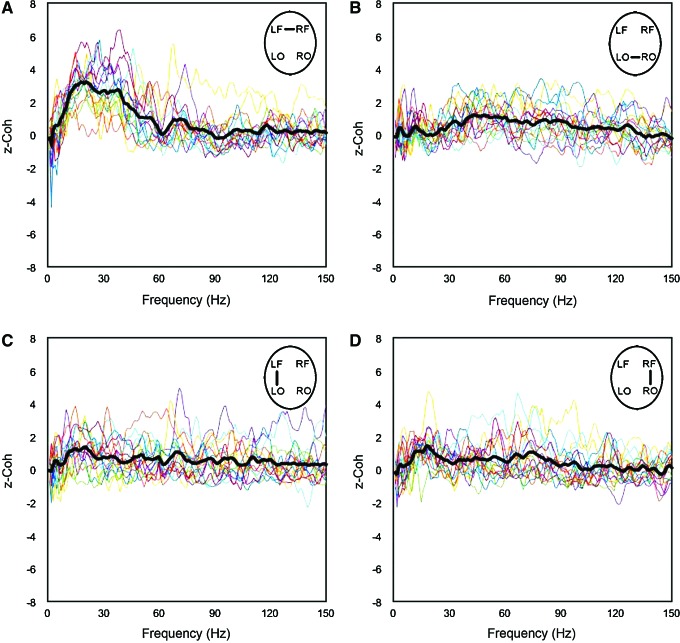
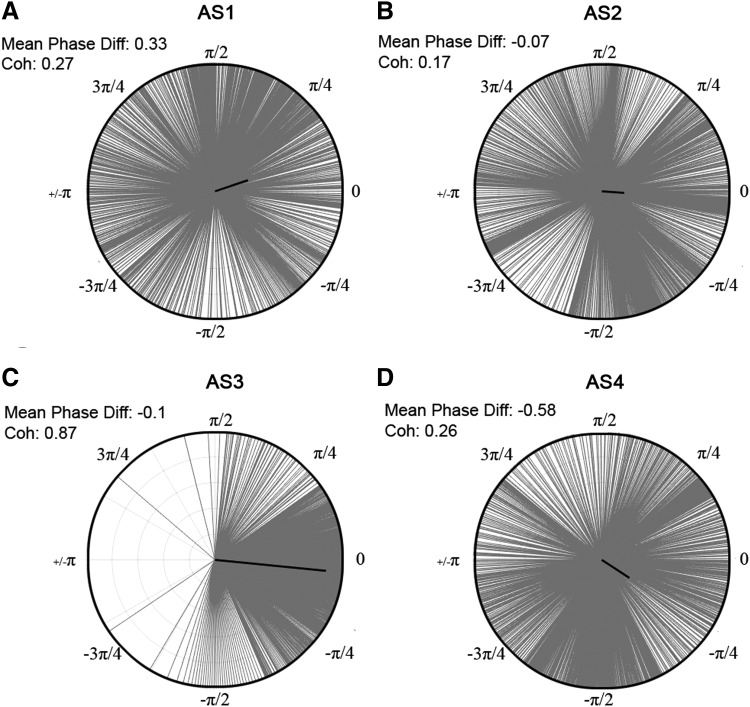
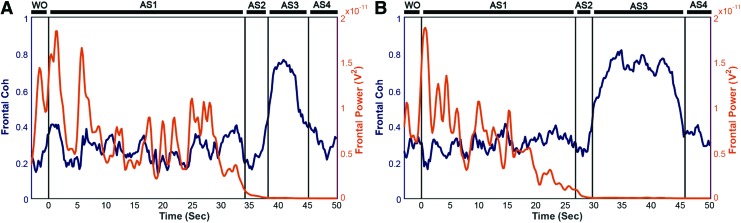
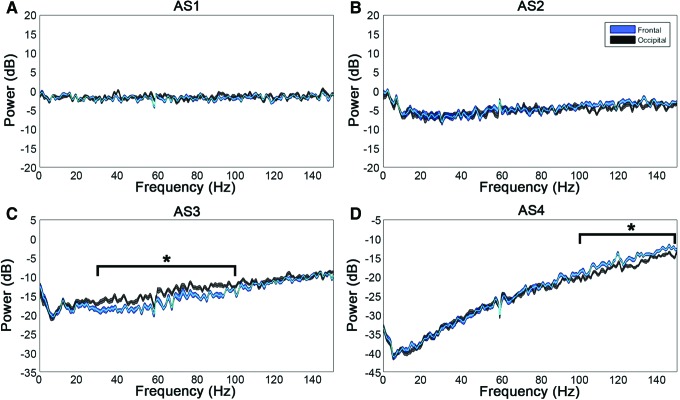
Recent electrophysiological studies have suggested surges in electrical correlates of consciousness (i.e., elevated gamma power and connectivity) after cardiac arrest (CA). This study examines electrocorticogram (ECoG) activity and coherence of the dying brain during asphyxial CA. Male Wistar rats (n = 16) were induced with isoflurane anesthesia, which was washed out before asphyxial CA. Mean phase coherence and ECoG power were compared during different stages of the asphyxial period to assess potential neural correlates of consciousness. After asphyxia, the ECoG progressed through four distinct stages (asphyxial stages 1-4 [AS1-4]), including a transient period of near-electrocerebral silence lasting several seconds (AS3). Electrocerebral silence (AS4) occurred within 1 min of the start of asphyxia, and pulseless electrical activity followed the start of AS4 by 1-2 min. AS3 was linked to a significant increase in frontal coherence between the left and right motor cortices (p < 0.05), with no corresponding increase in ECoG power. AS3 was also associated with a significant posterior shift of ECoG power, favoring the visual cortices (p < 0.05). Although the ECoG during AS3 appears visually flat or silent when viewed with standard clinical settings, our study suggests that this period of transient near-electrocerebral silence contains distinctive neural activity. Specifically, the burst in frontal coherence and posterior shift of ECoG power that we find during this period immediately preceding CA may be a neural correlate of conscious processing.

Keywords: cardiac arrest; coherence; connectivity; consciousness; electroencephalogram; near death.


Conflict of interest statement

The authors declare that the research was conducted in the absence of any commercial or financial relationships that could be construed as a potential conflict of interest.

Figures

<b>FIG. 1.</b>
FIG. 1.
Time course of asphyxial CA of representative rat. (A) The ECoG displayed four stages (AS1–4) after isoflurane washout (WO) and the start of asphyxia (t = 0). The ECoG maintained its morphology during AS1, followed by a precipitous drop in amplitude during AS2, and a stable near-silent ECoG during AS3. AS4 marked the beginning of isoelectric EEG. (B) The averaged RMS of the ECoG of the four channels was used to approximate ECoG amplitude and characterize the four asphyxial stages. (C) The ECoG spectrogram (four channels averaged) shows the preferential loss of faster frequency activity during AS2–3. (D) The BP dropped similarly to the ECoG, but did not achieve CA (MAP <20 mmHg) until nearly 2 min after asphyxia, as indicated by the dashed red line. AS1–4, asphyxial stages 1–4; BP, blood pressure; CA, cardiac arrest; ECoG, electrocorticogram; EEG, electroencephalogram; MAP, mean arterial pressure; RMS, root mean square. Color images available online at www.liebertpub.com/brain
<b>FIG. 2.</b>
FIG. 2.
Asphyxial stages of each channel for a representative rat. Displayed are 1 sec of ECoG of a representative rat during each stage of asphyxial CA. The amplitude during AS3 is nearly as suppressed as during AS4 (electrocerebral silence); however, some faster frequency activity is evident during AS3 that is not visible during AS4. LF, left frontal; LO, left occipital; RF, right frontal; RO, right occipital; WO, isoflurane washout. Color images available online at www.liebertpub.com/brain
<b>FIG. 3.</b>
FIG. 3.
ECoG phase coherence during asphyxial CA. (A) During AS3, the interhemispheric frontal coherence from 13 to 39 Hz (i.e., beta and slow gamma) was significantly greater (p < 0.05) than during the period immediately before asphyxia (i.e., washout). (B–D) The coherence during AS3 in the other channel combinations was not significantly greater than washout. The coherence during AS4 was largely an artifact of the ECG signal penetrating the ECoG. Data shown as mean of n = 16 rats. Dotted lines indicate region of statistical significance. *p < 0.05 by paired two-tailed nonparametric permutation test. ECG, electrocardiogram. Color images available online at www.liebertpub.com/brain
<b>FIG. 4.</b>
FIG. 4.
Coherence during AS3 for each rat. The coherence for each rat was z-normalized to the last minute of anesthesia washout. Each line represents the z-coherence of an individual rat during the middle 2 sec of its respective AS3. (A–D) Broadly, intra- and interhemispheric coherence of individual rats increases during AS3. (A) However, a consistent and significant increase was seen only in the interhemispheric frontal coherence. Color images available online at www.liebertpub.com/brain
<b>FIG. 5.</b>
FIG. 5.
Phase differences during asphyxial stages of representative rat. The distribution of phase differences for the beginning of each asphyxial stage (i.e., beginning 2 sec of AS1–4, respectively) is displayed from −π to π between the left and right frontal leads from 13 to 39 Hz. The mean phase difference is depicted by the angle of the bold black line, and the coherence value is represented by the magnitude of the line. (C) AS3 has a more consistent phase difference compared with (A, B, D) AS1, AS2, and AS4.
<b>FIG. 6.</b>
FIG. 6.
Frontal coherence and power (13–39 Hz) of two representative rats. (A, B) Although the frontal coherence rises during AS3, frontal power from 13 to 39 Hz decreases sharply late in AS1 and during AS2 and remains suppressed during AS3. Color images available online at www.liebertpub.com/brain
<b>FIG. 7.</b>
FIG. 7.
Frontal versus occipital power during asphyxial stages. Displayed are the differences in power from washout during AS1–4. (A, B) No significant differences in power between the frontal and occipital leads are observed in AS1–2. (C) AS3, however, has a significant posterior shift in power from 30 to 100 Hz. (D) 100–150 Hz of AS4 also demonstrated a significant difference, which may have been because of artifact. Data shown are mean and 95% CI of n = 16 rats. *p < 0.05 by Mann–Whitney U-test and false discovery rate multiple comparisons correction. Color images available online at www.liebertpub.com/brain

References

    1. Bola M, Sabel BA. 2015. Dynamic reorganization of brain functional networks during cognition. NeuroImage 114:398–413 - PubMed
    1. Boly M, et al. . 2013. Consciousness in humans and non-human animals: recent advances and future directions. Front Psychol 4:1–20 - PMC - PubMed
    1. Bonney S, Hughes K, Eckle T. 2014. Anesthetic cardioprotection: the role of adenosine. Curr Pharm Des 20:5690–5695 - PMC - PubMed
    1. Borjigin J, et al. . 2013. Surge of neurophysiological coherence and connectivity in the dying brain. Proc Natl Acad Sci 110:14432–14437 - PMC - PubMed
    1. Buschman J, Miller EK. 2007. Top-down versus bottom-up control of attention in the prefrontal and posterior parietal cortices. Science 315:1860–1862 - PubMed

Publication types