. 2017 Apr 11;17(1):54.
doi: 10.1186/s12874-017-0328-2.

Comparison of surveillance-based metrics for the assessment and monitoring of disease detection: simulation study about type 2 diabetes

Affiliations

Comparison of surveillance-based metrics for the assessment and monitoring of disease detection: simulation study about type 2 diabetes

Ralph Brinks et al. BMC Med Res Methodol. .

Abstract

Background: Screening and detection of cases are a common public health priority for treatable chronic conditions with long subclinical periods. However, the validity of commonly-used metrics from surveillance systems for rates of detection (or case-finding) have not been evaluated.

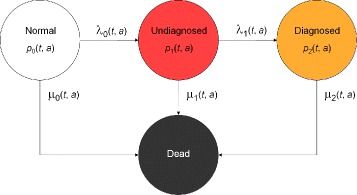
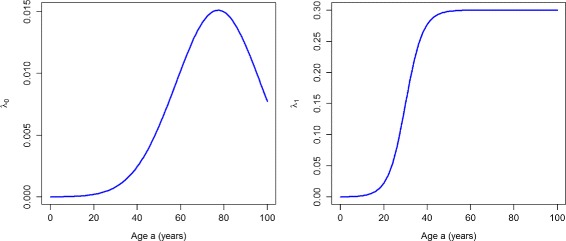
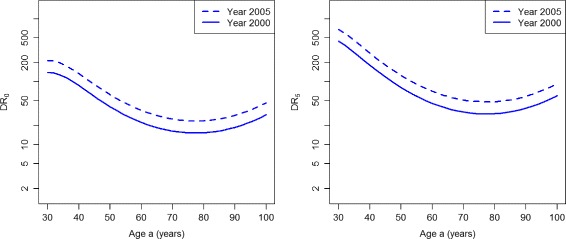
Methods: Using data from a Danish diabetes register and a recently developed illness-death model of chronic diseases with subclinical conditions, we simulate two scenarios of different performance of case-finding. We report different epidemiological indices to assess case-finding in both scenarios and compare the validity of the results.

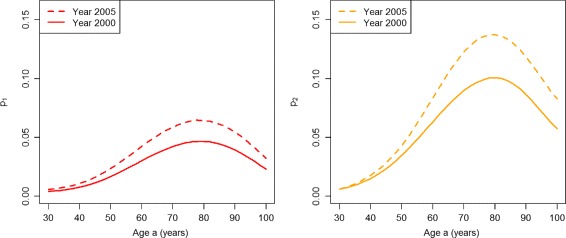
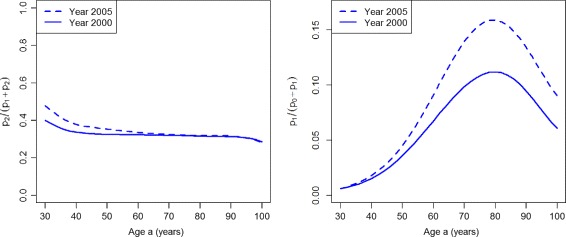
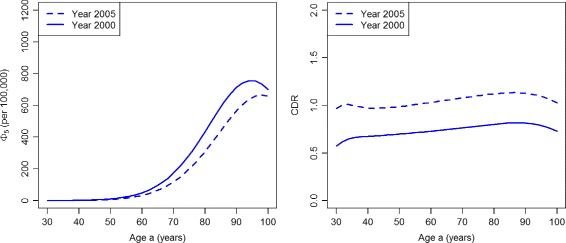
Results: The commonly used ratio of detected cases over total cases may lead to misleading conclusions. Instead, the ratio of undetected cases over persons without a diagnosis is a more valid index to distinguish the quality of case-finding. However, incidence-based measures are preferable to prevalence based indicators.

Conclusion: Prevalence-based indices for assessing case-finding should be interpreted with caution. If possible, incidence-based indices should be preferred.

Keywords: Case-finding; Chronic disease; Compartment model; Diabetes; Incidence; Prevalence; Screening; Undiagnosed disease.


Figures

Fig. 1
Fig. 1
Chronic disease model with four states according to [7]. Persons in the state Normal are healthy with respect to the disease under consideration. After onset of the disease, they change to state Undiagnosed and later to the state Diagnosed. The absorbing state Dead can be reached from all other states. The numbers of persons in the states and the transition rates depend on calendar time t and age a
Fig. 2
Fig. 2
Incidence rates. Age-specific transition rates λ 0 (left) and λ 1 (right) in year t=1995
Fig. 3
Fig. 3
Prevalences in the worsened case-finding scenario. Age-specific prevalences p 1 (left) and p 2 (right) in the years t=2000 (solid lines) and t=2005 (dashed lines) in the scenario PU+
Fig. 4
Fig. 4
Prevalence-based indices in the worsened case-finding scenario. Age-specific indices of case-finding ω 1 (left) and ω 2 (right) in the years t=2000 (solid lines) and t=2005 (dashed lines) in the scenario PU+
Fig. 5
Fig. 5
Detection ratios in the worsened case-finding scenario. Age-specific detection ratios DR0 (left) and DR5 (right) in the years t=2000 (solid lines) and t=2005 (dashed lines) in the scenario PU+
Fig. 6
Fig. 6
Number of deaths from the undiagnosed state and case detection rate in the worsened case-finding scenario. Age-specific number Φ 5 (per 100,000 healthy persons, left) and the case detection rate CDR (right) in the years t=2000 (solid lines) and t=2005 (dashed lines) in the scenario PU+
Fig. 7
Fig. 7
Prevalences in the improved case-finding scenario. Age-specific prevalences p 1 (left) and p 2 (right) in the years t=2000 (solid lines) and t=2005 (dashed lines) in the scenario PU
Fig. 8
Fig. 8
Prevalence-based indices in the improved case-finding scenario. Age-specific indices of case-finding ω 1 (left) and ω 2 (right) in the years t=2000 (solid lines) and t=2005 (dashed lines) in the scenario PU
Fig. 9
Fig. 9
Detection ratios in the improved case-finding scenario. Age-specific detection ratios DR0 (left) and DR5 (right) in the years t=2000 (solid lines) and t=2005 (dashed lines) in the scenario PU
Fig. 10
Fig. 10
Number of deaths from the undiagnosed state and case detection rate in the improved case-finding scenario. Age-specific number Φ 5 (per 100,000 healthy persons, left) and the case detection rate CDR (right) in the years t=2000 (solid lines) and t=2005 (dashed lines) in scenario PU

References

    1. Gregg EW, Cadwell BL, Cheng YJ, Cowie CC, Williams DE, Geiss L, Engelgau MM, Vinicor F. Trends in the prevalence and ratio of diagnosed to undiagnosed diabetes according to obesity levels in the US. Diabetes Care. 2004;27(12):2806–812. doi: 10.2337/diacare.27.12.2806. - DOI - PubMed
    1. Coresh J, Byrd-Holt D, Astor B, Briggs J, Eggers P, Lacher D, Hostetter T. Chronic kidney disease awareness, prevalence, and trends among U.S, adults, 1999 to 2000. J Am Soc Nephrol. 2005;16(1):180–8. doi: 10.1681/ASN.2004070539. - DOI - PubMed
    1. Ayanian JZ, Zaslavsky AM, Weissman JS, Schneider EC, Ginsburg JA. Undiagnosed hypertension and hypercholesterolemia among uninsured and insured adults in the third National Health and Nutrition Examination Survey. Am J Public Health. 2003;93(12):2051–054. doi: 10.2105/AJPH.93.12.2051. - DOI - PMC - PubMed
    1. Basu S, Millett C. Social epidemiology of hypertension in middle-income countries determinants of prevalence, diagnosis, treatment, and control in the WHO SAGE study. Hypertension. 2013;62(1):18–26. doi: 10.1161/HYPERTENSIONAHA.113.01374. - DOI - PubMed
    1. Lim SS, Vos T, Flaxman AD, Danaei G, Shibuya K, Adair-Rohani H, AlMazroa MA, Amann M, Anderson HR, Andrews KG, et al. A comparative risk assessment of burden of disease and injury attributable to 67 risk factors and risk factor clusters in 21 regions, 1990–2010: a systematic analysis for the Global Burden of Disease Study 2010. Lancet. 2013;380(9859):2224–260. doi: 10.1016/S0140-6736(12)61766-8. - DOI - PMC - PubMed