. 2017 Apr 11;18(1):55.
doi: 10.1186/s12931-017-0541-x.

Characterisation of a murine model of the late asthmatic response

Affiliations

Characterisation of a murine model of the late asthmatic response

Katie Baker et al. Respir Res. .

Abstract

Background: The incidence of asthma is increasing at an alarming rate. While the current available therapies are effective, there are associated side effects and they fail to adequately control symptoms in all patient subsets. In the search to understand disease pathogenesis and find effective therapies hypotheses are often tested in animal models before progressing into clinical studies. However, current dogma is that animal model data is often not predictive of clinical outcome. One possible reason for this is the end points measured such as antigen-challenge induced late asthmatic response (LAR) is often used in early clinical development, but seldom in animal model systems. As the mouse is typically selected as preferred species for pre-clinical models, we wanted to characterise and probe the validity of a murine model exhibiting an allergen induced LAR.

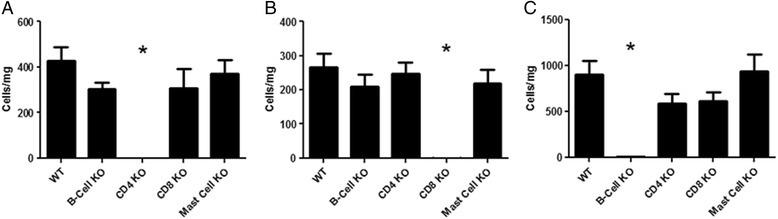
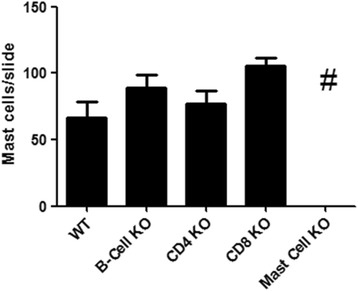
Methods: C57BL/6 mice were sensitised with antigen and subsequently topically challenged with the same antigen. The role of AlumTM adjuvant, glucocorticoid, long acting muscarinic receptor antagonist (LAMA), TRPA1, CD4+ and CD8+ T cells, B cells, Mast cells and IgE were determined in the LAR using genetically modified mice and a range of pharmacological tools.

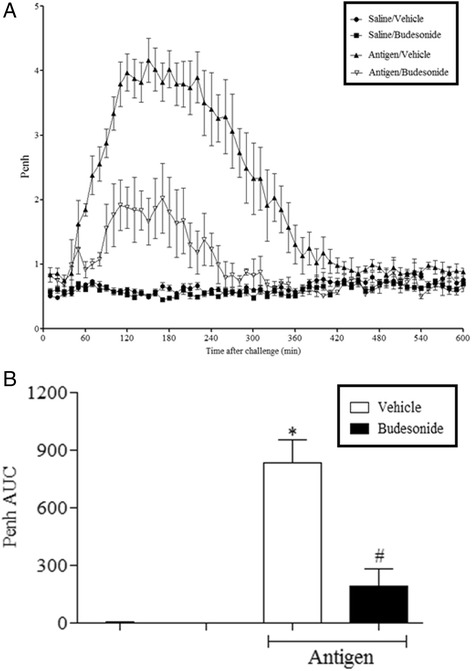
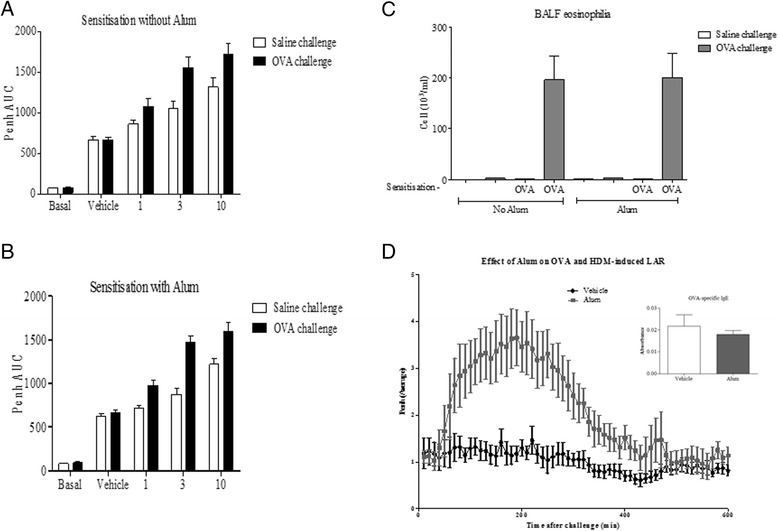
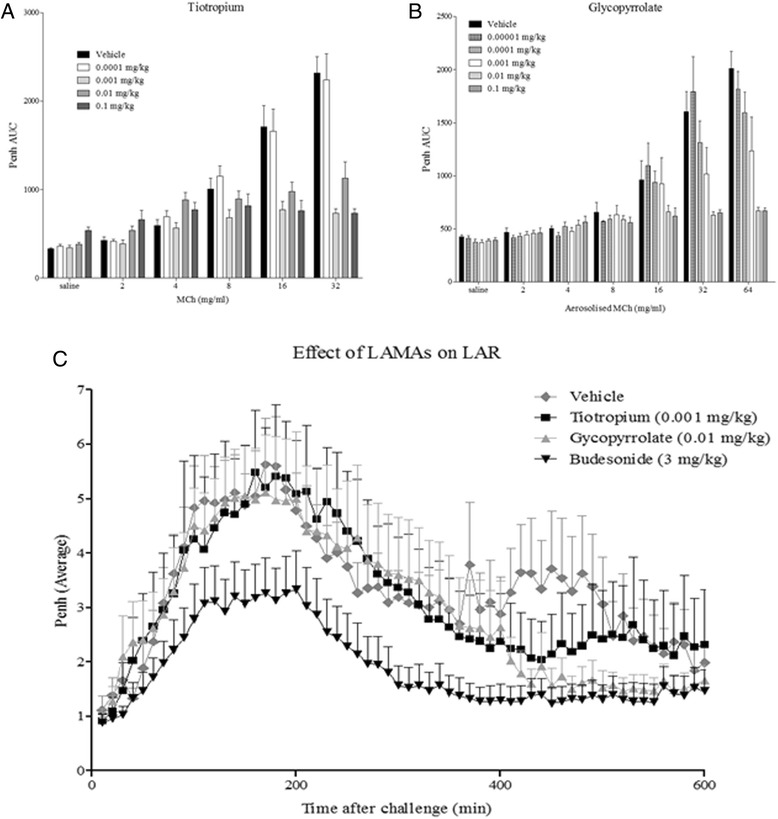
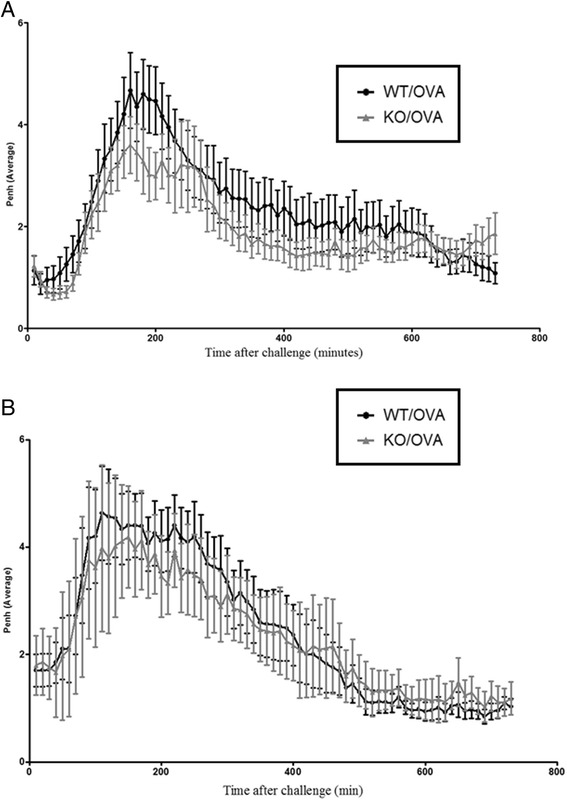
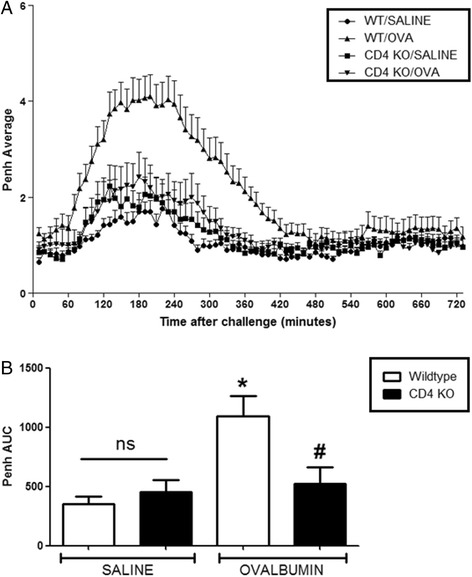
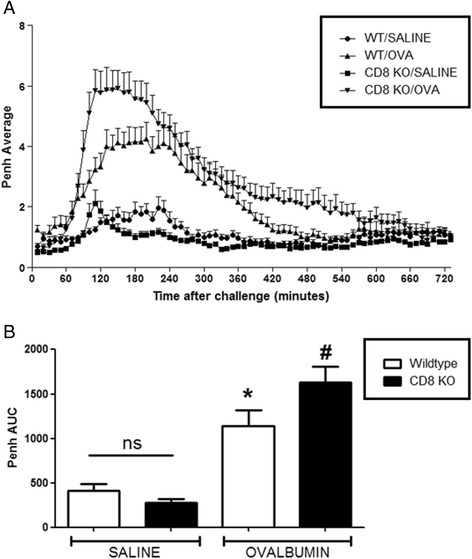
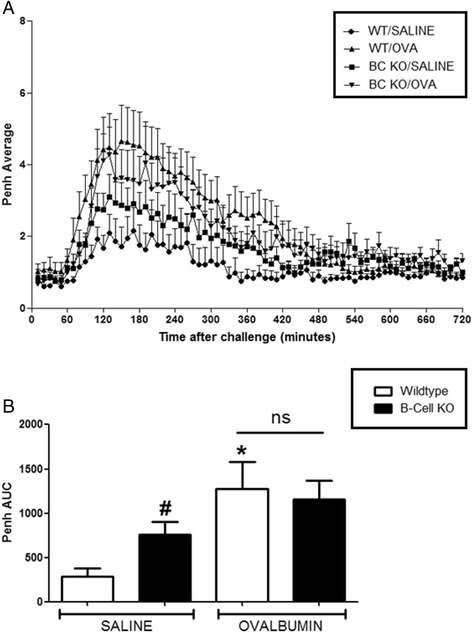
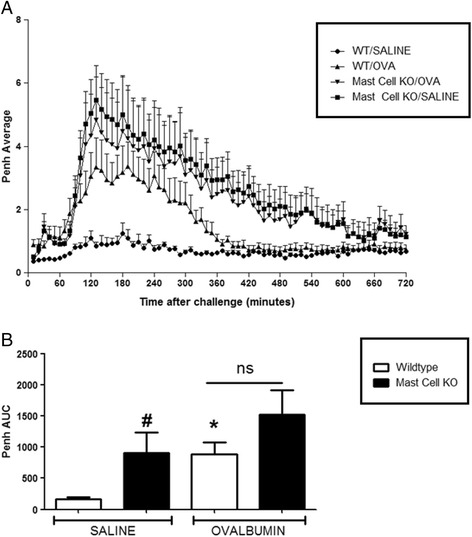
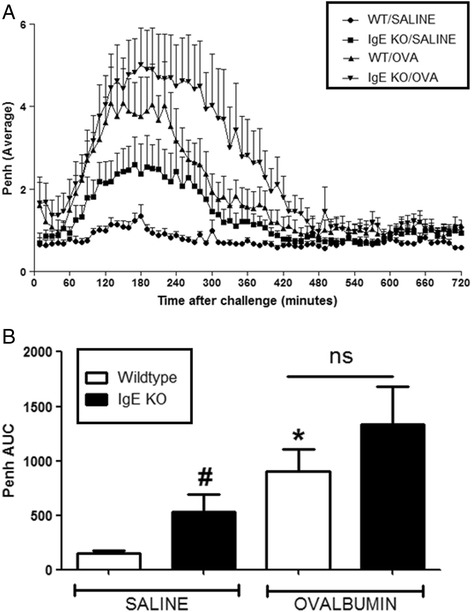
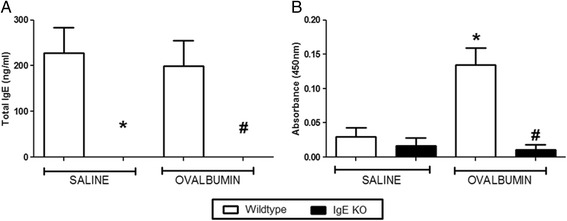
Results: Our data showed that unlike other features of asthma (e.g. cellular inflammation, elevated IgE levels and airway hyper-reactivity (AHR) the LAR required AlumTMadjuvant. Furthermore, the LAR appeared to be sensitive to glucocorticoid and required CD4+ T cells. Unlike in other species studied, the LAR was not sensitive to LAMA treatment nor required the TRPA1 ion channel, suggesting that airway sensory nerves are not involved in the LAR in this species. Furthermore, the data suggested that CD8+ T cells and the mast cell-B-cell - IgE axis appear to be protective in this murine model.

Conclusion: Together we can conclude that this model does feature steroid sensitive, CD4+ T cell dependent, allergen induced LAR. However, collectively our data questions the validity of using the murine pre-clinical model of LAR in the assessment of future asthma therapies.


Figures

Fig. 1
Fig. 1
The effect of Budesonide treatment in the mouse OVA-driven LAR. Immediately following recovery from allergen challenge, mice were placed in WBP chambers and Penh recorded for 12 h. The two bars on the left are the data from the saline challenge/vehicle treated and saline challenged/drug treated, control groups. Data is expressed as a) Penh average over the recording time period; b) Penh Area Under Curve. Data expressed as mean ± s.e.m. n = 5–8. Mann-Whitney U-test. *p < 0.05 Vehicle/Saline compared to Vehicle/Ovalbumin. #p < 0.05 Budesonide (3 mg/kg)/Ovalbumin compared to Vehicle/Ovalbumin
Fig. 2
Fig. 2
Assessing the importance of Alum in murine asthma models. Mice underwent antigen sensitisation either a) without AlumTM or b) with AlumTM before undergoing increasing Methacholine challenge and Penh recording at 10 min intervals. Following this c) BALF eosinophilia was assessed. d) Mice also underwent antigen sensitisation with and without AlumTM before OVA induced LAR was recorded. Data expressed as mean ± s.e.m. n = 8
Fig. 3
Fig. 3
The Role of Airway Sensory Nerves in the mouse OVA-driven LAR model. Mice underwent a dose response to inhaled Methacholine having previously been dosed with a) Tiotropium or b) Glycopyrrolate in order to establish an effective dose for the LAR investigation. Following this c) Tiotropium, Glycopyrrolate and Budesonide were applied to the OVA driven mouse model of LAR. Data expressed as mean ± s.e.m. n = 8
Fig. 4
Fig. 4
Assessing the importance of TRPA1 in the mouse OVA-driven LAR model. TRPA1−/− mice were obtained from either a) Jackson laboratories or b) David Julius Laboratory before being applied to the mouse OVA-driven LAR model. Data expressed as mean ± s.e.m. n = 8
Fig. 5
Fig. 5
Validation of Lymphocyte Populations in Genetically Modified Mice by Flow Cytometry. Leukocytes from the lung tissue of wildtype (C57BL/6), B-cell−/−, CD4−/−, CD8−/− and Mast-cell−/− naïve male mice were attained via enzymatic digest. Flow Cytometry was used to assess the numbers of: a) CD4+ cells; b) CD8+ cells and c) CD19+ cells. Data is expressed as mean cell number per mg of lung tissue ± s.e.m. n = 6–8. One-way ANOVA, Kruskal-Wallis test with post-hoc comparisons using Dunn’s multiple comparison test. *p < 0.05 compared to wildtype control group
Fig. 6
Fig. 6
Validation of Mast Cell Populations in Genetically Modified Mice by Histology. Lung tissue slices were obtained from wildtype C57BL/6, B-cell−/−, CD4−/−, CD8−/− and Mast-cell−/− naïve male mice. They were stained utilising a standard Toluidine Blue histological stain and numbers of mast cells per slide were counted (×40 magnification) by a blinded observer. Data is expressed as mean cell number per slide ± s.e.m. n = 6–8. One-way ANOVA, Kruskall-Wallis test with post-hoc comparisons using Dunn’s multiple comparison test. #p < 0.05 compared to wildtype control group
Fig. 7
Fig. 7
The Role of CD4+ Cells in the OVA-driven Mouse Model of LAR. Immediately following recovery from allergen challenge, mice were placed in WBP chambers and Penh recorded for 12 h. Data is expressed as a) Penh average over the recording time period; b) Penh Area Under Curve. Data expressed as mean ± s.e.m. n = 13–21. Mann-Whitney U-test. *p < 0.05 wildtype Saline sensitised compared to wildtype Ovalbumin sensitised groups. #p < 0.05 CD4−/− Ovalbumin sensitised compared to wildtype Ovalbumin sensitised groups. No significant difference between groups is denoted ns
Fig. 8
Fig. 8
The Role of CD8+ Cells in the OVA-driven Mouse Model of LAR. Immediately following recovery from allergen challenge, mice were placed in WBP chambers and Penh recorded for 12 h. Data is expressed as a) Penh average over the recording time period; b) Penh Area Under Curve. Data expressed as mean ± s.e.m. n = 14–17. Mann-Whitney U-test. *p < 0.05 wildtype Saline sensitised compared to wildtype Ovalbumin sensitised groups. #p < 0.05 CD8−/− Ovalbumin sensitised compared to wildtype Ovalbumin sensitised groups. No significant difference between groups is denoted ns
Fig. 9
Fig. 9
The Role of B-Cells in the OVA-driven Mouse Model of LAR. Immediately following recovery from allergen challenge, mice were placed in WBP chambers and Penh recorded for 12 h. Data is expressed as a) Penh average over the recording time period; b) Penh Area Under Curve. Data expressed as mean ± s.e.m. n = 12–14. Mann-Whitney U-test. *p < 0.05 wildtype Saline sensitised compared to wildtype Ovalbumin sensitised groups. #p < 0.05 wildtype Saline sensitised compared to B-cell−/−Saline sensitised groups. No significant difference between groups is denoted ns
Fig. 10
Fig. 10
The Role of Mast Cells in the OVA-driven Mouse Model of LAR. Immediately following recovery from allergen challenge, mice were placed in WBP chambers and Penh recorded for 12 h. Data is expressed as a) Penh average over the recording time period; b) Penh Area Under Curve. Data expressed as mean ± s.e.m. n = 8–12. Mann-Whitney U-test. *p < 0.05 wildtype Saline sensitised compared to wildtype Ovalbumin sensitised groups. #p < 0.05 wildtype Saline sensitised compared to Mast cell−/−Saline sensitised groups. No significant difference between groups is denoted ns
Fig. 11
Fig. 11
The Role of IgE in the OVA-driven Mouse Model of LAR. Immediately following recovery from allergen challenge, mice were placed in WBP chambers and Penh recorded for 12 h. Data is expressed as a) Penh average over the recording time period and b) Penh Area Under Curve. Data expressed as mean ± s.e.m. n = 6–9. Mann-Whitney U-test. *p < 0.05 wildtype Saline sensitised compared to wildtype Ovalbumin sensitised groups. #p < 0.05 wildtype Saline sensitised compared to IgE−/−Saline sensitised groups. No significant difference between groups is denoted ns
Fig. 12
Fig. 12
Plasma IgE Levels in IgE Deficient Mice. Following Penh recordings, blood samples were attained via cardiac puncture and plasma samples assessed for a) Total IgE and b) OVA-Specific IgE via ELISA. IgE knockout mice in comparison to wildtype groups were assessed. Data is expressed as raw absorbance values taken at 450 nm ± s.e.m. n = 6–9. Mann-Whitney U-test. *p < 0.05 wildtype Saline sensitised compared to Wildtype Ovalbumin sensitised groups. #p < 0.05 IgE−/− Ovalbumin sensitised compared to wildtype Ovalbumin sensitised groups
Fig. 13
Fig. 13
Plasma OVA-Specific IgE Levels in Cell Deficient Mice. Following Penh recordings, blood samples were attained via cardiac puncture and plasma samples assessed for OVA-Specific IgE via ELISA. Genetically modified strains in comparison to wildtype groups assessed were: a) CD4−/−; b) CD8−/−; c) B-cell−/− and d) Mast cell−/−. Data is expressed as raw absorbance values taken at 450 nm ± s.e.m. n = 6–11. Mann-Whitney U-test. *p < 0.05 wildtype Saline sensitised compared to wildtype Ovalbumin sensitised groups. #p < 0.05 Knockout Ovalbumin sensitised compared to wildtype Ovalbumin sensitised groups. No significant difference between groups is denoted ns

Similar articles

References

    1. Lemanske RF, Jr, Busse WW. 6. Asthma. J Allergy Clin Immunol. 2003;111:S502–S519. doi: 10.1067/mai.2003.94. - DOI - PMC - PubMed
    1. Levy ML, Fletcher M, Price DB, Hausen T, Halbert RJ, Yawn BP. International Primary Care Respiratory Group (IPCRG) Guidelines: diagnosis of respiratory diseases in primary care. Prim Care Respir J. 2006;15:20–34. doi: 10.1016/j.pcrj.2005.10.004. - DOI - PMC - PubMed
    1. Bateman ED, Hurd SS, Barnes PJ, Bousquet J, Drazen JM, Fitzgerald M, et al. Global strategy for asthma management and prevention: GINA executive summary. Eur Respir J. 2008;31:143–178. doi: 10.1183/09031936.00138707. - DOI - PubMed
    1. Global Initiative for Asthma. Global Strategy for Asthma Management and Prevention, 2016. Available from: http://ginasthma.org/archived-reports/.
    1. World Health Organization. Global surveillance, prevention and control of chronic respiratory diseases: a comprehensive approach, 2007. Available online at http://www.who.int/gard/publications/GARD%20Book%202007.pdf.

Publication types