

Effects of environmental enrichment on white matter glial responses in a mouse model of chronic cerebral hypoperfusion
- PMID: 28399892
- PMCID: PMC5387261
- DOI: 10.1186/s12974-017-0850-5
Effects of environmental enrichment on white matter glial responses in a mouse model of chronic cerebral hypoperfusion
Abstract
Background: This study was designed to explore the beneficial effects of environmental enrichment (EE) on white matter glial changes in a mouse model of chronic cerebral hypoperfusion induced by bilateral common carotid artery stenosis (BCAS).
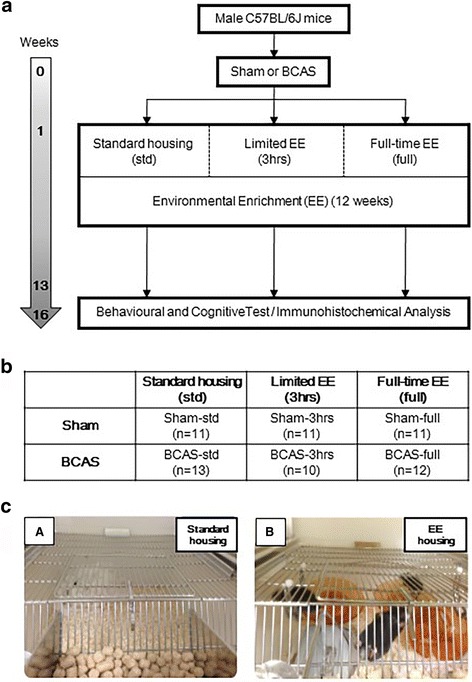
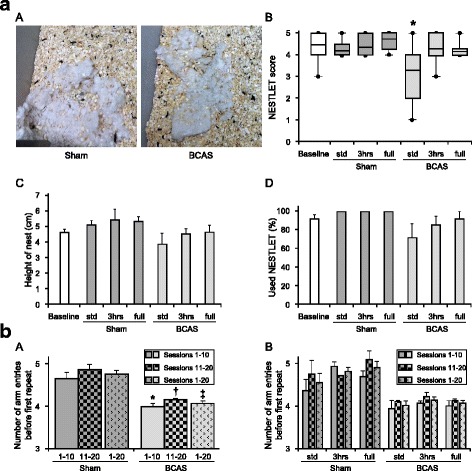
Methods: A total of 74 wild-type male C57BL/6J mice underwent BCAS or sham surgery. One week after surgery, the mice were randomly assigned into three different groups having varied amounts of EE-standard housing with no EE conditions (std), limited exposure with 3 h EE a day (3 h) and full-time exposure to EE (full) for 12 weeks. At 16 weeks after BCAS surgery, behavioural and cognitive function were assessed prior to euthanasia. Brain tissues were analysed for the degree of gliosis including morphological changes in astrocytes and microglia.
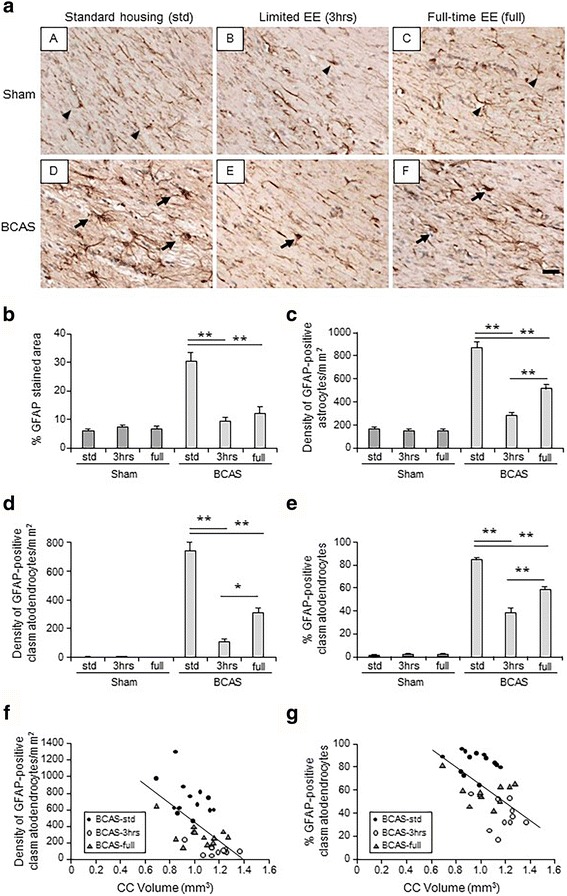
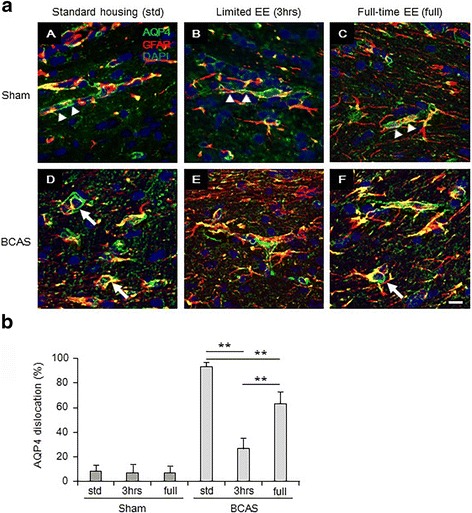
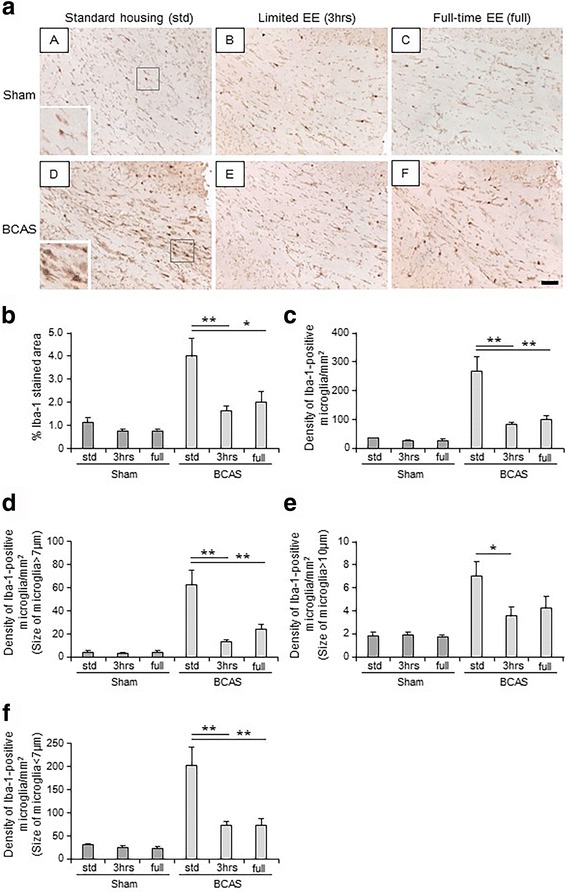
Results: Chronic cerebral hypoperfusion (or BCAS) increased clasmatodendrocytes (damaged astrocytes) with disruption of aquaporin-4 immunoreactivity and an increased degree of microglial activation/proliferation. BCAS also impaired behavioural and cognitive function. These changes were significantly attenuated, by limited exposure compared to full-time exposure to EE.
Conclusions: Our results suggest that moderate or limited exposure to EE substantially reduced glial damage/activation. Our findings also suggest moderate rather than continuous exposure to EE is beneficial for patients with subcortical ischaemic vascular dementia characterised by white matter disease-related inflammation.
Keywords: Animal model; Chronic cerebral hypoperfusion; Clasmatodendrosis; Environmental enrichment; Glial activation/proliferation.
Figures
Similar articles
-
Long-term effects of experimental carotid stenosis on hippocampal infarct pathology, neurons and glia and amelioration by environmental enrichment.Brain Res Bull. 2020 Oct;163:72-83. doi: 10.1016/j.brainresbull.2020.07.014. Epub 2020 Jul 21. Brain Res Bull. 2020. PMID: 32707262
-
The effects of environmental enrichment on white matter pathology in a mouse model of chronic cerebral hypoperfusion.J Cereb Blood Flow Metab. 2018 Jan;38(1):151-165. doi: 10.1177/0271678X17694904. Epub 2017 Mar 3. J Cereb Blood Flow Metab. 2018. PMID: 28273725 Free PMC article.
-
Ecto-5'-nucleotidase (CD73) is involved in chronic cerebral hypoperfusion-induced white matter lesions and cognitive impairment by regulating glial cell activation and pro-inflammatory cytokines.Neuroscience. 2015 Jun 25;297:118-26. doi: 10.1016/j.neuroscience.2015.03.033. Epub 2015 Mar 21. Neuroscience. 2015. PMID: 25805696
-
A brief overview of a mouse model of cerebral hypoperfusion by bilateral carotid artery stenosis.J Cereb Blood Flow Metab. 2023 Nov;43(2_suppl):18-36. doi: 10.1177/0271678X231154597. Epub 2023 Mar 8. J Cereb Blood Flow Metab. 2023. PMID: 36883344 Free PMC article. Review.
-
Environmental enrichment-inspired pharmacological tools for the treatment of addiction.Curr Opin Pharmacol. 2021 Feb;56:22-28. doi: 10.1016/j.coph.2020.09.001. Epub 2020 Sep 20. Curr Opin Pharmacol. 2021. PMID: 32966941 Review.
Cited by
-
NAD+ improves cognitive function and reduces neuroinflammation by ameliorating mitochondrial damage and decreasing ROS production in chronic cerebral hypoperfusion models through Sirt1/PGC-1α pathway.J Neuroinflammation. 2021 Sep 16;18(1):207. doi: 10.1186/s12974-021-02250-8. J Neuroinflammation. 2021. PMID: 34530866 Free PMC article.
-
Regulatory microRNAs and vascular cognitive impairment and dementia.CNS Neurosci Ther. 2020 Dec;26(12):1207-1218. doi: 10.1111/cns.13472. CNS Neurosci Ther. 2020. PMID: 33459504 Free PMC article. Review.
-
The phenomenon of clasmatodendrosis.Heliyon. 2021 Jul 19;7(7):e07605. doi: 10.1016/j.heliyon.2021.e07605. eCollection 2021 Jul. Heliyon. 2021. PMID: 34368479 Free PMC article. Review.
-
Severe white matter astrocytopathy in CADASIL.Brain Pathol. 2018 Nov;28(6):832-843. doi: 10.1111/bpa.12621. Brain Pathol. 2018. PMID: 29757481 Free PMC article.
-
Environmental enrichment and exercise are better than social enrichment to reduce memory deficits in amyloid beta neurotoxicity.Proc Natl Acad Sci U S A. 2018 Mar 6;115(10):E2403-E2409. doi: 10.1073/pnas.1718435115. Epub 2018 Feb 20. Proc Natl Acad Sci U S A. 2018. PMID: 29463708 Free PMC article.
References
-
- Yoshitake T, Kiyohara Y, Kato I, Ohmura T, Iwamoto H, Nakayama K, Ohmori S, Nomiyama K, Kawano H, Ueda K, et al. Incidence and risk factors of vascular dementia and Alzheimer’s disease in a defined elderly Japanese population: the Hisayama Study. Neurology. 1995;45:1161–8. doi: 10.1212/WNL.45.6.1161. - DOI - PubMed
Publication types
MeSH terms
Substances
LinkOut - more resources
Full Text Sources
Other Literature Sources
Research Materials
