. 2017 Apr 11;18(1):68.
doi: 10.1186/s13059-017-1203-5.

Multi-tissue DNA methylation age predictor in mouse

Collaborators, Affiliations

Multi-tissue DNA methylation age predictor in mouse

Thomas M Stubbs et al. Genome Biol. .

Abstract

Background: DNA methylation changes at a discrete set of sites in the human genome are predictive of chronological and biological age. However, it is not known whether these changes are causative or a consequence of an underlying ageing process. It has also not been shown whether this epigenetic clock is unique to humans or conserved in the more experimentally tractable mouse.

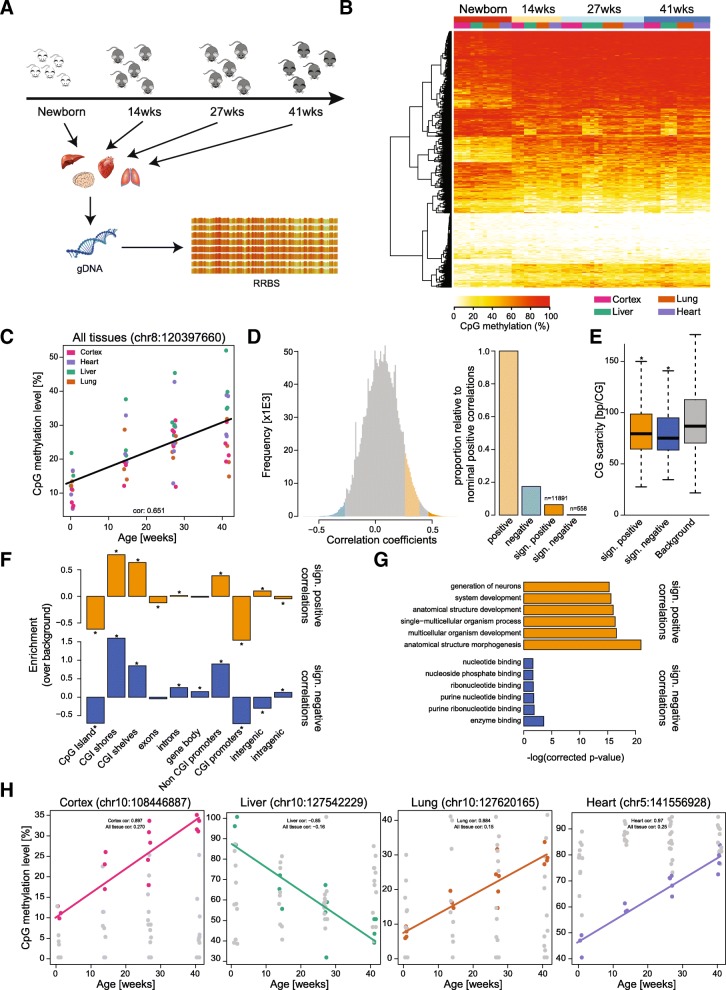
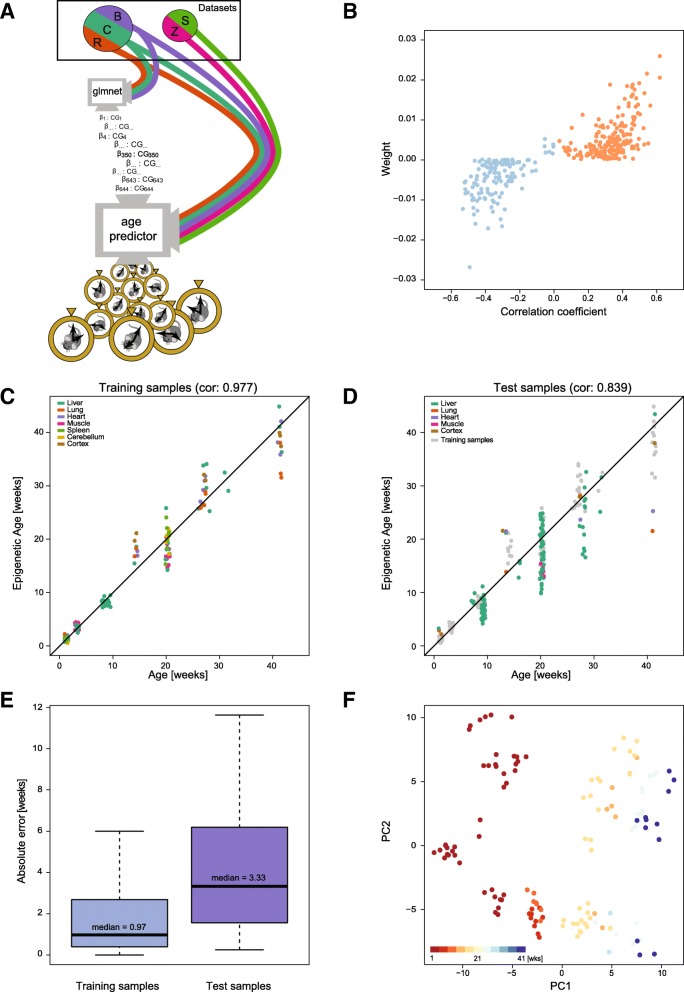
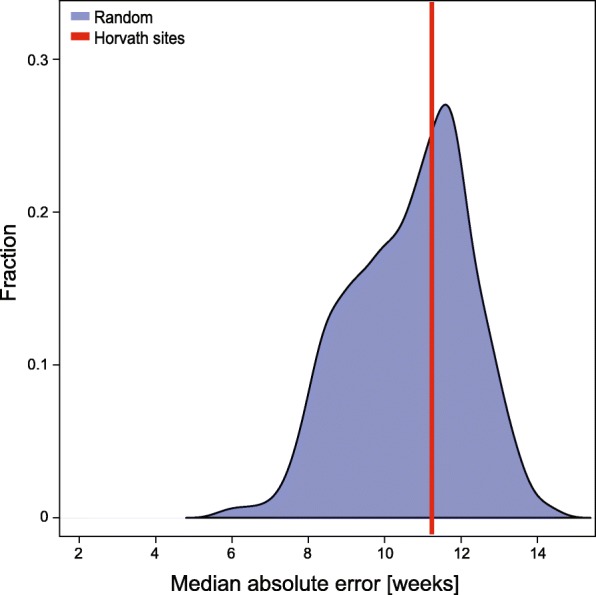
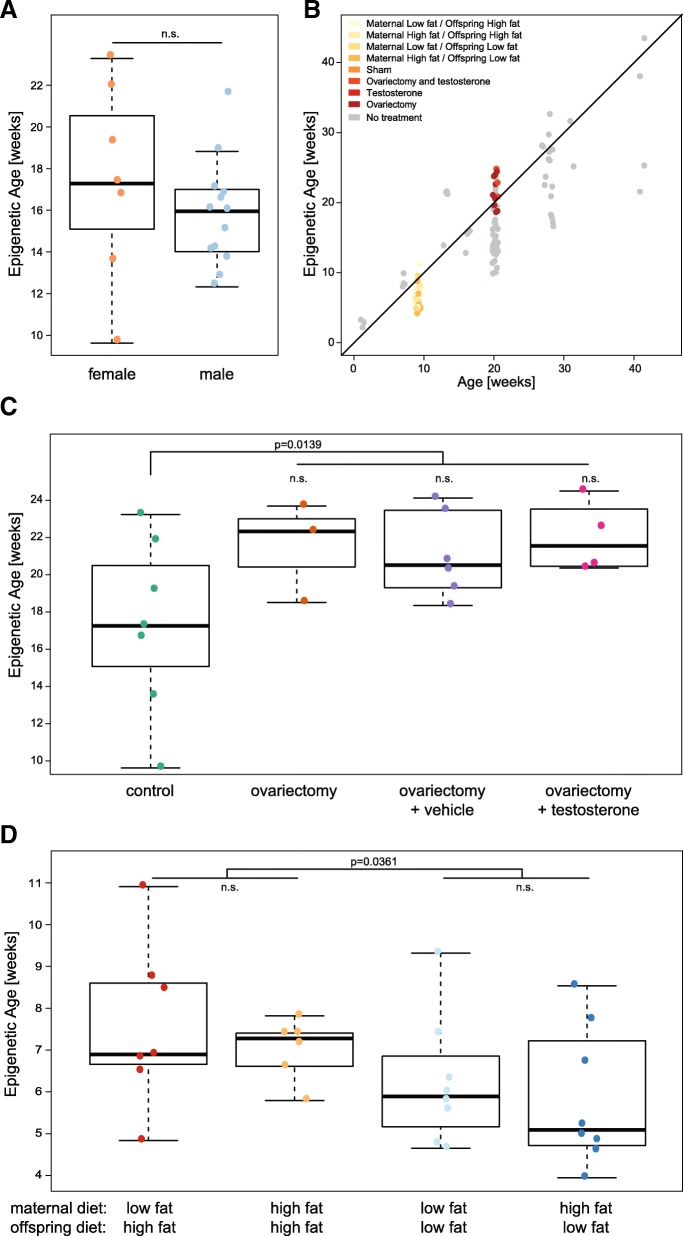
Results: We have generated a comprehensive set of genome-scale base-resolution methylation maps from multiple mouse tissues spanning a wide range of ages. Many CpG sites show significant tissue-independent correlations with age which allowed us to develop a multi-tissue predictor of age in the mouse. Our model, which estimates age based on DNA methylation at 329 unique CpG sites, has a median absolute error of 3.33 weeks and has similar properties to the recently described human epigenetic clock. Using publicly available datasets, we find that the mouse clock is accurate enough to measure effects on biological age, including in the context of interventions. While females and males show no significant differences in predicted DNA methylation age, ovariectomy results in significant age acceleration in females. Furthermore, we identify significant differences in age-acceleration dependent on the lipid content of the diet.

Conclusions: Here we identify and characterise an epigenetic predictor of age in mice, the mouse epigenetic clock. This clock will be instrumental for understanding the biology of ageing and will allow modulation of its ticking rate and resetting the clock in vivo to study the impact on biological age.

Keywords: Ageing/aging; Biological age; Chronological age; DNA methylation; Epigenetic clock; Epigenetics; High fat diet; Model; Ovariectomy; Prediction.


Figures

Fig. 1
Fig. 1
DNA methylation changes correlate with age. a Overview of the Babraham dataset. Ages of the mice are emphasised by colour. Tissues (liver, lung, heart and cortex) were isolated from mice at four distinct time points (newborn, 14 weeks, 27 weeks and 41 weeks). DNA was isolated from these tissues and reduced-representation bisulfite (RRBS) libraries were made. b Heatmap of the top 500 tissue independent age-associated correlations. Highlighted are ages and tissues, CG sites were clustered by Euclidean distance. c Single CG sites within the genome are correlated with age. Shown is an example site (chr8:120397660), with a Spearman correlation with age of 0.65. Tissues are highlighted by colour. Jitter is for aesthetic purposes only. d Overview of Spearman correlations calculated over all tissues. The distributions of correlation estimates are shown in the histogram and proportionate numbers of correlations are shown in the bar plot. Nominal correlations are highlighted (p value < 0.05) in light orange (positive) and light blue (negative). Significant correlations are highlighted (q-value < 0.05) in orange (positive) and blue (negative). Numbers provided above the bar plot represent the number of single CG sites within the given category. e Surrounding CpG content (± 500 bp) of the significantly correlated sites. Background was calculated from all CG sites with five-fold coverage in 90% of samples; CpG scarcity is defined as the average CpG distance within this 1 kb region. *Bonferroni corrected p value < 0.05. f Enrichment of a correlated CG site falling within a given genomic element. Background was all CG sites with five-fold coverage in 90% of samples. Tested using binomial test; *p value < 0.05. g Gene Ontology (GO) analysis of the significantly correlated CG sites. GO terms are plotted against –log(corrected p value). Positive correlations are shown in orange and negative in blue. The six most significant GO terms are shown. h Tissue-specific Spearman correlations with age. An example is provided of a tissue-specific correlation with age in cortex, liver, lung and heart. Correlations for these CG sites are provided for all tissues combined and for the tissue in question. Jitter is for aesthetic purposes only
Fig. 2
Fig. 2
Prediction of chronological age from a mouse epigenetic clock. a Flow chart to illustrate the steps taken in defining the model and testing it. Datasets are displayed as segments of a circle. They are coloured to correspond with later figures, namely: Reizel in brown (R), Cannon in green (C), Babraham in purple (B), Zhang in pink (Z) and Schillebeeckx in light green (S). The two independent datasets are displayed as segments in a separate circle to those datasets utilised for the training phase. The flow of methylation data is shown as colour-coded lines. Training occurs at the node (screen) with the caption: ‘glmnet’. The chosen CG sites and their corresponding weighting are passed on to the prediction tool itself (node with the caption: ‘epigenetic age predictor’. Test data enter this prediction tool and age predictions are outputted, as displayed by the pocket watches exiting this node. b Scatter plot depicting weight of chosen clock sites against their age-associated correlation, blue are negatively correlated sites and orange are positively correlated sites. c Training set ages as predicted by the model, x-axis shows the actual age and y-axis shows the predicted age, coloured by tissue. Jitter is used to represent the experimental error in age estimates. d Test set ages as predicted by the model, x-axis shows the actual age and y-axis shows the predicted age, coloured by tissue. e Box plot of the absolute error in the training (left) and test (right) samples. The median absolute error is indicated. f Principal component representation of the sites used in the clock, coloured by age in weeks
Fig. 3
Fig. 3
Prediction evaluation of the human Horvath clock sites in mouse. Shown is the MAE of the age prediction model generated using the lifted-over human clock sites [6] (red line). The distribution (blue) shows the MAEs of 1000 age-prediction models generated using random selections of 329 regions (see ‘Methods’ for further details)
Fig. 4
Fig. 4
Methylation age is affected by biological interventions. a Predicted age of 20-week-old liver samples [30], shown separately for males and females. Statistical test performed: t-test, p value of 0.58. b Age prediction in test samples from various biological intervention studies. X-axis shows the actual age and y-axis shows the predicted age, coloured by study. c Age prediction in normal female liver samples and samples which underwent an ovariectomy and were administered with either vehicle alone or testosterone [30]. Statistical test performed: Unpaired two-tailed t-test performed to assess the impact of ovariectomy, p value of 0.014. d Age prediction in diet perturbation study [29]. Liver samples from animals with following treatments were analysed: maternal high fat diet followed by adult high fat diet, maternal high fat diet followed by adult low fat diet, maternal low fat diet followed by adult high fat diet, and maternal low fat diet followed by adult low fat diet. Statistical test performed: two-way ANOVA performed, p values displayed where significant

References

    1. López-Otín C, Blasco MA, Partridge L, Serrano M, Kroemer G. The hallmarks of aging. Cell. 2013;153:1194–1217. doi: 10.1016/j.cell.2013.05.039. - DOI - PMC - PubMed
    1. Booth LN, Brunet A. The aging epigenome. Mol Cell. 2016;62:728–744. doi: 10.1016/j.molcel.2016.05.013. - DOI - PMC - PubMed
    1. Benayoun BA, Pollina EA, Brunet A. Epigenetic regulation of ageing: linking environmental inputs to genomic stability. Nat Rev Mol Cell Biol. 2015;16:593–610. doi: 10.1038/nrm4048. - DOI - PMC - PubMed
    1. Ocampo A, Reddy P, Martinez-Redondo P, Platero-Luengo A, Hatanaka F, Hishida T, et al. In vivo amelioration of age-associated hallmarks by partial reprogramming. Cell. 2016;167:1719–1733. doi: 10.1016/j.cell.2016.11.052. - DOI - PMC - PubMed
    1. Hannum G, Guinney J, Zhao L, Zhang L, Hughes G, Sadda S, et al. Genome-wide methylation profiles reveal quantitative views of human aging rates. Mol Cell. 2013;49:359–367. doi: 10.1016/j.molcel.2012.10.016. - DOI - PMC - PubMed

Publication types