. 2017 May 25;129(21):2939-2949.
doi: 10.1182/blood-2016-10-746909. Epub 2017 Apr 11.

Continuous blockade of CXCR4 results in dramatic mobilization and expansion of hematopoietic stem and progenitor cells

Affiliations

Continuous blockade of CXCR4 results in dramatic mobilization and expansion of hematopoietic stem and progenitor cells

Darja Karpova et al. Blood. .

Abstract

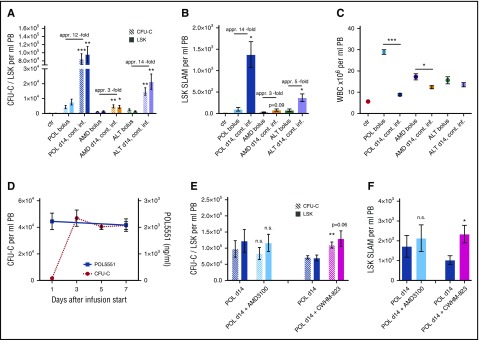
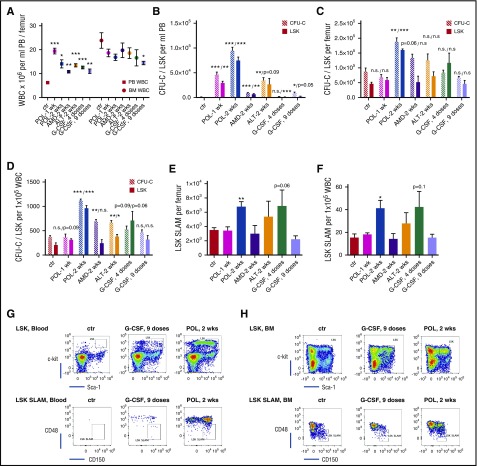
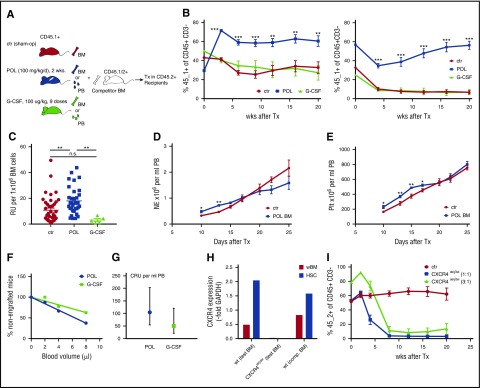
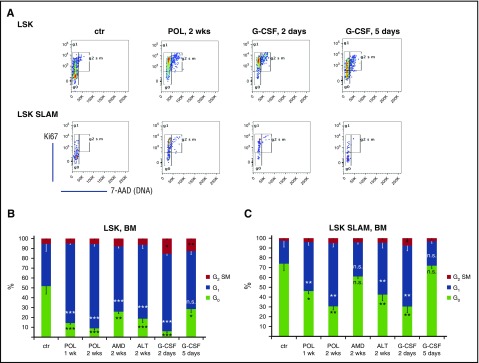
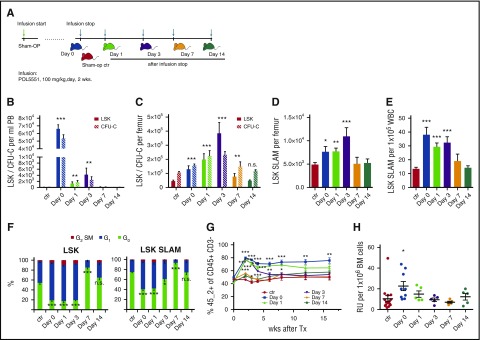
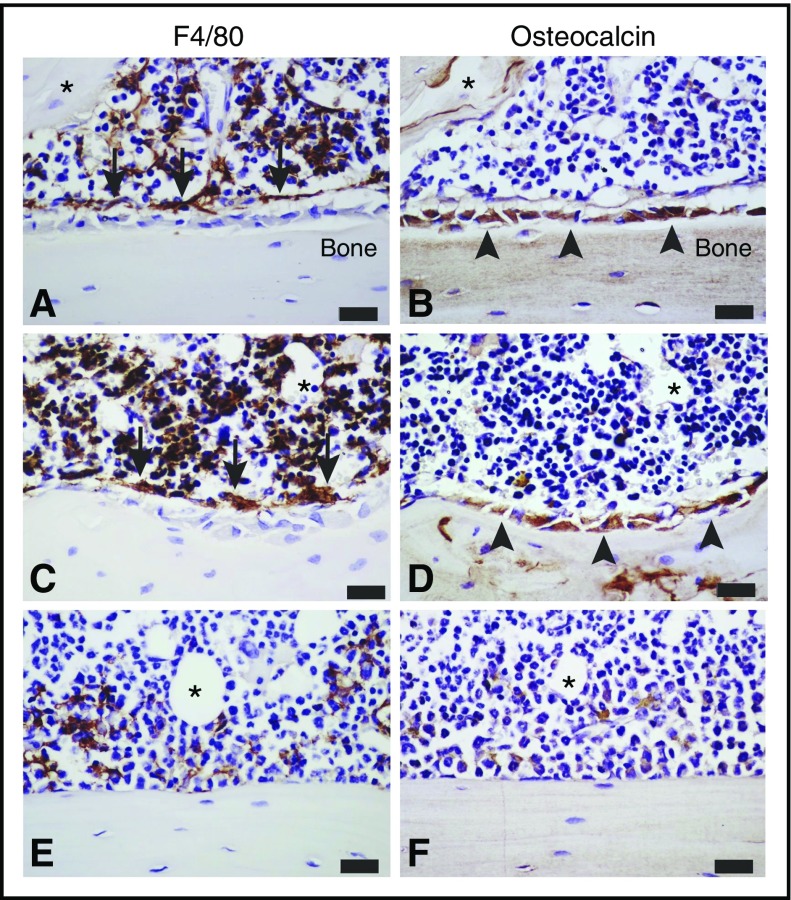
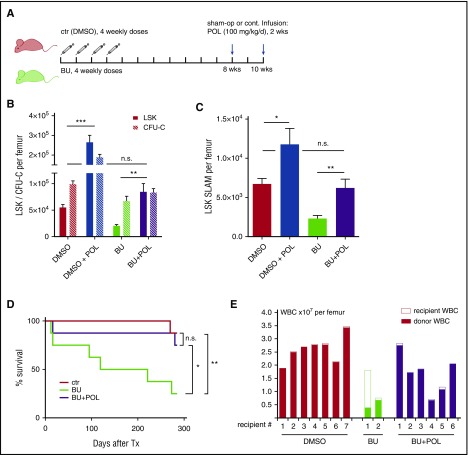
Interaction between the chemokine receptor CXCR4 and its chief ligand CXCL12 plays a critical role in the retention and migration of hematopoietic stem and progenitor cells (HSPCs) in the bone marrow (BM) microenvironment. In this study, qualitative and quantitative effects of long-term pharmacologic inhibition of the CXCR4/CXCL12 axis on the HSPC compartment were investigated by using 3 structurally unrelated small molecule CXCR4 antagonists. A >10-fold increase in mobilization efficiency was achieved by administering the antagonists as a subcutaneous continuous infusion for 2 weeks compared to a single bolus injection. A concurrent increase in self-renewing proliferation leading to a twofold to fourfold expansion of the HSPC pool in the BM was observed. The expanded BM showed a distinct repopulating advantage when tested in serial competitive transplantation experiments. Furthermore, major changes within the HSPC niche associated with previously described HSPC expansion strategies were not detected in bones treated with a CXCR4 antagonist infusion. Our data suggest that prolonged but reversible pharmacologic blockade of the CXCR4/CXCL12 axis represents an approach that releases HSPC with efficiency superior to any other known mobilization strategy and may also serve as an effective method to expand the BM HSPC pool.


Figures

Figure 1.
Figure 1.
Efficacy of CXCR4 antagonist–based mobilization regimen. (A-C) Comparison of continuous infusion (cont. inf.) and bolus injection. The CXCR4 antagonists POL5551 (POL), AMD3100 (AMD), and ALT1188 (ALT) were administered to C57BL/6 mice as a single intraperitoneal (IP) injection (POL5551, 100 mg/kg; AMD3100, 20 mg/kg; ALT1188, 33 mg/kg) or as a continuous infusion for 2 weeks via subcutaneously implanted pumps (POL5551, 100 mg/kg per day; AMD3100, 20 mg/kg per day; ALT1188, 33 mg/kg per day). Peripheral blood (PB) was analyzed (at 3 hours after injection of bolus POL5551 and ALT1188, at 1 hour after injection of bolus AMD3100, at day 14 [d14] for all groups treated by continuous infusion) for (A) CFU-C/LSK, (B) LSK SLAM, and (C) white blood cell (WBC) concentration. Corresponding counts from age- and sex-matched healthy male mice injected with vehicle or sham-operated are shown as control (ctr.) mean ± standard error of the mean (SEM) (n = 5-10 mice for treated groups; n = 15 for control mice). (D) Pharmacokinetics. C57BL/6 mice were treated with a continuous infusion of POL5551 (50 mg/kg per day for 1 week). Plasma concentration of POL5551 (solid line) was analyzed at the indicated time points. Corresponding CFU-C numbers (dotted line) are shown for comparison. (E-F) Combination of CXCR4 and VLA4 blockade. At the end of treatment with continuous infusion of POL5551 as described in (A-C), mice were randomly assigned to receive either an IP bolus injection of AMD3100 (20 mg/kg) or the VLA4 antagonist CWHM-823 (3 mg/kg). One hour later, (E) CFU-C/LSK and (F) LSK SLAM numbers were quantified. CFU-C, LSK, and LSK SLAM counts obtained before the bolus treatment (ie, from corresponding POL5551 infusion–treated mice [A-C]) are shown for comparison (mean ± SEM; n = 5). ***P < .001; **P < .01; *P < .05. appr., approximately; n.s., not significant.
Figure 2.
Figure 2.
Mobilization and expansion. C57BL/6 mice were treated with the CXCR4 antagonists POL5551 (100 mg/kg per day for 1 or 2 weeks [wks]), AMD3100 (20 mg/kg per day for 2 weeks,), and ALT1188 (ALT; 33 mg/kg per day for 2 weeks) via subcutaneous infusion pumps. Control groups received G-CSF (100 μg/kg per dose at 4 or 9 doses every 12 hours) or phosphate-buffered saline (PBS). Concurrent analysis of hematopoiesis in PB and BM was performed. (A) WBC concentration in PB and BM. Corresponding CFU-C/LSK numbers are presented in (B) PB and (C) BM. (D) CFU-C/LSK frequency in BM, (E) LSK SLAM count, and (F) LSK SLAM frequency are shown. Representative flow cytometry analyses of LSK and LSK SLAM fraction in (G) PB and (H) BM of differentially treated mice are shown (mean ± SEM; n = 3). ***P < .001; **P < .01; *P < .05.
Figure 3.
Figure 3.
Properties of expanded HSPCs. (A) Schematic presentation of competitive transplantation analysis of HSPCs from POL5551 in comparison with G-CSF treated or sham-operated (sham-op) mice. (B-C) Competitive repopulation with differentially treated BM cells. (B) Test BM (n = 3 donor mice; 5 × 10⁵ cells per recipient; CD45.1+) from control mice (sham-op) or mice treated with G-CSF (100 μg/kg per dose, 9 doses every 12 hours) or POL5551 (100 mg/kg per day for 2 weeks via pump) was mixed with competitor BM (n = 4 donor mice; 5 × 10⁵ cells per recipient; CD45.1/2+) and transplanted into lethally irradiated recipients (CD45.2+). PB chimerism analysis of the primary recipients (left) was performed at the indicated time points after transplantation. The percentage of CD45.1+ cells within the graft-derived (ie, CD45.1+ or CD45.1/2+) CD45+CD3 population is shown (data are from 1 of 7 independently performed experiments and represent the mean ± SEM of 5 mice per cohort). At 20 weeks after primary transplantation, BM of the recipients was harvested, pooled, and injected into lethally irradiated secondary (CD45.2+) recipients (2.5 × 10⁶ cells per recipient). Right panel shows PB chimerism measurement in secondary recipients (data represent the mean ± SEM of 5 mice per cohort). (C) The frequency of repopulating units in different test BM suspensions was calculated on the basis of the contribution within the B-cell lymphoid and myeloid (non–T-cell) fraction 16-20 weeks after primary transplant. Data from 7 independently performed transplant experiments (including those presented in Figure 5H) are shown for the control and POL5551-treated BM recipients (mean ± SEM of 34-41 mice per cohort for control and POL treated BM recipients; mean ± SEM of 5 mice in G-CSF BM recipient group). (D-E) Kinetics of noncompetitive engraftment. BM from POL5551 (100 mg/kg per day for 2 weeks of continuous infusion) or sham-op–treated C57BL/6 mice (CD45.2+; 4 donor mice per group) was transplanted noncompetitively into lethally irradiated recipients (CD45.1+; 1 × 10⁶ cells per recipient). Hematopoietic reconstitution was assessed by serial blood count analysis. (D) Neutrophil (NE) and (E) platelet (Plt) counts are shown (data represent the mean ± SEM of 5 recipients per group). (F-G) Competitive repopulating unit (CRU) assay: Small volumes (2, 4, or 8 μL) of POL5551 (100 mg/kg per day for 2 weeks of continuous infusion; pooled from 4 donor mice) or G-CSF (100 μg/kg per dose, 9 doses every 12 hours; pooled from 4 donor mice) mobilized blood (CD45.1+) were cotransplanted with 2.5 × 10⁵ competitor BM cells (CD45.1/2+) into lethally irradiated recipients (CD45.2+; 8-9 mice per dose per mobilizing agent). At 12 weeks after transplantation, CRU engraftment (≥0.5% engraftment in all lineages) was quantified. (F) Percentages of nonengrafted mice were plotted against blood graft volume. Data are represented by f(x) = –5.13+ 103.06 (R2 = 0.91) for G-CSF and f(x) = –7.97x+100.83 for POL5551 (R2 = 0.99). (G) Competitive repopulating unit frequency was determined by using Poisson’s statistic (LCALC software, Stem Cell Technologies) (mean ± upper or lower frequency). (H-I) Genetic blockade of CXCR4 signaling. CXCR4del/del and wild-type (wt) control mice (test BM donors) were generated by injecting tamoxifen (2 sets of 3 consecutive doses) into CXCR4flox/floxERT2Cre+ and CXCR4wt/wtERT2Cre+ mice (both CD45.2+), respectively. (H) CXCR4 expression was quantified via real-time polymerase chain reaction in unfractionated BM (wBM) and sorted HSCs (LSKCD135CD34) from test as well as CD45.1/2+ competitor (comp.) BM donors. (I) Two groups of recipients (CD45.1+) received a graft consisting of 5 × 10⁵ test (control or CXCR4del/del; pooled from 3 donor mice each) and competitor BM cells. The 3:1 group (CD45.1+) received a graft composed of 7.5 × 10⁵ CXCR4del/del and 2.5 × 10⁵ competitor cells. Shown is the CD45.2+ percentage within the graft-derived (ie, CD45.2+ or CD45.1/2+) CD45+CD3 population (data represent the mean ± SEM of 3-4 mice per cohort). ***P < .001; **P < .01; *P < .05. GAPDH, glyceraldehyde-3-phosphate dehydrogenase; RU, relative unit; Tx, treatment.
Figure 4.
Figure 4.
Cell cycle analysis. C57BL/6 mice were treated with the CXCR4 antagonists POL5551 (100 mg/kg per day for 1 or 2 weeks), AMD3100 (20 mg/kg per day for 2 weeks), and ALT1188 (33 mg/kg per day for 2 weeks) via subcutaneous infusion. Control groups received G-CSF (100 μg/kg per dose, 4 or 9 doses every 12 hours) or PBS (controls). (A) Representative Ki67 and 7-aminoactinomycin (7-AAD) staining plots gated on LSK (upper panel) or LSK SLAM (lower panel) cells in the BM of differentially treated mice. Distribution of BM (B) LSK and (C) LSK SLAM cells in G0/G1/G2/S/M phases of the cell cycle (data represent the mean ± SEM of 7 mice per cohort). ***P < .001; **P < .01; *P < .05.
Figure 5.
Figure 5.
Duration of POL5551-induced expansion. (A) Schematic presentation of washout studies. C57BL/6 mice (CD45.2+) were treated with continuous infusion of the CXCR4 antagonist POL5551 (100 mg/kg per day for 2 weeks) and either analyzed directly (day 0 group) or 1, 3, 7, or 14 days after pump removal. Control mice were sham-operated. PB and BM hematopoiesis was analyzed. CFU-C/LSK concentration in (B) blood and (C) BM is shown. (D-E) BM LSK SLAM (D) numbers and (E) frequency are shown. Corresponding cell cycle analysis was performed on BM LSK and LSK SLAM cells and (F) shows G0/G1/G2/S/M phase distribution. (G-H) At the end of the treatment described in (A), BM (test BM) was mixed at a 1:1 ratio with CD45.1/2+ competitor BM (5 × 10⁵ BM cells each per recipient) and transplanted into lethally irradiated CD45.1+ recipients. (G) The CD45.2+ percentage within the graft-derived (ie, CD45.2+ or CD45.1/2+) CD45+CD3 population was analyzed at the indicated time points after transplantation (Tx). (H) At 20 weeks after transplantation, the frequency of repopulating units in test BM suspensions was calculated on the basis of the contribution within the non–T-cell fraction (4-12 mice per treatment [test BM donor] group). The data from control and POL5551-treated BM recipients (Day 0) have also been included in calculations presented in Figure 3C (n = 3 competitor BM donor mice; data represent the mean ± SEM of 5-10 mice per transplant recipient group). ***P < .001; **P < .01; *P < .05.
Figure 6.
Figure 6.
Effects of mobilization and expansion on the BM niche. Representative images of immunohistochemistry staining for F4/80 (brown, left column) and osteocalcin (brown, right column) in serial sagittal cross-sections of the hind limb from C57BL/6 mice treated with (A-B) saline, (C-D) continuous infusion of POL5551 (100 mg/kg per day for 14 days), and (E-F) G-CSF (100 μg/kg per dose, 9 doses every 12 hours) (n = 4). All sections were counterstained with hematoxylin (blue). All images are representative of the endosteal region within the tibial metaphyseal zone. Asterisk in each serial section pair indicates trackable tissue landmarks. (A-D) In saline- and POL5551-treated mice, (B,D, arrowheads) osteocalcin-expressing osteoblasts and (A,C, arrows) F4/80-expressing macrophages can easily be discerned, and they illustrate the F4/80+ osteomac canopy structure associated with the osteoblasts. (E-F) In G-CSF–treated mice, few F4/80+ macrophages are evident, including dramatic loss of (E) osteomac canopy and (F) osteocalcin+ osteoblast-covered bone surface. Original magnification ×60. Scale bars represent 20 μm.
Figure 7.
Figure 7.
Testing of POL5551-mediated expansion in a disease model. (A) Schematic representation of the BM failure model. Young adult C57BL/6 mice (CD45.2+) were treated with 4 weekly IP doses of the alkylating agent BU (10 mg/kg). Control mice received dimethyl sulfoxide (DMSO). Eight weeks after the last BU/DMSO injection, POL5551 infusion (100 mg/kg per day for 2 weeks) was administered to 1 set of mice from each group and the other set was sham-operated. At the end of the treatment (10 weeks after last BU/DMSO injection), (B) CFU-C/LSK and (C) LSK SLAM numbers in BM were measured. Data represent the mean ± SEM of 5 mice per group. (D) BM from mice (CD45.2+ as in [A]) treated with DMSO (ctr), BU, or BU + POL5551 was transplanted noncompetitively into CD45.1+ or CD45.1/2+ hosts (1 × 10⁶ BM cells per recipient). Survival was monitored for the indicated time period (8 recipients per group at experiment start). Forty weeks later, BM composition of the recipients was analyzed. (E) Measured absolute WBC counts in the BM are shown. ***P < .001; **P < .01; *P < .05.

Similar articles

Cited by

References

    1. Spangrude GJ, Heimfeld S, Weissman IL. Purification and characterization of mouse hematopoietic stem cells. Science. 1988;241(4861):58-62. - PubMed
    1. Kauts ML, Vink CS, Dzierzak E. Hematopoietic (stem) cell development - how divergent are the roads taken? FEBS Lett. 2016;590(22):3975-3986. - PMC - PubMed
    1. Gratwohl A, Baldomero H, Gratwohl M, et al. ; Worldwide Network of Blood and Marrow Transplantation (WBMT). Quantitative and qualitative differences in use and trends of hematopoietic stem cell transplantation: a Global Observational Study. Haematologica. 2013;98(8):1282-1290. - PMC - PubMed
    1. To LB, Levesque JP, Herbert KE. How I treat patients who mobilize hematopoietic stem cells poorly. Blood. 2011;118(17):4530-4540. - PubMed
    1. Karpova D, Bonig H. Concise review: CXCR4/CXCL12 signaling in immature hematopoiesis–lessons from pharmacological and genetic models. Stem Cells. 2015;33(8):2391-2399. - PubMed

Publication types

MeSH terms