

Increased taxon sampling reveals thousands of hidden orthologs in flatworms
- PMID: 28400424
- PMCID: PMC5495077
- DOI: 10.1101/gr.216226.116
Increased taxon sampling reveals thousands of hidden orthologs in flatworms
Abstract
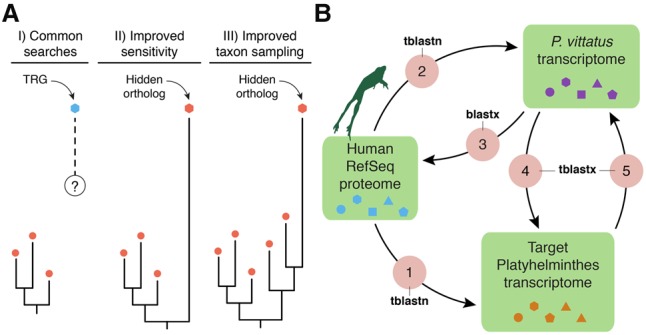
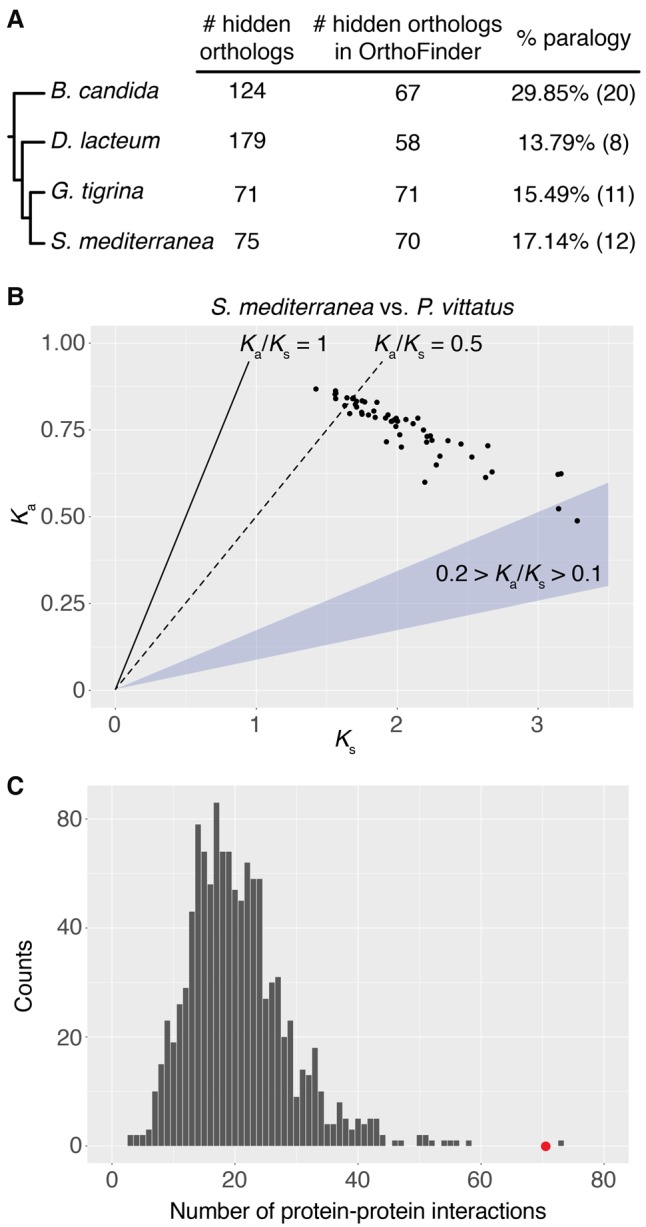
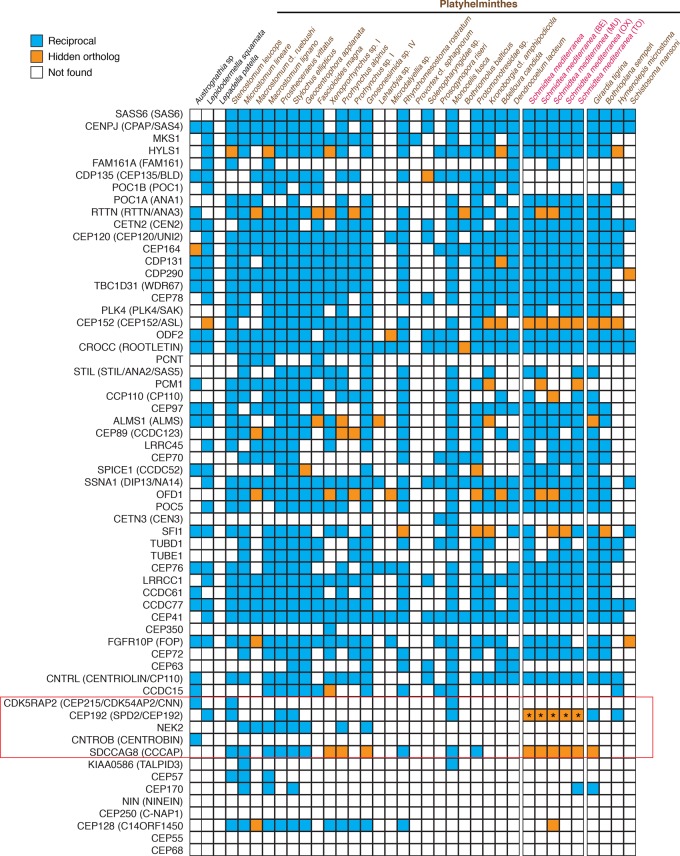
Gains and losses shape the gene complement of animal lineages and are a fundamental aspect of genomic evolution. Acquiring a comprehensive view of the evolution of gene repertoires is limited by the intrinsic limitations of common sequence similarity searches and available databases. Thus, a subset of the gene complement of an organism consists of hidden orthologs, i.e., those with no apparent homology to sequenced animal lineages-mistakenly considered new genes-but actually representing rapidly evolving orthologs or undetected paralogs. Here, we describe Leapfrog, a simple automated BLAST pipeline that leverages increased taxon sampling to overcome long evolutionary distances and identify putative hidden orthologs in large transcriptomic databases by transitive homology. As a case study, we used 35 transcriptomes of 29 flatworm lineages to recover 3427 putative hidden orthologs, some unidentified by OrthoFinder and HaMStR, two common orthogroup inference algorithms. Unexpectedly, we do not observe a correlation between the number of putative hidden orthologs in a lineage and its "average" evolutionary rate. Hidden orthologs do not show unusual sequence composition biases that might account for systematic errors in sequence similarity searches. Instead, gene duplication with divergence of one paralog and weak positive selection appear to underlie hidden orthology in Platyhelminthes. By using Leapfrog, we identify key centrosome-related genes and homeodomain classes previously reported as absent in free-living flatworms, e.g., planarians. Altogether, our findings demonstrate that hidden orthologs comprise a significant proportion of the gene repertoire in flatworms, qualifying the impact of gene losses and gains in gene complement evolution.
© 2017 Martín-Durán et al.; Published by Cold Spring Harbor Laboratory Press.
Figures


Similar articles
-
Atp8 is in the ground pattern of flatworm mitochondrial genomes.BMC Genomics. 2017 May 26;18(1):414. doi: 10.1186/s12864-017-3807-2. BMC Genomics. 2017. PMID: 28549457 Free PMC article.
-
RNA-Seq of three free-living flatworm species suggests rapid evolution of reproduction-related genes.BMC Genomics. 2020 Jul 6;21(1):462. doi: 10.1186/s12864-020-06862-x. BMC Genomics. 2020. PMID: 32631219 Free PMC article.
-
Substantial loss of conserved and gain of novel MicroRNA families in flatworms.Mol Biol Evol. 2013 Dec;30(12):2619-28. doi: 10.1093/molbev/mst155. Epub 2013 Sep 11. Mol Biol Evol. 2013. PMID: 24025793 Free PMC article.
-
Hox genes and the parasitic flatworms: new opportunities, challenges and lessons from the free-living.Parasitol Int. 2008 Mar;57(1):8-17. doi: 10.1016/j.parint.2007.09.007. Epub 2007 Oct 11. Parasitol Int. 2008. PMID: 17977060 Review.
-
Platyhelminth systematics and the emergence of new characters.Parasite. 2008 Sep;15(3):333-41. doi: 10.1051/parasite/2008153333. Parasite. 2008. PMID: 18814704 Review.
Cited by
-
Distinct genomic routes underlie transitions to specialised symbiotic lifestyles in deep-sea annelid worms.Nat Commun. 2023 May 17;14(1):2814. doi: 10.1038/s41467-023-38521-6. Nat Commun. 2023. PMID: 37198188 Free PMC article.
-
The state of Medusozoa genomics: current evidence and future challenges.Gigascience. 2022 May 17;11:giac036. doi: 10.1093/gigascience/giac036. Gigascience. 2022. PMID: 35579552 Free PMC article. Review.
-
Integrating Embryonic Development and Evolutionary History to Characterize Tentacle-Specific Cell Types in a Ctenophore.Mol Biol Evol. 2018 Dec 1;35(12):2940-2956. doi: 10.1093/molbev/msy171. Mol Biol Evol. 2018. PMID: 30169705 Free PMC article.
-
Genome-Scale Analysis Reveals Extensive Diversification of Voltage-Gated K+ Channels in Stem Cnidarians.Genome Biol Evol. 2023 Mar 3;15(3):evad009. doi: 10.1093/gbe/evad009. Genome Biol Evol. 2023. PMID: 36669828 Free PMC article.
-
PlanMine 3.0-improvements to a mineable resource of flatworm biology and biodiversity.Nucleic Acids Res. 2019 Jan 8;47(D1):D812-D820. doi: 10.1093/nar/gky1070. Nucleic Acids Res. 2019. PMID: 30496475 Free PMC article.
References
-
- Agata K, Soejima Y, Kato K, Kobayashi C, Umesono Y, Watanabe K. 1998. Structure of the planarian central nervous system (CNS) revealed by neuronal cell markers. Zoolog Sci 15: 433–440. - PubMed
-
- Altschul SF, Gish W, Miller W, Myers EW, Lipman DJ. 1990. Basic local alignment search tool. J Mol Biol 215: 403–410. - PubMed
Publication types
MeSH terms
Grants and funding
LinkOut - more resources
Full Text Sources
Other Literature Sources
Research Materials