. 2017 May 1;214(5):1297-1311.
doi: 10.1084/jem.20161141. Epub 2017 Apr 11.

TLR sensing of bacterial spore-associated RNA triggers host immune responses with detrimental effects

Affiliations

TLR sensing of bacterial spore-associated RNA triggers host immune responses with detrimental effects

Min-Kyung Choo et al. J Exp Med. .

Abstract

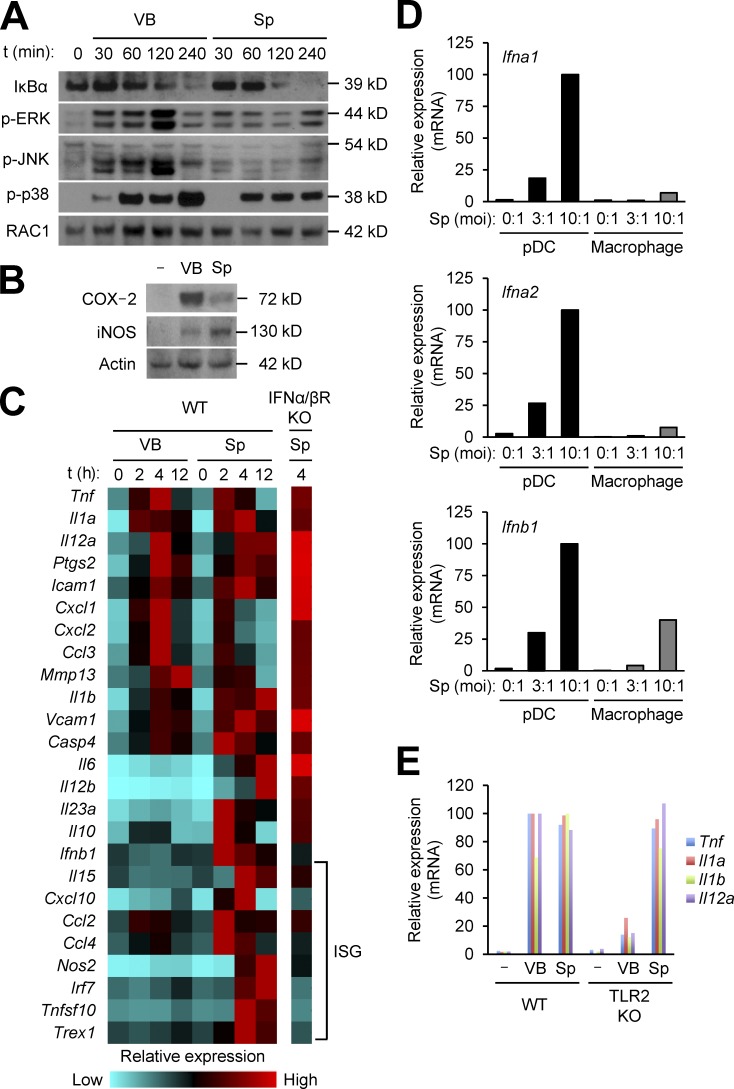
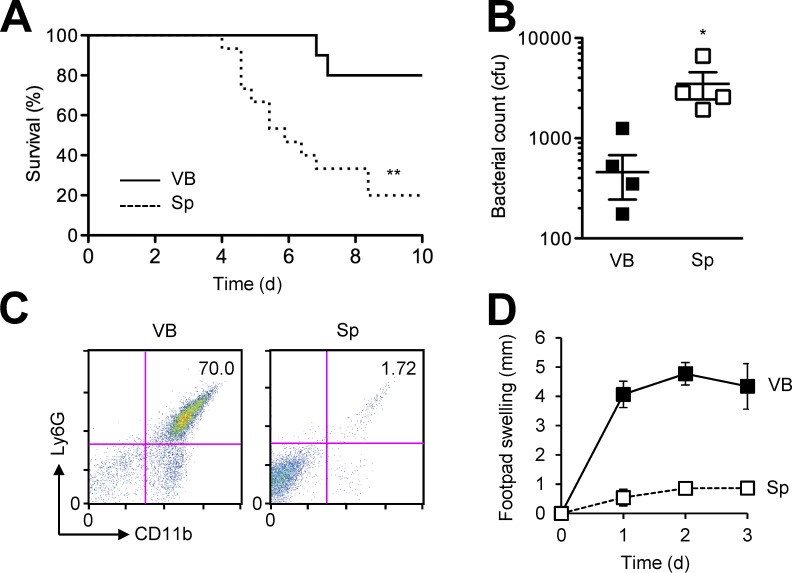
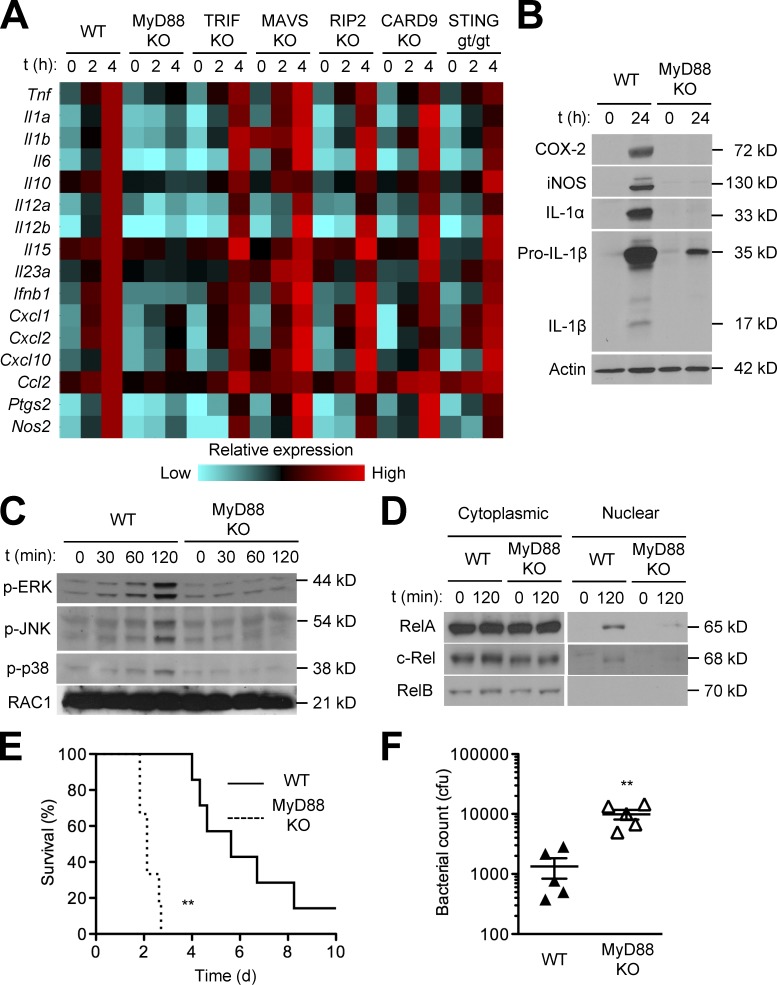
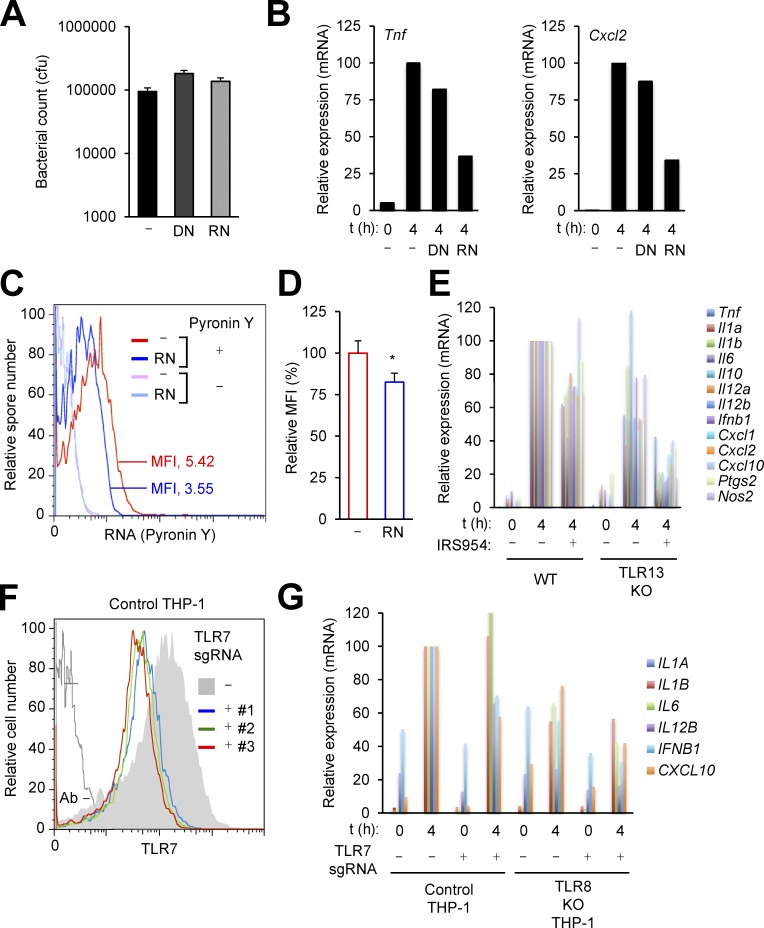
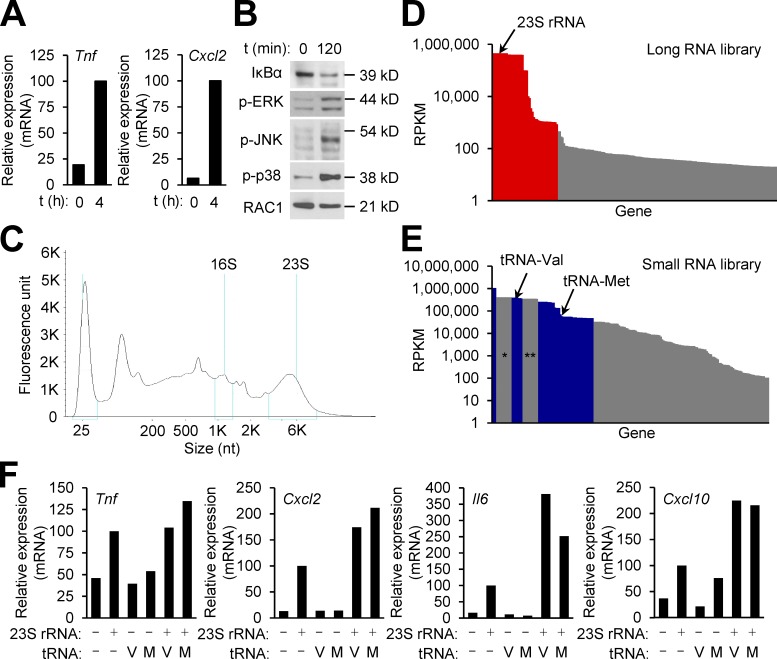
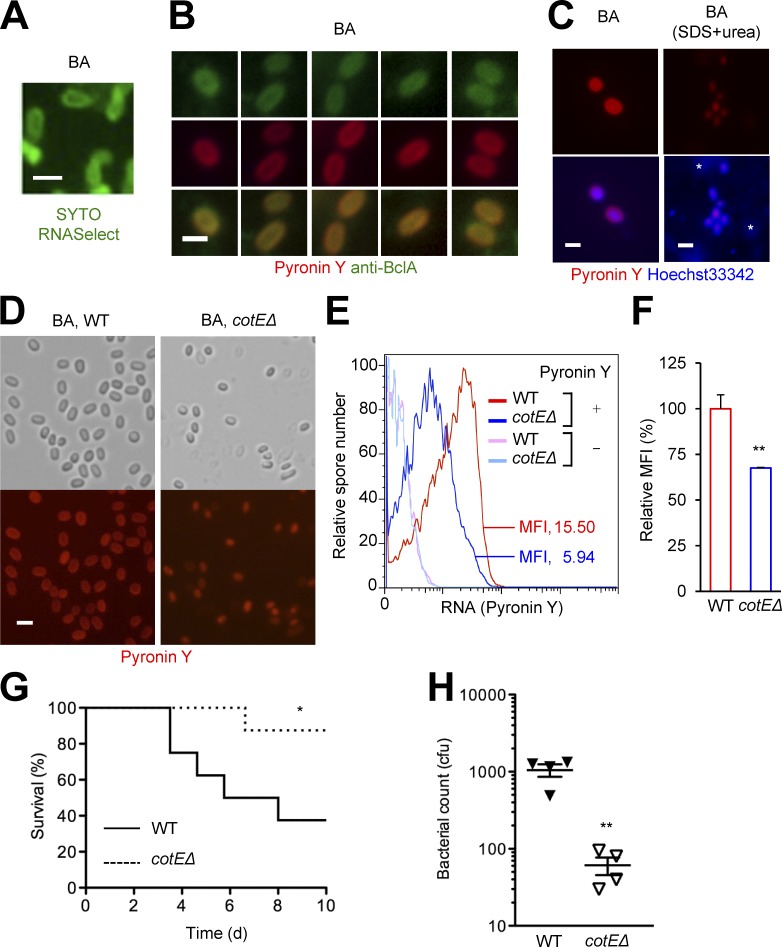
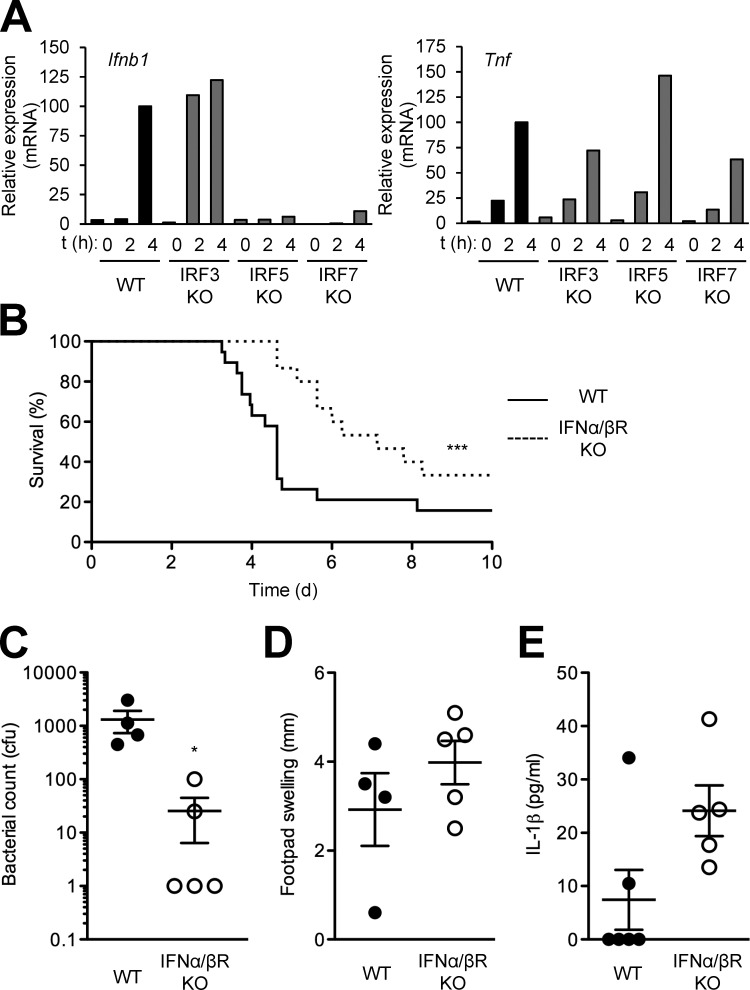
The spores of pathogenic bacteria are involved in host entry and the initial encounter with the host immune system. How bacterial spores interact with host immunity, however, remains poorly understood. Here, we show that the spores of Bacillus anthracis (BA), the etiologic agent of anthrax, possess an intrinsic ability to induce host immune responses. This immunostimulatory activity is attributable to high amounts of RNA present in the spore surface layer. RNA-sensing TLRs, TLR7, and TLR13 in mice and their human counterparts, are responsible for detecting and triggering the host cell response to BA spores, whereas TLR2 mediates the sensing of vegetative BA. BA spores, but not vegetative BA, induce type I IFN (IFN-I) production. Although TLR signaling in itself affords protection against BA, spore RNA-induced IFN-I signaling is disruptive to BA clearance. Our study suggests a role for bacterial spore-associated RNA in microbial pathogenesis and illustrates a little known aspect of interactions between the host and spore-forming bacteria.


Figures

Figure 1.
Figure 1.
BA VB and spores induce differential gene expression in macrophages via distinct microbial sensing mechanisms. (A–E) WT mouse macrophages (A, B, and D), macrophages from the indicated mice (C and E), or WT mouse plasmacytoid DCs (pDC; D) were exposed to VB or spores (Sp) of BA at moi of 3 (A–C and E) or at the indicated moi (D). Whole-cell lysates were prepared at the indicated time points (A) and 24 h (B) after exposure, and analyzed by immunoblotting. Relative mRNA amounts for VB/Sp-induced genes at the indicated time points (C) or 4 h (D and E) after exposure were determined by qPCR, and presented in color-coded arbitrary units (C) or plotted on a linear scale (D and E). ISG, IFN-stimulated gene. Data are representative of two experiments with similar results (A, B, D, and E) or from one experiment (C).
Figure 2.
Figure 2.
Spore-initiated infection results in higher BA burdens and milder inflammatory responses than VB-initiated infection. (A) Mice were infected with BA (107 cfu per host) by footpad injection of VB or spores (Sp). Host survival (n = 10–15 mice/group) was monitored for 10 d. (B–D) Mice were infected with BA (2.5 × 10⁶ cfu per host) by footpad injection of VB or Sp. Bacterial burdens in popliteal lymph nodes were determined (B) and neutrophil infiltration in footpad skin was analyzed by flow cytometry (C) 3 d after infection. Footpad swelling (n = 4 mice/group) was determined daily for 3 d (D). Data are representative of two experiments (A, B, and D) or four animals (C) with similar results. *, P < 0.05; **, P < 0.01; Log-rank test (A) and Student’s t test (B).
Figure 3.
Figure 3.
BA spore–induced signaling and gene expression in macrophages depend on MyD88, but not other signaling adaptors for microbial sensors. (A–D) Macrophages from the indicated mice were exposed to BA spores at moi of 3. Relative mRNA amounts for spore-induced genes at the indicated time points after exposure were determined by qPCR and presented in color-coded arbitrary units (A). Whole-cell lysates (B and C), and cytoplasmic and nuclear extracts (D) were prepared at the indicated time points after exposure, and analyzed by immunoblotting. (E and F) WT and MyD88-KO mice were infected with BA (107 and 2.5 × 10⁶ cfu per host; E and F, respectively) by footpad injection of spores. Host survival (n = 6–7 mice per group) was monitored for 10 d (E). Bacterial burdens in popliteal lymph nodes were determined 3 d after infection (F). Data are from one experiment (A and B) or representative of two experiments with similar results (C–F). **, P < 0.01; Log-rank test (E) and Student’s t test (F).
Figure 4.
Figure 4.
BA spore–induced macrophage gene expression depends on endosomal nucleic acidsensing TLRs. (A–C) Macrophages from the indicated mice (A and C) or WT mouse macrophages (B) were exposed to BA spores at moi of 3. Relative RNA amounts for spore-induced genes at the indicated time points after exposure were determined by qPCR, and plotted on a linear scale. Macrophages were pretreated with the following pharmacological agents 1 h before spore exposure (B): bafilomycin A1 (Bm), dynasore (Ds), z-FA-cmk (FA), and CA074-Me (CA). (D) Macrophages derived from control and UNC93B1-KO THP-1 cells were exposed to BA spores at moi of 3. Relative RNA amounts for spore-induced genes at the indicated time points after exposure were determined by qPCR, and then plotted on a linear scale. Data are representative of three experiments with similar results (A) or from one experiment (B–D).
Figure 5.
Figure 5.
BA spore–induced macrophage gene expression depends on RNA-sensing TLRs. (A–D) BA spores were treated with DNase I (DN) or RNase A (RN). Spore viability was determined after enzyme treatment (A). WT mouse macrophages were exposed to enzyme-treated BA spores at moi of 3; relative RNA amounts for spore-induced genes at the indicated time points after exposure were determined by qPCR, and plotted on a linear scale (B). Enzyme-treated spores were stained for RNA (Pyronin Y) and subjected to flow cytometry (C and D). MFI, mean fluorescence intensity. *, P < 0.05; Student’s t test. (E) Macrophages from WT and TLR13-KO mice were exposed to BA spores at moi of 3. Macrophages were pretreated with IRS954 1 h before exposure. Relative RNA amounts for spore-induced genes at the indicated time points after exposure were determined by qPCR, and plotted on a linear scale. (F and G) Control and TLR8-KO THP-1 cells were infected with lentiviruses expressing Cas9 alone (-) or TLR7-specific sgRNA (+; #1-#3). Macrophages derived from these cells were subjected to flow cytometry (F). Macrophages derived from the indicated cells were exposed to BA spores at moi of 3; relative RNA amounts for spore-induced genes at the indicated time points after exposure were determined by qPCR, and plotted on a linear scale (G). sgRNA #1 was used to disrupt the TLR7 gene (G). Data are from one experiment (A, B, and G) or representative of three experiments (C–E) or two experiments (F) with similar results.
Figure 6.
Figure 6.
BA spores harbor immunostimulatory RNA. (A and B) WT mouse macrophages were treated with RNA (1 and 0.25 µg/ml; A and B, respectively) isolated from BA spores. Relative RNA amounts for spore-induced genes at the indicated time points after exposure were determined by qPCR, and plotted on a linear scale (A). Whole-cell lysates were prepared at the indicated time points after exposure, and analyzed by immunoblotting (B). (C) BA spore RNA was analyzed by Bioanalyzer electrophoresis. The positions of bacterial rRNA and size markers are indicated at the top and bottom, respectively. (D and E) The composition of BA spore RNA was determined by RNA-Seq. The sequence reads from the long and small RNA libraries (D and E, respectively) were used to calculate RPKM values for each gene. RNA components with RPKM >20 (D) and 100 (E) are plotted. Red and blue columns correspond to the RNA components listed in Tables S1 and Table S2, respectively. * and **, columns representing degraded 23S and 16S RNA, respectively. (F) WT mouse macrophages were treated with the indicated synthetic and in vitro-transcribed RNA (1 µg/ml) isolated from BA spores. Relative RNA amounts for spore-induced genes 4 h after exposure were determined by qPCR, and plotted on a linear scale. Data are representative of two experiments with similar results (A, B, and F) or from one experiment (C–E).
Figure 7.
Figure 7.
BA spore RNA is mainly localized to the exosporium. (A–F) Spores of the indicated BA strains were stained for RNA (CYTO RNASelect and Pyronin Y), DNA (Hoechst 33342), and BclA (fluorescently labeled antibody) as indicated. Fluorescence signals from the labeling agents were analyzed by microscopy (A–D) or flow cytometry (E and F). Where indicated (C), BA spores were treated with SDS and urea before staining to eliminate the proteinaceous surface layers. *, nonspecific signals. Bar, 1 µm. MFI, mean fluorescence intensity. (G and H) Mice were infected with the indicated BA strains (107 and 2.5 × 10⁶ cfu per host; F and G, respectively) by footpad injection of spores. Host survival (n = 8 mice per group) was monitored for 10 d (G). Bacterial burdens in popliteal lymph nodes were determined 3 d after infection (H). Data are representative of three experiments (A, E, and F) or two experiments (B–D) with similar results, or from one experiment (G and H). *, P < 0.05; **, P < 0.01; Student’s t test (F and H) and Log-rank test (G).
Figure 8.
Figure 8.
BS spores do not depend on RNA for immunostimulation. (A–C) BA and BS spores were stained for RNA (Pyronin Y) and DNA (Hoechst 33342) as indicated. Fluorescence signals from the labeling agents were analyzed by microscopy (A) or flow cytometry (B and C). *, nonspecific signals. Bar, 1 µm. MFI, mean fluorescence intensity. **, P < 0.01; Student’s t test. (D and E) WT mouse macrophages (D) or macrophages from the indicated mice (E) were exposed to BA (D) or BS (D and E) spores at moi of 3. Relative mRNA amounts for spore-induced genes at the indicated time points after exposure were determined by qPCR, and presented in color-coded arbitrary units (D) or plotted on a linear scale (E). ISG, IFN-stimulated gene. Data are from one experiment (A, D, and E) or representative of three experiments (B and C) with similar results.
Figure 9.
Figure 9.
Type I interferon signaling is detrimental to host resistance to BA. (A) Macrophages from the indicated mice were exposed to BA spores at moi of 3. Relative RNA amounts for spore-induced genes at the indicated time points after exposure were determined by qPCR, and plotted on a linear scale. (B–E) The indicated mice were infected with BA (107 and 2.5 × 10⁶ cfu per host; B and C–E, respectively) by footpad injection of spores. Host survival (n = 15–19 mice per group) was monitored for 10 d (B). Bacterial burdens in popliteal lymph nodes (C), footpad swelling (D), and serum concentrations of IL-1β (E) were determined 3 d after infection. Data are from one experiment (A and E) or representative of two experiments with similar results (B–D). *, P < 0.05; ***, P < 0.001; Log-rank test (B) and Student’s t test (C).

References

    1. Atarashi K., Tanoue T., Oshima K., Suda W., Nagano Y., Nishikawa H., Fukuda S., Saito T., Narushima S., Hase K., et al. 2013. Treg induction by a rationally selected mixture of Clostridia strains from the human microbiota. Nature. 500:232–236. 10.1038/nature12331 - DOI - PubMed
    1. Basu S., Kang T.J., Chen W.H., Fenton M.J., Baillie L., Hibbs S., and Cross A.S.. 2007. Role of Bacillus anthracis spore structures in macrophage cytokine responses. Infect. Immun. 75:2351–2358. 10.1128/IAI.01982-06 - DOI - PMC - PubMed
    1. Browne H.P., Forster S.C., Anonye B.O., Kumar N., Neville B.A., Stares M.D., Goulding D., and Lawley T.D.. 2016. Culturing of ‘unculturable’ human microbiota reveals novel taxa and extensive sporulation. Nature. 533:543–546. 10.1038/nature17645 - DOI - PMC - PubMed
    1. Dixon T.C., Meselson M., Guillemin J., and Hanna P.C.. 1999. Anthrax. N. Engl. J. Med. 341:815–826. 10.1056/NEJM199909093411107 - DOI - PubMed
    1. Doi R.H., and Igarashi R.T.. 1964. Ribonucleic acids of Bacillus subtilis spores and sporulating cells. J. Bacteriol. 87:323–328. - PMC - PubMed

Publication types

Associated data