. 2017 Jun 1;77(11):2844-2856.
doi: 10.1158/0008-5472.CAN-16-2289. Epub 2017 Apr 11.

GAD1 Upregulation Programs Aggressive Features of Cancer Cell Metabolism in the Brain Metastatic Microenvironment

Affiliations

GAD1 Upregulation Programs Aggressive Features of Cancer Cell Metabolism in the Brain Metastatic Microenvironment

Patricia M Schnepp et al. Cancer Res. .

Abstract

The impact of altered amino acid metabolism on cancer progression is not fully understood. We hypothesized that a metabolic transcriptome shift during metastatic evolution is crucial for brain metastasis. Here, we report a powerful impact in this setting caused by epigenetic upregulation of glutamate decarboxylase 1 (GAD1), a regulator of the GABA neurotransmitter metabolic pathway. In cell-based culture and brain metastasis models, we found that downregulation of the DNA methyltransferase DNMT1 induced by the brain microenvironment-derived clusterin resulted in decreased GAD1 promoter methylation and subsequent upregulation of GAD1 expression in brain metastatic tumor cells. In a system to dynamically visualize cellular metabolic responses mediated by GAD1, we monitored the cytosolic NADH:NAD+ equilibrium in tumor cells. Reducing GAD1 in metastatic cells by primary glia cell coculture abolished the capacity of metastatic cells to utilize extracellular glutamine, leading to cytosolic accumulation of NADH and increased oxidative status. Similarly, genetic or pharmacologic disruption of the GABA metabolic pathway decreased the incidence of brain metastasis in vivo Taken together, our results show how epigenetic changes in GAD1 expression alter local glutamate metabolism in the brain metastatic microenvironment, contributing to a metabolic adaption that facilitates metastasis outgrowth in that setting. Cancer Res; 77(11); 2844-56. ©2017 AACR.


Figures

Figure 1
Figure 1
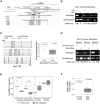
Metastatic Microenvironment Induces Metabolic Transcriptome Shift. A, Heatmap of differentially expressed metabolic genes identified from bioinformatic analysis of GSE19184. B, GSEA result of gene sets enriched in either brain metastatic or primary tumor samples arising from MDA-MB-231Br3. C, Cleveland plot of top 10 gene sets enriched in either brain metastatic or primary tumor samples arising from MDA-MB-231Br3. D, Venn diagram of gene sets enriched in the brain metastatic samples arising from indicated cell lines.
Figure 2
Figure 2
Brain Microenvironment Induces GAD1 Upregulation. A, Heat map of Reactome: GABA synthesis, release, reuptake, and degradation gene set from bioinformatic analysis of GSE19184. B, qRT-PCR validation of GAD1 mRNA expression using tissue samples of either primary or brain metastatic tumors derived from MDA-MB-231. C, qRT-PCR of GAD1 mRNA expression of tumor cells after 48 hours co-culture with either CAFs or glia cells. (left) MDA-MB-231; (right) A375SM D, (left) Cell proliferation assay of MDA-MB-231 after 48 hours of co-culture with CAF or primary glia cells. (right) Cell proliferation assay of MDA-MB-231 with or without knock-down of GAD1 by transfection with either control shRNA or GAD1-targeting shRNA prior to co-culture with primary glia cells for 48 hours with Dox-containing reduced media.
Figure 3
Figure 3
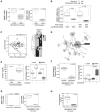
Altered Tumor Cell GAD1 Promoter Methylation and DNMT1 Expression Induced by Brain Microenvironment. A, UCSC Genome Browser plot of ENCODE data track of CpG Islands located around the GAD1 promoter. B, Promoter methylation-specific PCR (MSP) assay detecting methylation status in human GAD1 promoter region in vitro. C, (left) Bisulfite sequencing of CpG island 122 located in human GAD1 promoter region, (right) Percentage of Methylated CpG sites in sequenced region. D, MSP assay detecting methylation status in the human GAD1 promoter region in vivo. E, Bioinformatics analysis of GSE19184 showing normalized DNMT1 probe intensity in primary tumors or brain metastases arising from indicated cell lines. F, qRT-PCR of DNMT1 mRNA levels in primary tumors or brain metastases arising from MDA-MB231.
Figure 4
Figure 4
Brain Microenvironment-Induced Down-Regulation of DNMT1 Reactivates GAD1 Expression. A, qRT-PCR of DNMT1 mRNA expression after 48 hours co-culture with either CAF or glia cells. (left) MDA-MB-231; (right) A375SM. B, qRT-PCR of DNMT1 mRNA expression of MDA-MB-231 cultured either with 100% conditioned media from either CAF or glia cells or 50% mix of conditioned media and fresh media. C, Cytokine screen of glia and CAF conditioned media. (left) MA plot of Log [mean expression of Glia/CAF] of 73 cytokines analyzed. *: differentially expressed cytokines (adjusted p < 0.1) (right) Heatmap of differentially expressed cytokines. D, Network analysis of differentially expressed cytokines. E, Impact of extracellular clusterin on DNMT1 and GAD1 expression. (left) Cytokine expression profile of clusterin in conditioned media from CAFs or glia cells. (right) qPCR of GAD1 and DNMT1 mRNA expression in MDA-MB-231 cells treated with control or 200 ng of clusterin. F, qRT-PCR of GAD1 and DNMT1 mRNA expression in tumor cells genetic knockdown of glia derived-clusterin. (left) qRT-PCR of clusterin mRNA expression in glia cells. (right) qRT-PCR of GAD1 and DNMT1 mRNA expression in MDA-MB-231 cells co-cultured with control glia or siClusterin glia cells. G, qRT-PCR of mRNA levels in tumor cells after 48 hours co-culture with primary glia cells. Prior to co-culture, tumor cells were transfected with either vector control or DNMT1 over expression plasmid for 24 hours. (left) DNMT1 mRNA expression; (right) GAD1 mRNA expression under glia co-culture. H, Proliferation of MDA-MB-231 cells after DNMT1 overexpression and co-culture with glia cells for 48 hours.
Figure 5
Figure 5
GAD1 Mediates Dynamic Tumor Glutamine Metabolic Flux. A, Schematic of experimental setup. B, Heat maps of time course of changes in fluorescence ratio of Peredox biosensor throughout indicated time points. Prior to biosensor study, MDA-MB-231 were transfected with either control or GAD1 targeting siRNA for 24 hours; then co-cultured with glia cells for another 48 hours. T0: 48 hours co-culture in reduced media; T1: 15 minutes of incubation in glucose-free and glutamine-free media; T2: 15 minutes of incubation in glucose-free and 2 mM glutamine media. T3: 15 minutes of incubation in glucose-free and glutamine-free media. C, Time course measurements of green/red fluorescence ratio of Peredox biosensor in MDA-MB-231. Tumor cells were transfected, co-cultured and treated as in B. D, Representative images of immunofluorescence staining of tumor cell's phosphorylated AMPK at Thr172 (pAMPK) and tumor specific marker cytokeratin 8 (K8) at indicated time point after 48 hours co-culture with glia cells following transfection with GAD1 targeting siRNA. Time-course experiments (T0-T3) are conducted as B. E, Quantification of pAMPK fluorescence intensity in tumor cells from images in D.
Figure 6
Figure 6
Suppression of metastatic tumor cell proliferation in vitro by targeting GABA-T. A, qPCR of GABA-T mRNA expression. (left) primary tumor or brain metastatic samples arising from MDA-MB-231 cell line, (right) MDA-MB-231 cells co-cultured with either CAF or glia cells for 48 hours in reduced media. B, qPCR of GABA-T after tumors are transfected with esiRNA targeting GABA-T or control and then co-cultured with glia cells for 48 hours. (left) MDA-MB-231 cells; (right) A375SM cells. C, Proliferation of tumor cells after transfection with esiRNA targeting GABA-T or control and then co-culture with glia cells for 48 hours. (left) MDA-MB-231 cells; (right) A375SM cells. D, Proliferation of tumor cells after co-culture with glia cells and treatment of Vigabatrin, either control, 300 μM, or 600 μM. (left) MDA-MB-231 cells; (right) A375SM cells.
Figure 7
Figure 7
GAD1-Mediated Glutamine Metabolism Enables Brain Metastatic Outgrowth. A, (top) Representative images of A375SM brain metastatic tumors arising from 1:1 mix of tumor cells expressing either control (labeled with GFP) or GAD1 targeted shRNA (labeled with RFP), (bottom) Quantification of metastatic incidence. B, (top) Representative images of MDA-MB-231 brain metastatic tumors with/without GAD1 knockdown, (bottom) Quantification of metastatic incidence. C, Representative images of brain metastatic tumors arising from arising from A375SM cell after treated with vehicle control or vigabatrin (4 mg/kg) for seven days beginning at seven days post injection. D, Reduction of metastatic tumor lesions by vigabatrin. (left) representative images of haemoxyolin and eosin staining of metastatic tumors treated with either control or vigabatrin (4 mg/kg); (right) Quantification of stained tumors per section. E, Ki-67 immunohistochemistry staining of tumors arising in mice treated with either vehicle control or vigabatrin (4 mg/kg). (left) Representative images of Ki-67 staining; (right) Quantification of ki-67 positive tumor cells per region of interest. F, Proposed model of brain microenvironment-induced tumor cell metabolic shifting via clusterin-mediated epigenetic upregulation of GAD1, which contributes to brain metastatic outgrowth.

References

    1. Fidler IJ. The pathogenesis of cancer metastasis: the “seed and soil” hypothesis revisited. Nat Rev Cancer. 2003;3:453–8. - PubMed
    1. Hanahan D, Weinberg RA. Hallmarks of Cancer: The Next Generation. Cell. 2011;144:646–74. - PubMed
    1. Massagué J, Obenauf AC. Metastatic colonization by circulating tumour cells. Nature. 2016;529:298–306. - PMC - PubMed
    1. Nieman KM, Kenny HA, Penicka CV, Ladanyi A, Buell-Gutbrod R, Zillhardt MR, et al. Adipocytes promote ovarian cancer metastasis and provide energy for rapid tumor growth. Nat Med. 2011;17:1498–503. - PMC - PubMed
    1. Loo JM, Scherl A, Nguyen A, Man FY, Weinberg E, Zeng Z, et al. Extracellular Metabolic Energetics Can Promote Cancer Progression. Cell. 2015;160:393–406. - PMC - PubMed

Publication types

Substances