

Balance of microtubule stiffness and cortical tension determines the size of blood cells with marginal band across species
- PMID: 28400519
- PMCID: PMC5410777
- DOI: 10.1073/pnas.1618041114
Balance of microtubule stiffness and cortical tension determines the size of blood cells with marginal band across species
Abstract
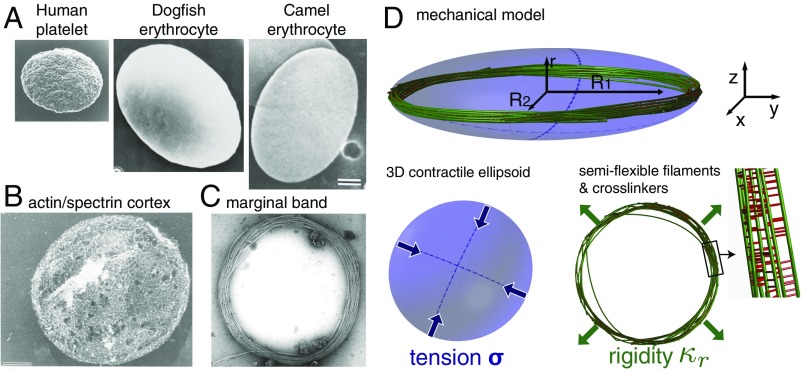
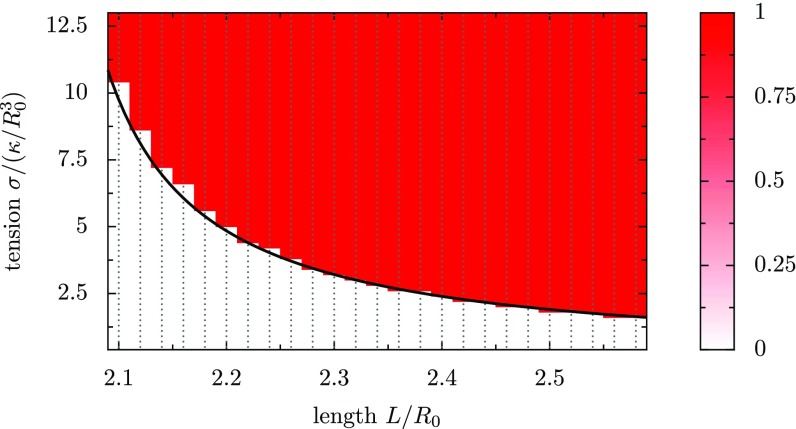
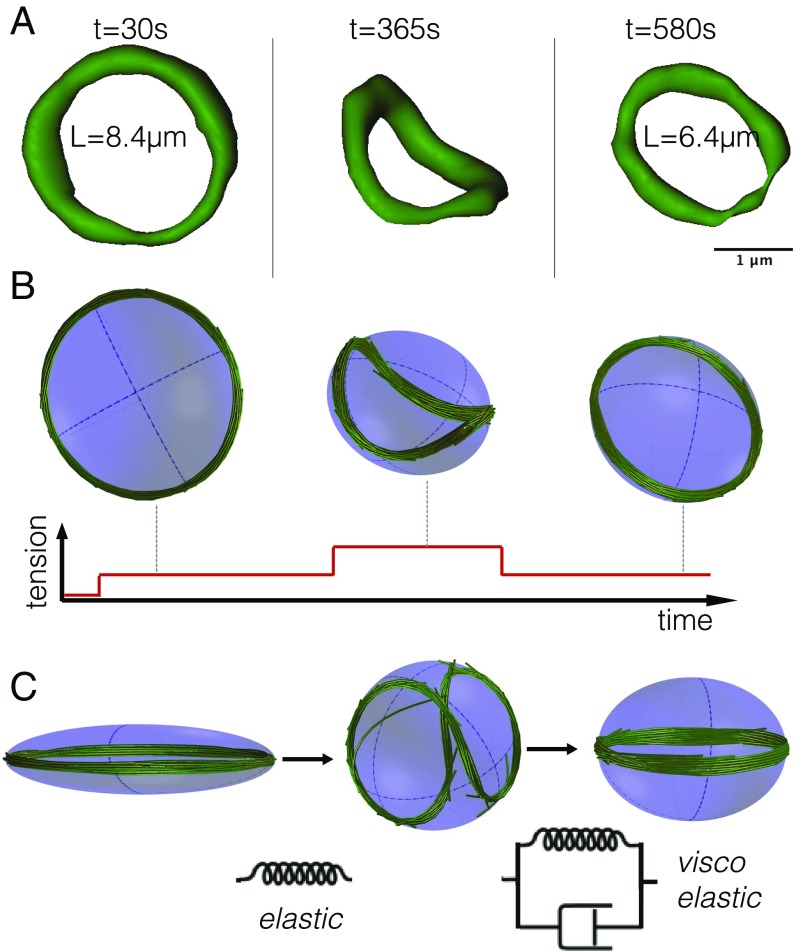
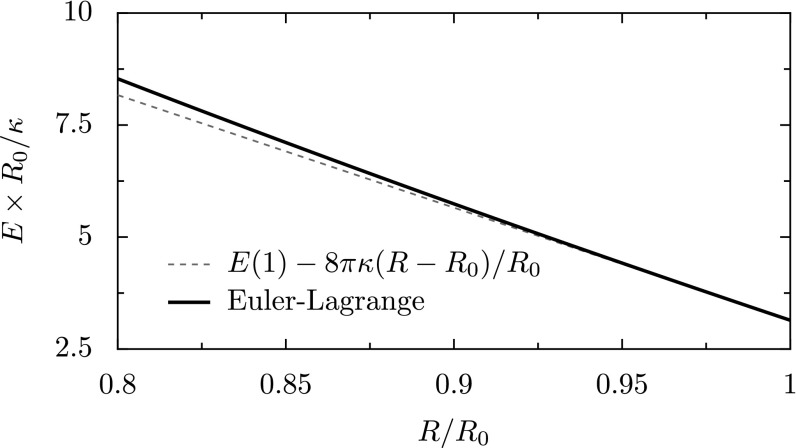
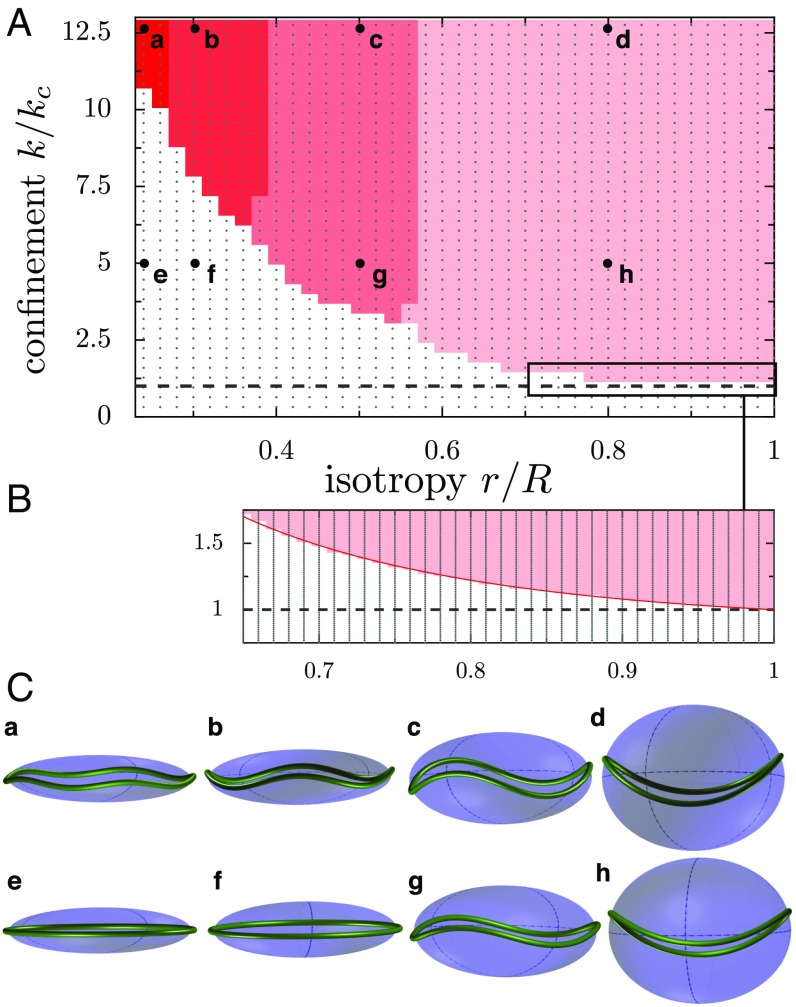
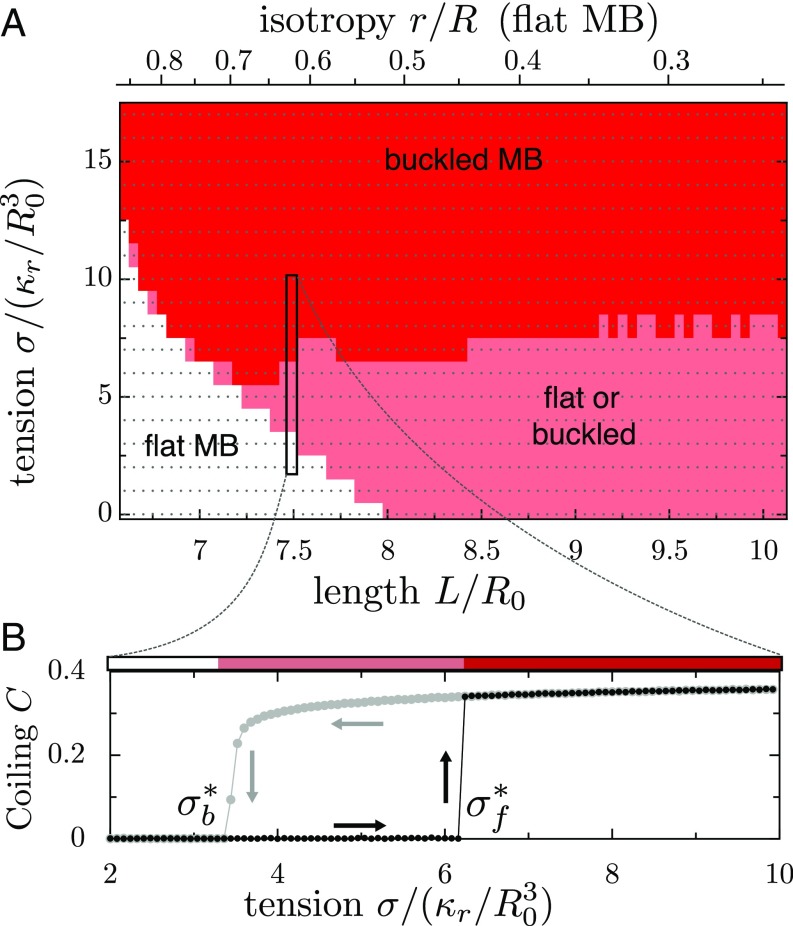
The fast bloodstream of animals is associated with large shear stresses. To withstand these conditions, blood cells have evolved a special morphology and a specific internal architecture to maintain their integrity over several weeks. For instance, nonmammalian red blood cells, mammalian erythroblasts, and platelets have a peripheral ring of microtubules, called the marginal band, that flattens the overall cell morphology by pushing on the cell cortex. In this work, we model how the shape of these cells stems from the balance between marginal band rigidity and cortical tension. We predict that the diameter of the cell scales with the total microtubule polymer and verify the predicted law across a wide range of species. Our analysis also shows that the combination of the marginal band rigidity and cortical tension increases the ability of the cell to withstand forces without deformation. Finally, we model the marginal band coiling that occurs during the disk-to-sphere transition observed, for instance, at the onset of blood platelet activation. We show that when cortical tension increases faster than cross-linkers can unbind, the marginal band will coil, whereas if the tension increases more slowly, the marginal band may shorten as microtubules slide relative to each other.
Keywords: blood platelet; cytoskeleton; mechanics; scaling; theory.
Conflict of interest statement
The authors declare no conflict of interest.
Figures

Similar articles
-
Motor-driven marginal band coiling promotes cell shape change during platelet activation.J Cell Biol. 2014 Jan 20;204(2):177-85. doi: 10.1083/jcb.201306085. Epub 2014 Jan 13. J Cell Biol. 2014. PMID: 24421335 Free PMC article.
-
Ferritin associates with marginal band microtubules.Exp Cell Res. 2007 May 1;313(8):1602-14. doi: 10.1016/j.yexcr.2007.02.021. Epub 2007 Mar 3. Exp Cell Res. 2007. PMID: 17391669
-
Method for the simulation of blood platelet shape and its evolution during activation.PLoS Comput Biol. 2018 Mar 8;14(3):e1005899. doi: 10.1371/journal.pcbi.1005899. eCollection 2018 Mar. PLoS Comput Biol. 2018. PMID: 29518073 Free PMC article.
-
New explanations for old observations: marginal band coiling during platelet activation.J Thromb Haemost. 2015 Mar;13(3):333-46. doi: 10.1111/jth.12819. Epub 2015 Jan 23. J Thromb Haemost. 2015. PMID: 25510620 Review.
-
Tubulin in Platelets: When the Shape Matters.Int J Mol Sci. 2019 Jul 16;20(14):3484. doi: 10.3390/ijms20143484. Int J Mol Sci. 2019. PMID: 31315202 Free PMC article. Review.
Cited by
-
Mechanical Counterbalance of Kinesin and Dynein Motors in a Microtubular Network Regulates Cell Mechanics, 3D Architecture, and Mechanosensing.ACS Nano. 2021 Nov 23;15(11):17528-17548. doi: 10.1021/acsnano.1c04435. Epub 2021 Oct 22. ACS Nano. 2021. PMID: 34677937 Free PMC article.
-
Patterning Microtubule Network Organization Reshapes Cell-Like Compartments.ACS Synth Biol. 2021 Jun 18;10(6):1338-1350. doi: 10.1021/acssynbio.0c00575. Epub 2021 May 14. ACS Synth Biol. 2021. PMID: 33988978 Free PMC article.
-
Microfluidic system for screening disease based on physical properties of blood.Bioimpacts. 2020;10(3):141-150. doi: 10.34172/bi.2020.18. Epub 2019 May 22. Bioimpacts. 2020. PMID: 32793436 Free PMC article.
-
Contractile ring composition dictates kinetics of in silico contractility.Biophys J. 2023 Sep 19;122(18):3611-3629. doi: 10.1016/j.bpj.2022.12.026. Epub 2022 Dec 20. Biophys J. 2023. PMID: 36540027 Free PMC article.
-
The tubulin code and its role in controlling microtubule properties and functions.Nat Rev Mol Cell Biol. 2020 Jun;21(6):307-326. doi: 10.1038/s41580-020-0214-3. Epub 2020 Feb 27. Nat Rev Mol Cell Biol. 2020. PMID: 32107477 Review.
References
-
- Lecuit T, Lenne PF. Cell surface mechanics and the control of cell shape, tissue patterns and morphogenesis. Nat Rev Mol Cell Biol. 2007;8(8):633–644. - PubMed
-
- Goniakowska-Witalinska L, Witalinski W. Evidence for a correlation between the number of marginal band microtubules and the size of vertebrate erthrocytes. J Cell Sci. 1976;22(2):397–401. - PubMed
-
- Lee KG, Miller T, Anastassov I, Cohen WD. Shape transformation and cytoskeletal reorganization in activated non-mammalian thrombocytes. Cell Biol Int. 2004;28(4):299–310. - PubMed
-
- Van Deurs B, Behnke O. The microtubule marginal band of mammalian red blood cells. Z Anat Entwicklungsgesch. 1973;143(1):43–47. - PubMed
Publication types
MeSH terms
LinkOut - more resources
Full Text Sources
Other Literature Sources
