. 2017 Apr 11;8(1):12.
doi: 10.1038/s41467-017-00025-5.

Kinetic CRAC uncovers a role for Nab3 in determining gene expression profiles during stress

Affiliations

Kinetic CRAC uncovers a role for Nab3 in determining gene expression profiles during stress

Rob van Nues et al. Nat Commun. .

Abstract

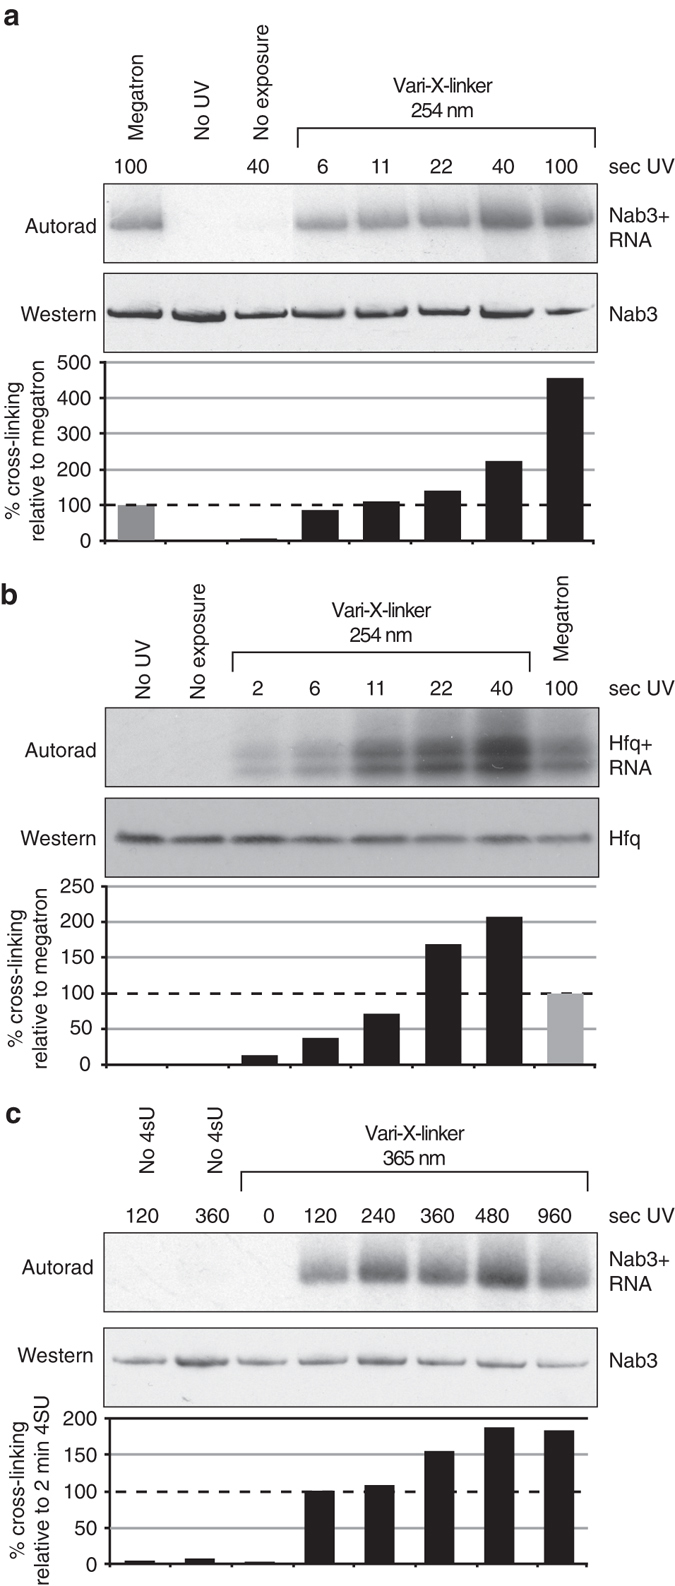
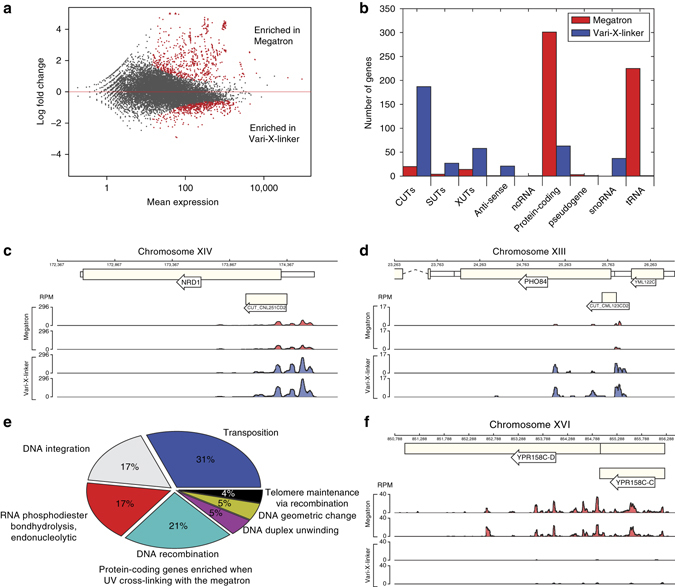
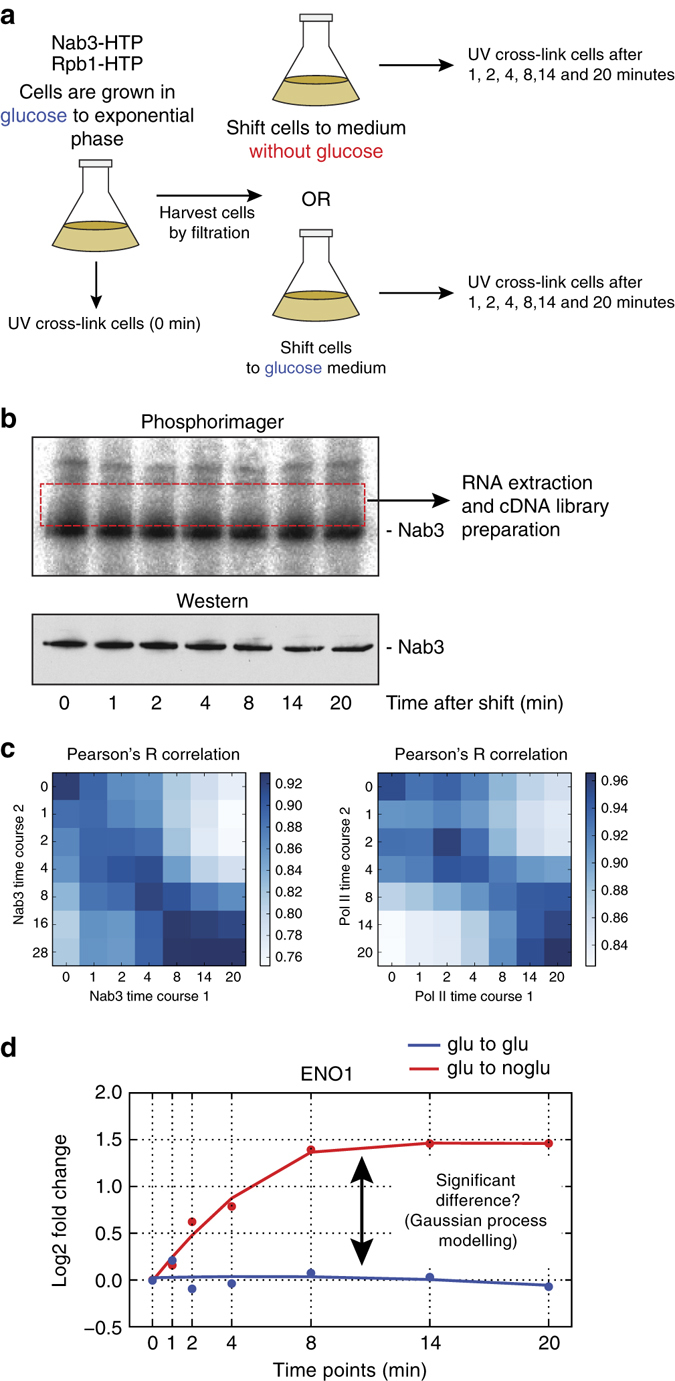
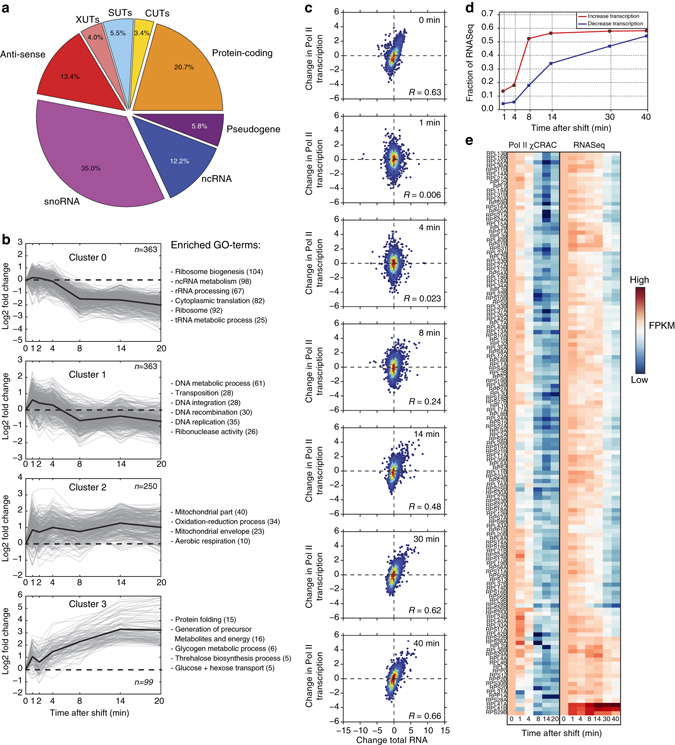
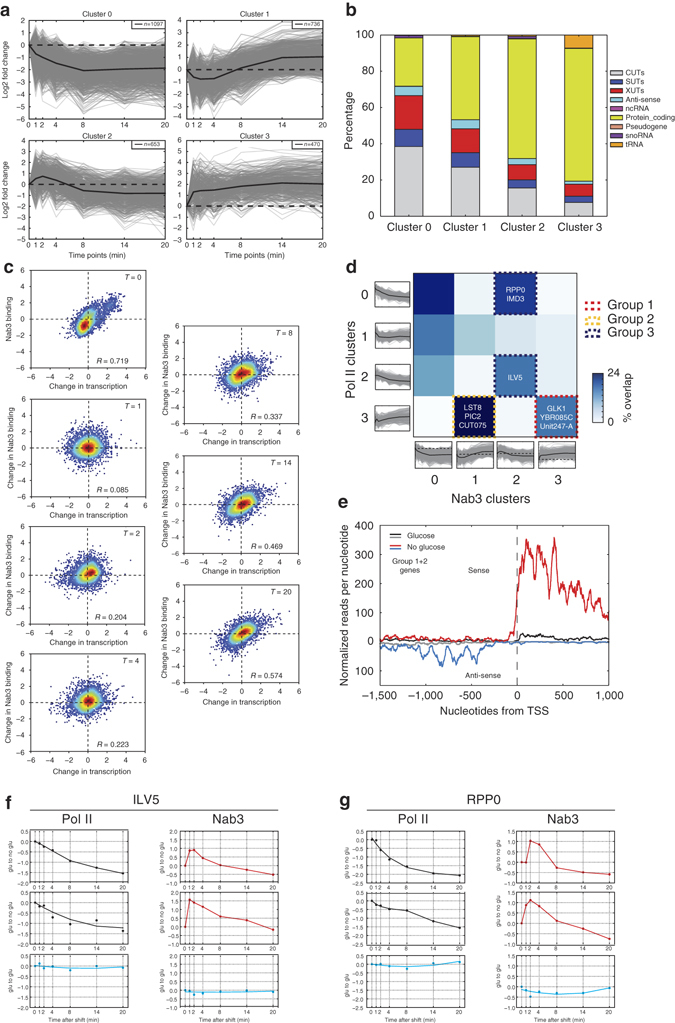
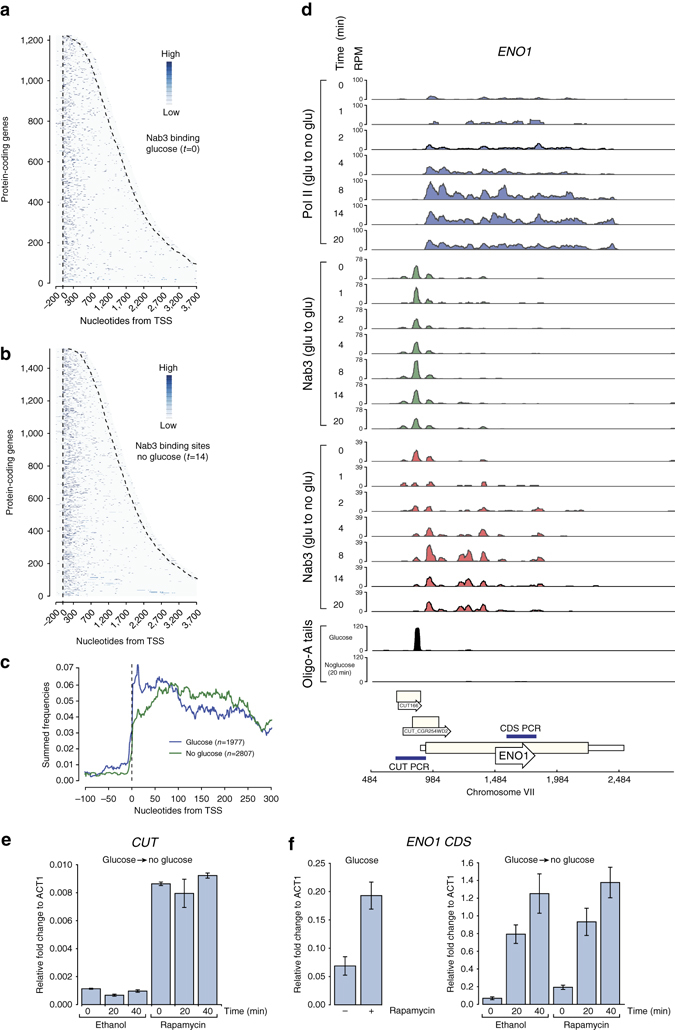
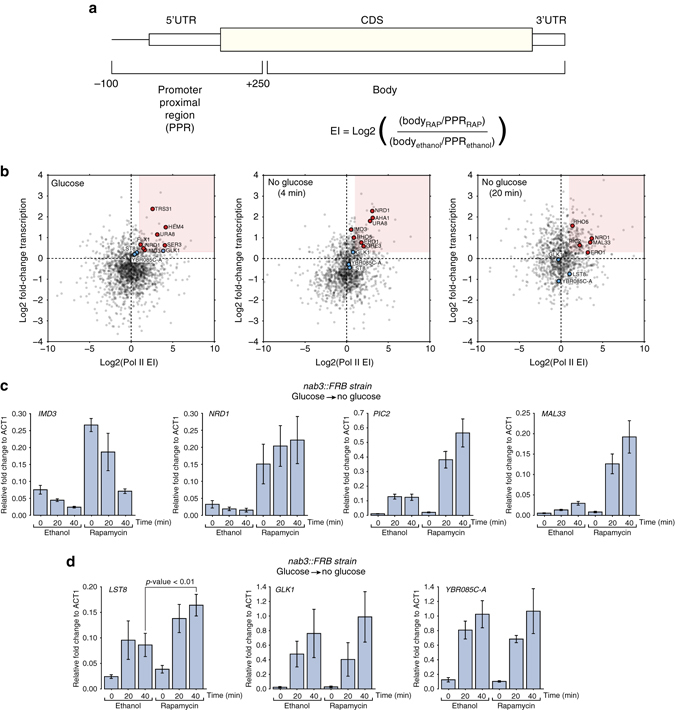
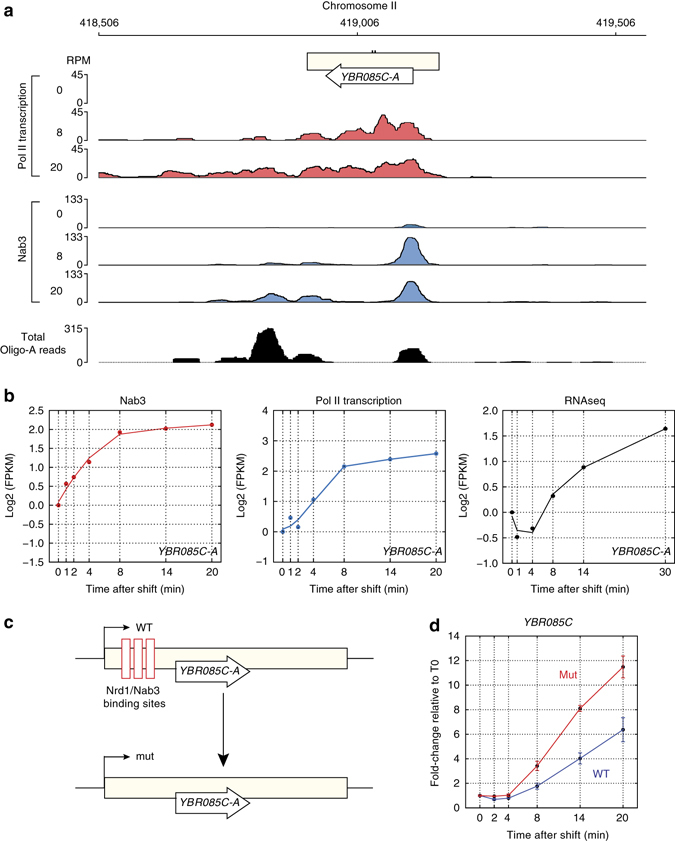
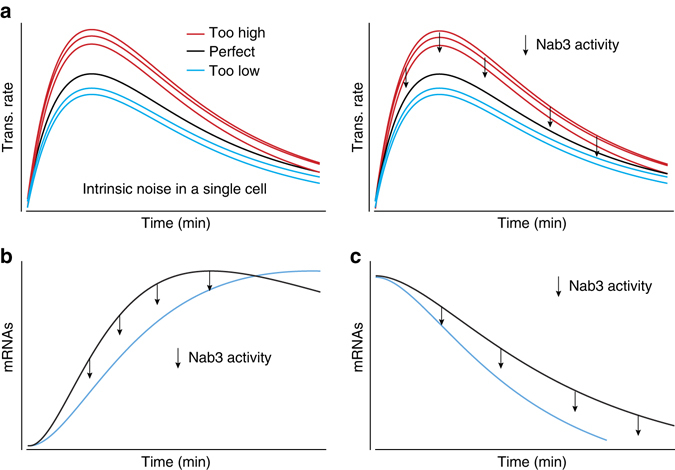
RNA-binding proteins play a key role in shaping gene expression profiles during stress, however, little is known about the dynamic nature of these interactions and how this influences the kinetics of gene expression. To address this, we developed kinetic cross-linking and analysis of cDNAs (χCRAC), an ultraviolet cross-linking method that enabled us to quantitatively measure the dynamics of protein-RNA interactions in vivo on a minute time-scale. Here, using χCRAC we measure the global RNA-binding dynamics of the yeast transcription termination factor Nab3 in response to glucose starvation. These measurements reveal rapid changes in protein-RNA interactions within 1 min following stress imposition. Changes in Nab3 binding are largely independent of alterations in transcription rate during the early stages of stress response, indicating orthogonal transcriptional control mechanisms. We also uncover a function for Nab3 in dampening expression of stress-responsive genes. χCRAC has the potential to greatly enhance our understanding of in vivo dynamics of protein-RNA interactions.Protein RNA interactions are dynamic and regulated in response to environmental changes. Here the authors describe 'kinetic CRAC', an approach that allows time resolved analyses of protein RNA interactions with minute time point resolution and apply it to gain insight into the function of the RNA-binding protein Nab3.


Conflict of interest statement

P.W. was the director and owner of UVO3 that sells equipment for water sterilization. A.L. and R.F. are employees of UVO3. P.W., A.L., and R.F. have been involved in the development of the Vari-X-linker and the filtration unit. All remaining authors declare no competing financial interests.

Figures

Fig. 1
Fig. 1
TheVari-X-linker cross-links proteins to RNA in seconds. a The Vari-X-linker standard lamps are ~10× more efficient in cross-linking proteins to RNA in vivo compared to the Megatron unit. Cells were UV irradiated in the Megatron for 100 s. Cross-linking in the Vari-X-linker was performed at the indicated times (seconds). The western blot shows that comparable amounts of Nab3 protein was purified during the CRAC experiments. The autoradiogram shows the 32P-labeled RNA cross-linked to Nab3 in each sample. These scans were used to quantify the level of cross-linking relative to the Megatron by normalizing the autoradiogram signal to the protein levels. b As in a but now monitoring the cross-linking of the E. coli Hfq protein. c Results of PAR-CLIP experiments performed using variable 365 nm UV-irradiation times, indicated in seconds. For experimental details, see the Methods section
Fig. 2
Fig. 2
TheVari-X-linker allows better detection of Nab3 binding to short-lived RNA species and reduces the induction of the DNA damage response. a DESeq2 differential expression analysis of Megatron (two replicates) and the Vari-X-linker Nab3 CRAC data (four replicates). The red dots in the plot indicate the transcripts that differentially cross-linked in data from the two different UV cross-linkers. Transcripts with positive log2-fold change values are enriched in the Megatron data, whereas transcripts with negative log2-fold change values are enriched in the Vari-X-linker data. b Feature analyses of differentially cross-linked transcripts. The bar plot shows the number of genes (y-axis) in each genomic feature (x-axis) that were found to be significantly enriched (adjusted p-value < = 0.05) in the Megatron (red bars) and the Vari-X-linker (blue bars) data. SUTs: Stable Uncharacterized Transcripts. XUTs: Xrn1 Unstable Transcripts. CUTs: Cryptic Unstable Transcripts. ncRNA: non-coding RNA. c,d Genome browser examples of CUTs that show higher Nab3 binding in the Vari-X-linker data. The y-axis shows reads per million (RPM). e Pie chart showing the significantly enriched GO-terms (FDR < 0.01) in the ~300 protein-coding transcripts enriched in the Megatron data. f Genome browser graph of Nab3 cross-linking to transcripts originating from retrotransposable elements YPR158C-C and YPR158C-D. The y-axis shows reads per million (RPM)
Fig. 3
Fig. 3
Time-resolved cross-linking analyses during glucose deprivation. a Outline of experimental set-up. Cells are grown in glucose medium to exponential phase. A fraction is cross-linked and harvested (t = 0 sample). The rest is rapidly harvested by filtration and transferred into medium lacking glucose or medium with glucose (control experiment). Subsequently, the cells were UV irradiated at the indicated times. b Nab3 cross-linking to RNA during glucose deprivation. Shown is a result of a typical χCRAC experiment. After resolving purified protein with RNAse digested radiolabeled cross-linked RNA on NuPAGE gels, the cross-linked RNA is detected by autoradiography. Western blotting was performed to ensure that comparable amounts of protein was recovered in each time-point. A cDNA library was subsequently prepared from RNA extracted from a single membrane slice containing RNA from all time-points. c Early time-points are highly correlated. The heat map shows a Pearson’s R correlation analysis of each individual time-point from Pol II and Nab3 replicate χCRAC experiments. The darker the blue color, the higher the Pearson’s correlation. Pearson correlations were calculated from log2 transformed FPKM (fragments per kilobase transcript per million reads) values. d A Gaussian process model was used to select genes that show significantly different cross-linking profiles between the control (glucose to glucose) and treated (glucose to no glucose) experiment. The example shows the ENO1 Pol II cross-linking profiles from a control (blue) and treated (red) experiment. The x-axis shows the time-points (minutes) at which samples were taken during the time-course. All data were normalized to the 0 time-point. The y-axis shows the log2-fold changes in FPKMs
Fig. 4
Fig. 4
RNA polymerase II χCRAC shows rapid changes in Pol II transcription during glucose deprivation. a The pie chart shows what percentage of each RNA class showed changes in Pol II transcription during glucose deprivation. b Pol II cross-linking profiles for protein-coding genes were generated by K-means clustering, performed using STEM. Only mRNA profiles were selected that showed a maximum fold-change of at least 1.5 and had a mean pairwise correlation over two biological replicates of 0.7. The gray lines indicate profiles from individual genes. The dark black lines show the average profile for each cluster. Enriched gene ontology (GO) terms are indicated on the right side of each graph. The y-axis shows the log2-fold change of each time-point relative to time-point 0 (glucose sample). The x-axis shows the time-points that were analyzed (minutes) during the glucose starvation time-course. c Comparison of changes in Pol II transcription (y-axis) to changes in total RNA levels (x-axis) for several time-points. Red and blue colored dots indicate high and low data point density, respectively. To compare the data sets, we Z-normalized the fragments per kilobase transcript per million reads (FPKM) values. R-values indicate Pearson correlations. d RNA degradation is a rate limiting step during the glucose deprivation response. For each time-point, we calculated what fraction of genes that showed an increase or decrease in transcription (>=2-fold) also showed a similar change in the RNASeq data (y-axis). The x-axis shows the time-points (minutes) after induction of glucose starvation that were analyzed. The red line shows the results for the transcriptionally upregulated genes. The blue line shows the results for transcriptionally downregulated genes. e Transcription of most r-protein genes is shut down within 4–8 min, but total RNA levels only decrease many minutes later. The x-axis shows the time-points (minutes) after induction of glucose starvation that were analyzed. The heat map shows a side-by-side comparison of Pol II χCRAC and RNASeq r-protein data from a glucose starvation time-course. The higher the FPKM, the redder the color. The lower the FPKM the darker blue the color. Note that the RNASeq data has two longer time-points (30 and 40 min)
Fig. 5
Fig. 5
Dynamic binding of Nab3 to many transcripts during glucose deprivation. a Clusters of all Nab3 cross-linking profiles generated by K-means clustering, performed using STEM. Only profiles were selected that showed a maximum fold-change of at least 1.5 and had a mean pairwise correlation over two biological replicates of 0.7. The y-axis shows the log2-fold change of each time-point relative to time-point 0 (glucose sample). The x-axis shows the time-points (minutes) after the shift to medium lacking glucose that were analyzed. b Bar chart indicating the percentage of different RNA classes in each cluster. c Scatter plots comparing the Nab3 binding (x-axis) to Pol II transcription (y-axis) for the indicated time-points (minutes) after inducing glucose starvation. To compare the Nab3 and Pol II time-point 0 data we Z-normalized the FPKM values. For time-points 1 to 20 we divided the FPKM values at each time-point by the time-point zero data, which were then Z-normalized. d The heat map shows what fraction of the genes belonging in each Pol II K-means cluster (y-axis) were also found in each Nab3 cluster (x-axis). Dashed lines indicate groups of genes with specific Nab3 and Pol II cross-linking profiles. e Shown is the cumulative read density of genes belonging to groups 1 and 2 around the annotated TSS. The black and gray lines show the sense and anti-sense read densities, respectively, for the glucose data. The red and blue lines show the sense and anti-sense read densities, respectively, for the glucose-deprived cells (14 min after the shift). f,g Examples of genes (ILV5 and RPP0) showing a decrease in Pol II transcription and transient cross-linking of Nab3. Biological replicates of the glucose to no glucose (black and red lines) are shown. The blue lines show data from glucose to glucose control experiments. y-axis shows fold-change relative to time-point 0
Fig. 6
Fig. 6
Nab3 binds to different sites in protein-coding transcripts during glucose deprivation. a The heat map displays the distribution of Nab3-binding sites across protein-coding genes (y-axis) that were aligned by the TSS (x-axis) and sorted by length. The dashed lines indicate the TSS and 3′-end, respectively. Shown is the glucose data (t = 0). b Same as in a but now for the t = 14 no glucose time-point. c Distribution of Nab3-binding sites around the TSS. For each Nab3 protein-coding target, the distribution frequency of the binding sites was plotted around the TSS (x-axis). These frequencies were subsequently summed (y-axis) to generate this distribution plot. The blue line indicates the data from the glucose experiment (t = 0). The green line shows the data from the no glucose t = 14 time-point. d Genome browser images showing the results of the Pol II control χCRAC experiment (top panel; blue), Nab3 control χCRAC experiment (green), the Nab3 glucose to no glucose χCRAC experiment (red) and the total amount of oligo-A tailed reads for the ENO1 gene. The time-points (minutes) at which samples were harvested after shifting the cells to medium lacking glucose is indicated on the left side of each track. e,f qRT-PCR analyses of ENO1 and upstream CUT levels. Cells were grown in glucose, treated with rapamycin or ethanol for 1 h and subsequently rapidly shifted to medium lacking glucose. RNA was extracted from cells before (0) and 20, 40 min after the shift. The qRT-PCR data were normalized to the levels of ACT1, as both the mRNA levels and the Pol II cross-linking profiles for this gene did not significantly change during the time-course (Supplementary Fig. 9a). ENO1 mRNA levels were quantified using RT-PCR oligonucleotides that amplify a region that is located downstream of the main Nab3 cross-linking sites (see d, bottom track). To detect the upstream CUT in e, we used oligonucleotides that amplify the CUT region, including the Nab3-binding sites upstream of the ENO1 TSS. The left bar in f shows the effect of Nab3 depletion on ENO1 mRNA levels in cells grown in glucose. The right bar plot in f shows the results for the whole time-course. Error bars indicate s.d. from three to four experimental replicates
Fig. 7
Fig. 7
Nab3 regulates the timing of expression of stress-responsive genes. a Schematic representation of how escape factors (EI) were calculated. For more details, see the Methods section. b Nab3 targets different transcripts during glucose deprivation. The scatter plot shows the comparison of escape indices (EIs) and changes in Pol II transcription for protein-coding genes before the shift (0) and 4 and 18 min after the shift to medium lacking glucose. The red square indicates genes that showed at least a 1.5-fold increase in transcription and an EI of at least 2. The red dots indicate genes that could potentially be attenuated by Nab3. The blue dots indicate genes that, based on the EI, are less likely to be regulated by Nab3. c Quantitative RT-PCR analyses of IMD3, NRD1, PIC2, and MAL33 transcripts during a glucose starvation experiment. Cells were grown in glucose to exponential phase, treated with rapamycin or ethanol for 1 h and subsequently rapidly shifted to medium lacking glucose (but supplemented with rapamycin). RNA was extracted from cells before (0) and 20, 40 min after the shift to medium lacking glucose. d Same as in c but now for genes that based on the calculated EI are less likely to be regulated by Nab3. Error bars indicate s.d. from three to four experimental replicates. The p-value was calculated using an Welch’s t-test on the data from the 40-min time-points
Fig. 8
Fig. 8
Nab3 induces changes in YBR085C-A expression kinetics. a Genome browser image showing the Pol II (red) and Nab3 (green) χCRAC data for the YBR085C-A region from cells harvested before (0) or 8 and 20 min after the shift to medium lacking glucose. The bottom panel shows the total number of reads with short oligo-A tails mapped to this region. b The plots show the log2-transformed FPKMs (y-axis) for the YBR085C-A transcript from the Nab3 χCRAC, Pol II χCRAC, and RNASeq data. The x-axis indicates the time (in minutes) after the shift to medium lacking glucose. c Schematic representation of how the YBR085C-A Nrd1-Nab3 site mutant was generated. Nrd1 and Nab3 motifs that overlapped with the main Nab3 cross-linking sites in the 5′ end of YBR085C-A were mutated (without changing the amino-acid sequence). d Quantitative RT-PCR results on total RNA isolated from the wild-type (WT) and YBR085C-A mutant (mut) strain during a glucose deprivation time-course. The y-axis shows fold change in signal relative to the 0 (glucose) sample. Error bars indicate s.d. from three to four experimental replicates
Fig. 9
Fig. 9
Nab3 regulates the expression of retrotransposons during glucose deprivation. a,b Violin plot showing the Pol II FPKMs for Ty1 and Ty2 retrotransposons from the nab3::frb rpo21-HTP χCRAC data generated in the presence of solvent (ethanol) or rapamycin. Shown are the averaged FPKMs from two biological replicates. Time (min) indicates the number of minutes in medium lacking glucose (but supplemented with rapamycin). The p-values were generated using Welch’s t-test. c,d Dynamic cross-linking of Nab3 to Ty1 and Ty2. The violin plot shows Ty1 and Ty2 FPKM distribution from a Nab3 χCRAC time-course experiment. The Nab3 χCRAC data were normalized to the average Pol II ethanol data shown in a,b. e,f Quantitative RT-PCR analysis of Ty1 and Ty2 retrotransposon transcript levels during a glucose starvation time-course. The x-axis shows the time (minutes) after the shift to medium lacking glucose at which samples were harvested. The p-values were generated using a Welch’s t-test. g,h Plots showing the distribution of Nab3 motifs (CUUG and UCUU; panel I), Nab3 cross-linking and Pol II cross-linking to Ty1 and Ty2 transcripts. To normalize for transcript lengths, each gene was divided into 1000 bins (x-axis). Roman numerals indicate the results from individual experiments. The black plots show the Pol II profiles for cells grown in glucose in the presence or absence of rapamycin. The red plots show the Pol II profiles 20 min after the shift to medium lacking glucose, in the presence or absence of rapamycin. For each Ty transcript we calculated the fraction of reads that mapped to each bin for each individual transcript. These were subsequently summed (y-axis) to generate these profiles
Fig. 10
Fig. 10
Models for how Nab3 could contribute to regulating gene expression during stress. a Shown is a schematic representation of typical gene expression profiles observed during stress responses. The black lines in the plots indicate the ideal gene expression profile. The red and cyan lines indicate variability in gene expression (either too high or too low). Here, Nab3-dependent transcription termination may function to prevent transcription from over-shooting. b,c Nab3 activity could also contribute to stress adaptation by either dampening the expression of a gene b, which would increase the response time, or its termination activity could contribute to rapidly shutting down expression of genes that are downregulated during stress c

Similar articles

Cited by

References

    1. Castello A, Fischer B, Hentze MW, Preiss T. RNA-binding proteins in Mendelian disease. Trends Genet. 2013;29:318–327. doi: 10.1016/j.tig.2013.01.004. - DOI - PubMed
    1. Pérez-Ortín JE, de Miguel-Jiménez L, Chávez S. Genome-wide studies of mRNA synthesis and degradation in eukaryotes. Biochim. Biophys. Acta. 2012;1819:604–615. doi: 10.1016/j.bbagrm.2011.12.002. - DOI - PubMed
    1. Marguerat S, Lawler K, Brazma A, Bähler J. Contributions of transcription and mRNA decay to gene expression dynamics of fission yeast in response to oxidative stress. RNA Biol. 2014;11:702–714. doi: 10.4161/rna.29196. - DOI - PMC - PubMed
    1. Kresnowati MTAP, et al. When transcriptome meets metabolome: fast cellular responses of yeast to sudden relief of glucose limitation. Mol. Syst. Biol. 2006;2:49. doi: 10.1038/msb4100083. - DOI - PMC - PubMed
    1. Ule J, et al. CLIP identifies Nova-regulated RNA networks in the brain. Science. 2003;302:1212–1215. doi: 10.1126/science.1090095. - DOI - PubMed

Publication types

MeSH terms