. 2017 Apr 11;7(1):834.
doi: 10.1038/s41598-017-00970-7.

Moderate lifelong overexpression of tuberous sclerosis complex 1 (TSC1) improves health and survival in mice

Affiliations

Moderate lifelong overexpression of tuberous sclerosis complex 1 (TSC1) improves health and survival in mice

Hong-Mei Zhang et al. Sci Rep. .

Abstract

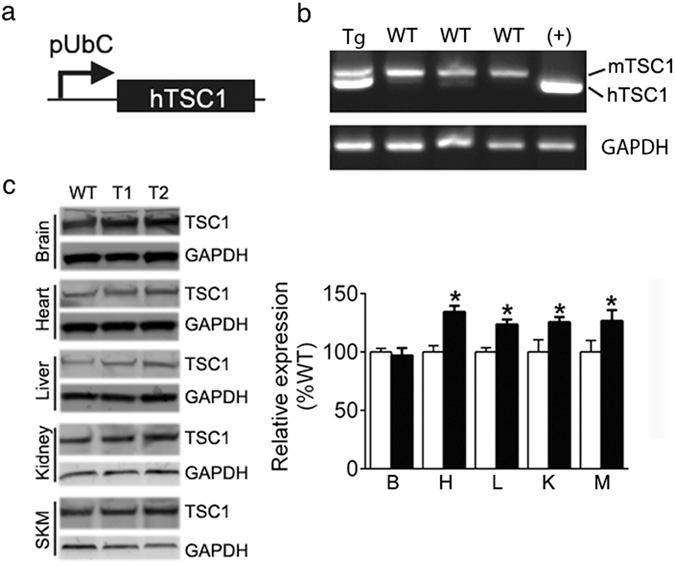
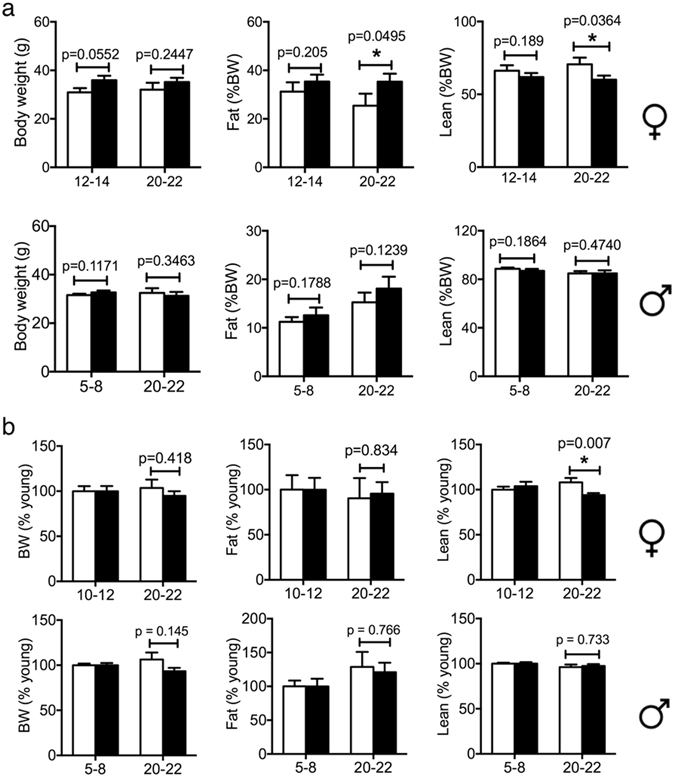
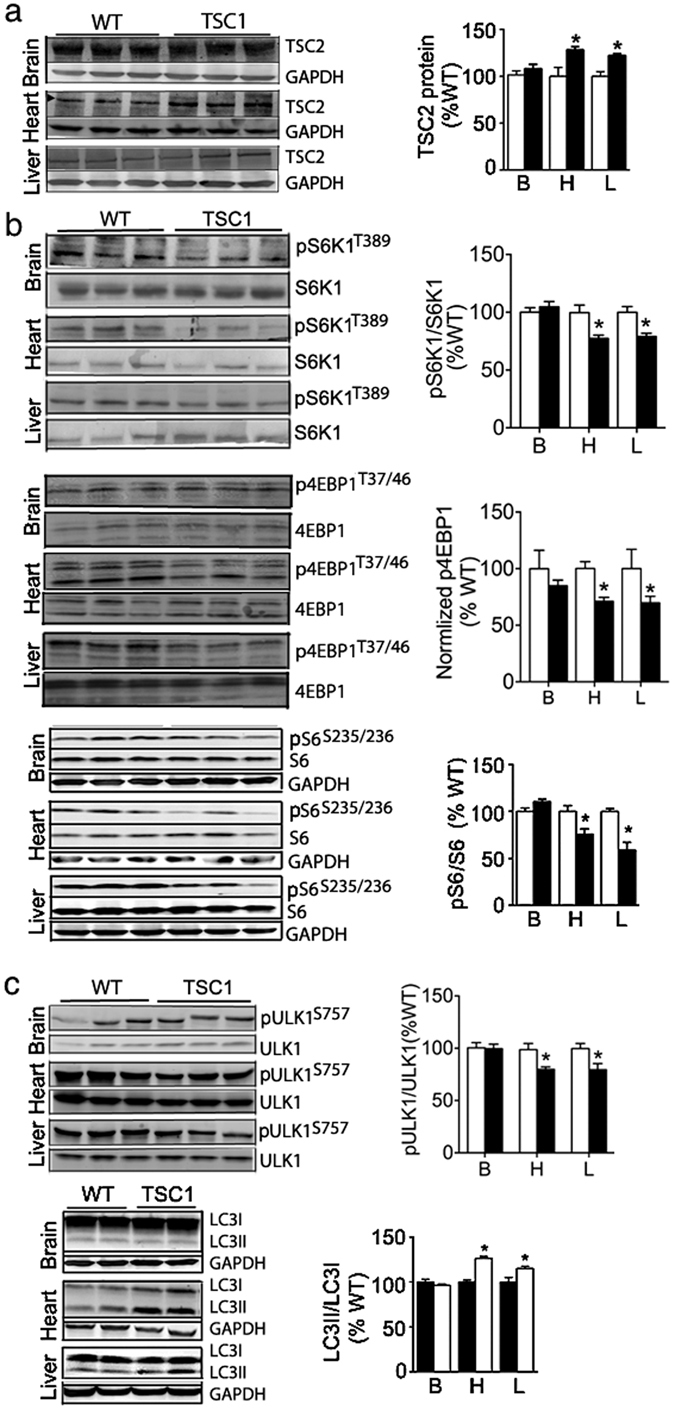
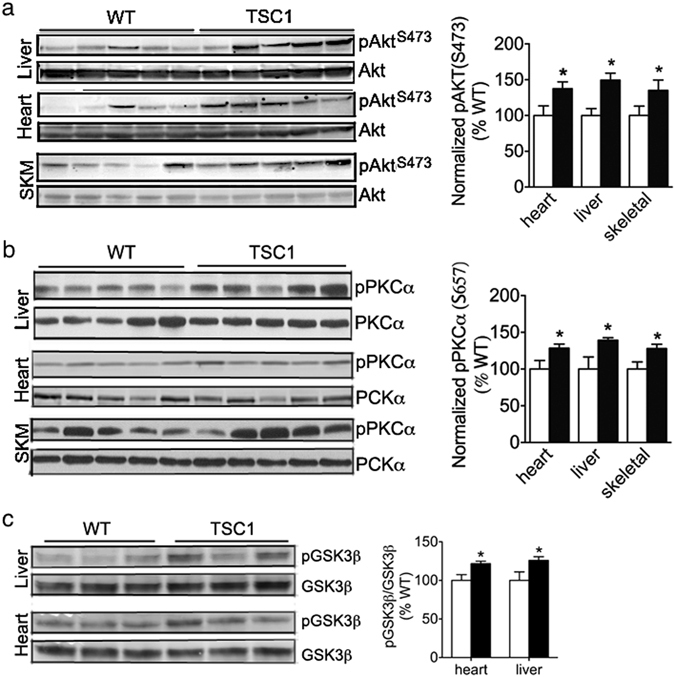
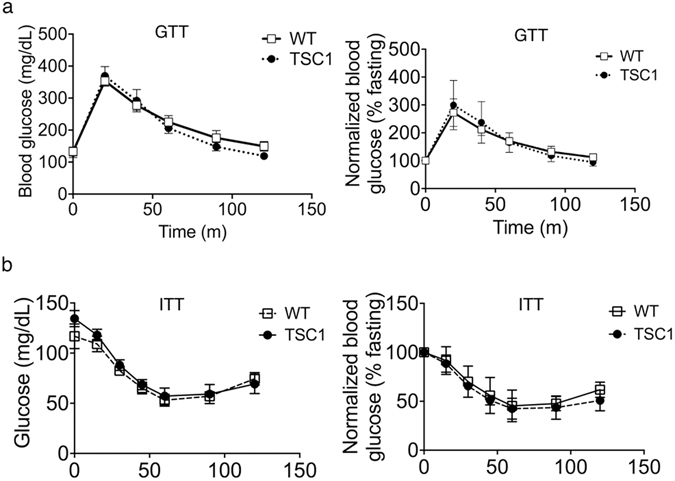
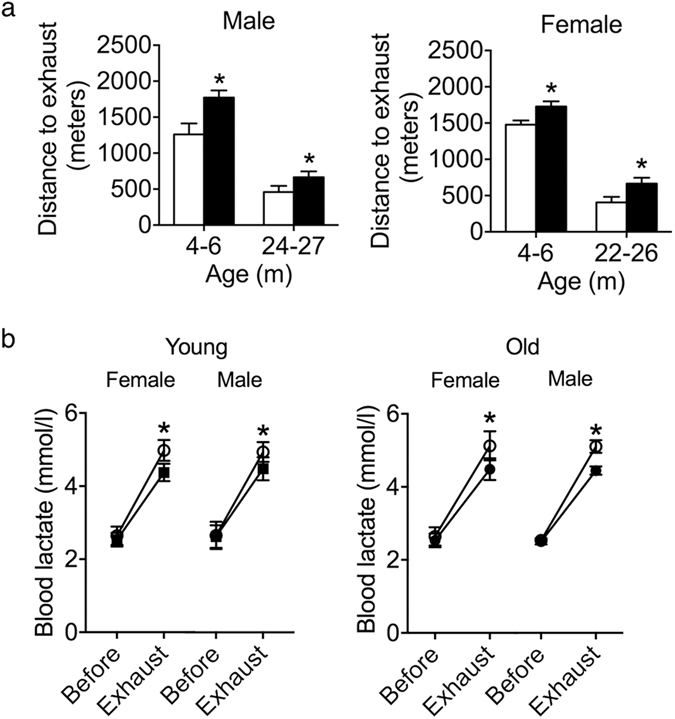
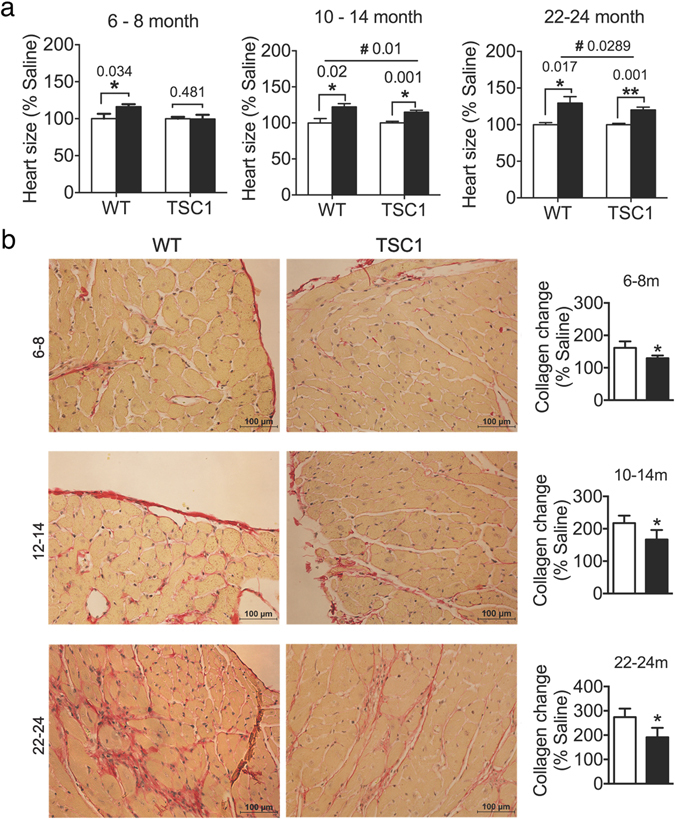
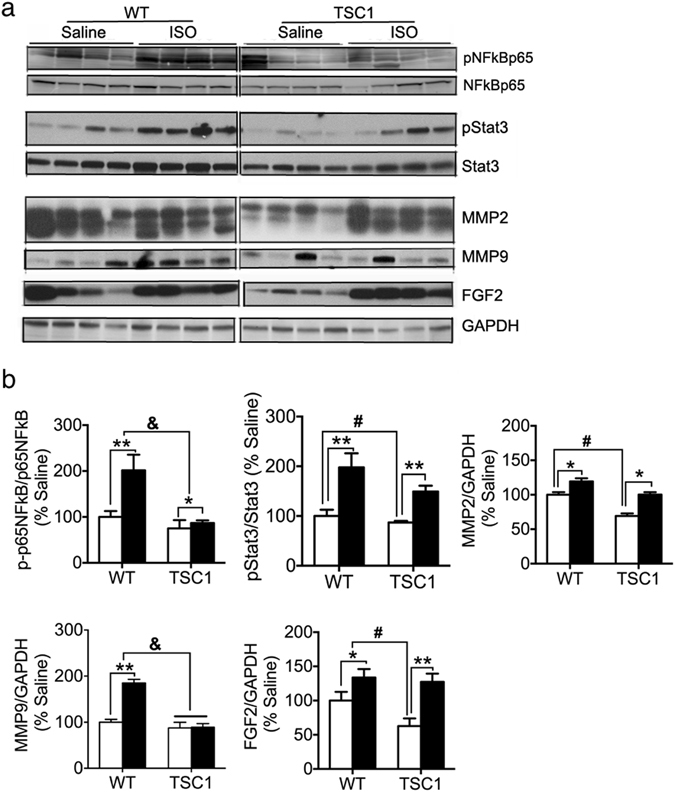
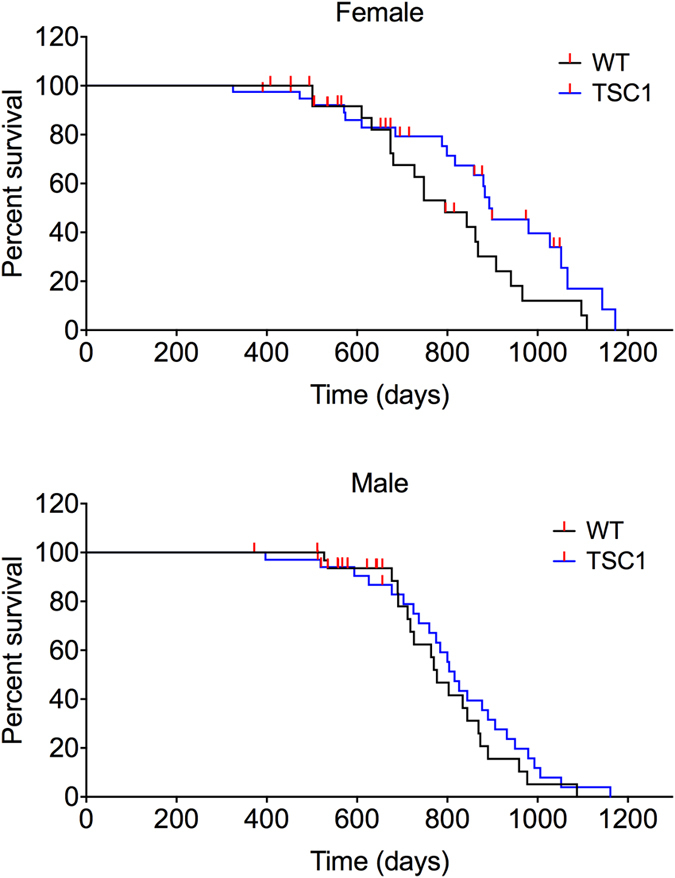
The tuberous sclerosis complex 1/2 (TSC1/2) is an endogenous regulator of the mechanistic target of rapamycin (mTOR). While mTOR has been shown to play an important role in health and aging, the role of TSC1/2 in aging has not been fully investigated. In the current study, a constitutive TSC1 transgenic (Tsc1 tg ) mouse model was generated and characterized. mTORC1 signaling was reduced in majority of the tissues, except the brain. In contrast, mTORC2 signaling was enhanced in Tsc1 tg mice. Tsc1 tg mice are more tolerant to exhaustive exercises and less susceptible to isoproterenol-induced cardiac hypertrophy at both young and advanced ages. Tsc1 tg mice have less fibrosis and inflammation in aged as well as isoproterenol-challenged heart than age-matched wild type mice. The female Tsc1 tg mice exhibit a higher fat to lean mass ratio at advanced ages than age-matched wild type mice. More importantly, the lifespan increased significantly in female Tsc1 tg mice, but not in male Tsc1 tg mice. Collectively, our data demonstrated that moderate increase of TSC1 expression can enhance overall health, particularly cardiovascular health, and improve survival in a gender-specific manner.


Conflict of interest statement

The authors declare that they have no competing interests.

Figures

Figure 1
Figure 1
Generation of Tsc1 tg mice. (a) Diagram of DNA construct used for generating hTSC1 transgenic mice. pUbC: ubiquitin C promoter. (b) Detection of hTSC1 transgene by PCR using genomic DNA isolated from the tail of one of the founder lines. Tg – hTSC1 transgenic founder #1; WT – wild type pups; (+) – positive control DNA for hTSC1. (c) Quantification of TSC1 protein expression in different tissues of Tsc1 tg mice using western blot (n = 6 mice/group). B – brain; L – liver; H – heart; K – kidney; M – skeletal muscle. The asterisks indicate statistical significance between Tsc1 tg and wild type mice (*p < 0.05).
Figure 2
Figure 2
Body weight and composition. Body weight and composition of mice at different ages (specified in the figure) were determined using magnetic resonance imaging approach as described in the method section. (a) Body weight, lean and fat mass to body weight ratio. (b) Body weight, lean and fat mass normalized to young mice with the same gender and genotype. Male: 5–8 m mice, n = 17 for WT, n = 13 for TSC1 tg; 20–22 m mice, n = 18 for WT, n = 10 for TSC1 tg. Female: 12–14 m mice, n = 14 for WT, n = 15 for TSC1 tg; 20–22 m mice, n = 12 for WT, n = 19 for TSC1 tg. The asterisks indicate statistical significance between Tsc1 tg and wild type mice (*p < 0.05).
Figure 3
Figure 3
Effects of TSC1 overexpression on cell signaling. Proteins extracted from different tissues were subjected to western blot analysis as described in the methods section (n > = 6 mice at 4–6 month of age for each genotype, includes both male and female mice). (a) TSC2 protein expression in different tissues. (b) mTOR signaling was monitored as the level of phosphorylation of S6K1 (threonine 389), ULK1 (serine 757), 4EBP1 (threonine 37/46), and S6 (serine 235/236). (c) The detection of autophagy related changes: Phosphorylation of ULK1 (serine 757) and the conversion of an autophagy marker LC3 from LC3I to LC3II (LC3II/LC3I ratio). WT – wild type littermates; TSC1 - Tsc1 tg mice. B – brain; L – liver; H – heart. The band intensity was normalized to wild type mice in each group. The asterisks indicate statistical significance between Tsc1 tg and wild type mice in a specific tissue (*p < 0.05).
Figure 4
Figure 4
Changes of mTORC2 related signaling in TSC1 tg mice. (a) Phosphorylation of ATK at serine 473 and (b) Phosphorylation of PCKα at serine 657 in the heart, liver and skeletal muscle (SKM). (c) Phosphorylation of GSK3β at serine 9 in liver and heart. The protein band intensity was normalized to wild type mice in each group. The asterisks indicate statistical significance between Tsc1 tg and wild type mice (*p < 0.05, n = 6 for each group, includes both male and female mice).
Figure 5
Figure 5
Glucose tolerance and insulin sensitivity in TSC1 tg mice. (a) Glucose tolerance test (GTT) in 22–24 month old female mice (n = 6 mice in each group). (b) Insulin sensitivity test (ITT) in female 22–24 month old mice (n = 6 mice in each group). Blood glucose was measured every 15 or 30 minutes after either glucose or insulin injection. The left graphs corresponding to each graph on the left are plotted after normalizing to the levels of blood glucose just prior to the injection. WT – wild type mice (white square); TSC1 - TSC1 tg mice (Solid black circle).
Figure 6
Figure 6
Exhaustive exercise on treadmill. (a) Running distance on treadmill till exhaustion for male and female mice at different ages (6–8, 24–27(female), 22–26 (male) months of age; n = 8 mice for each group). (b) Blood lactate levels before and after treadmill running test (n = 8 mice for each group). The asterisks indicate statistical significance between Tsc1 tg (black solid bar or circle) and wild type mice (white blank bar or circle) (*P < 0.05). WT – wild type mice; TSC1 - Tsc1 tg mice.
Figure 7
Figure 7
Cardiac function analysis after isoproterenol injection. (a) Heart size (ratio to body weight) in young (6–8 month, n = 8 for each group), middle aged (10–14 months, n = 8 WT, n = 12 TSC1 tg), and old (22–24 months, n = 13 WT, n = 15 TSC1 tg) female mice before and after isoproterenol challenge. White bar – mice with saline; black bar – mice with isoproterenol injection. Asterisks (*p < 0.05 and **p < 0.01) indicate statistical significance between isoproterenol injected mice and saline injected mice. Ampersand (#p < 0.05) indicates statistical significance in the degree of hypertrophy after isoproterenol injection between Tsc1 tg mice and wild type mice. (b) Histological examination of left cardiac tissue from young (6–8 month), middle aged (12–14 month), and old (22–24 month) female mice using Picrosirius Red Staining as described in the method section (n = 6 mice in each group). Collagen content changes during hypertrophy were calculated as a percentage of collagen content after isoproterenol against saline injected mice of the same genotype. Asterisks (*p < 0.05) indicate statistical significance between Tsc1 tg mice and wild type mice.
Figure 8
Figure 8
Fibrosis and inflammatory response in the heart of aged mice and the heart of mice after isoproterenol challenge. (a) Western blot analysis of NFκB, Stat3, FGF2 and MMP2/9 in heart protein extracts from old female mice (22–24 months of age, n = 6). (b) Quantification of protein band intensity (n = 6). WT – wild type mice; TSC1 - Tsc1 tg mice. White bar – saline-injected mice; black bar – isoproterenol-injected mice. Asterisks (*p < 0.05 and **p < 0.01) indicate statistical significance between isoproterenol injected and saline injected mice of the same genotype as indicated in the graph.
Figure 9
Figure 9
Lifespan analysis of TSC1 tg mice. Survival curves are shown for female and male mice separately (67 females: 27 and 40 for wild type and TSC1 tg mice separately; 67 males: 32 and 35 for wild type and TSC1 tg mice respectively). The survival curve for female mice is significant, while not for male mice (p = 0.0282 for female mice; p = 0.195 for male mice, determined by one sided Log-rank test analysis).

Similar articles

Cited by

References

    1. Dazert, E. & Hall, M. N. mTOR signaling in disease. Current opinion in cell biology, doi:10.1016/j.ceb.2011.09.003 (2011). - PubMed
    1. Tsang CK, Qi H, Liu LF, Zheng XF. Targeting mammalian target of rapamycin (mTOR) for health and diseases. Drug Discov Today. 2007;12:112–124. doi: 10.1016/j.drudis.2006.12.008. - DOI - PubMed
    1. Laplante M, Sabatini DM. mTOR signaling in growth control and disease. Cell. 2012;149:274–293. doi: 10.1016/j.cell.2012.03.017. - DOI - PMC - PubMed
    1. Schieke SM, Finkel T. TOR and aging: less is more. Cell Metab. 2007;5:233–235. doi: 10.1016/j.cmet.2007.03.005. - DOI - PubMed
    1. McCormick MA, Tsai SY, Kennedy BK. TOR and ageing: a complex pathway for a complex process. Philos Trans R Soc Lond B Biol Sci. 2011;366:17–27. doi: 10.1098/rstb.2010.0198. - DOI - PMC - PubMed

Publication types

MeSH terms

Substances

LinkOut - more resources