. 2017 Apr 11;7(1):827.
doi: 10.1038/s41598-017-00989-w.

Imaging atherosclerosis in rheumatoid arthritis: evidence for increased prevalence, altered phenotype and a link between systemic and localised plaque inflammation

Affiliations

Imaging atherosclerosis in rheumatoid arthritis: evidence for increased prevalence, altered phenotype and a link between systemic and localised plaque inflammation

S Skeoch et al. Sci Rep. .

Abstract

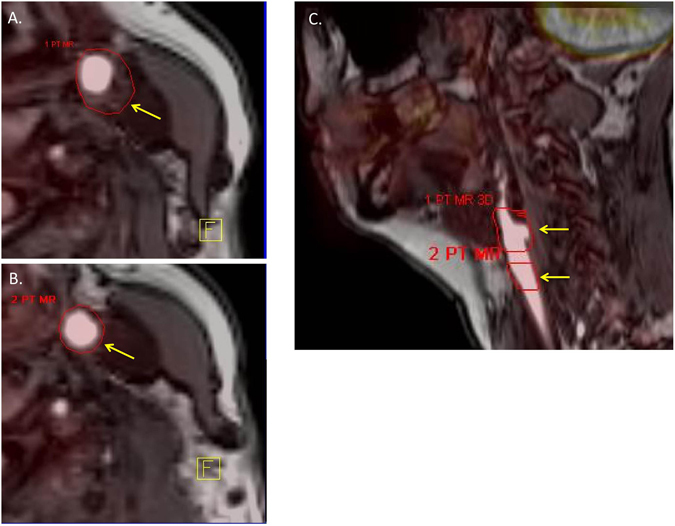
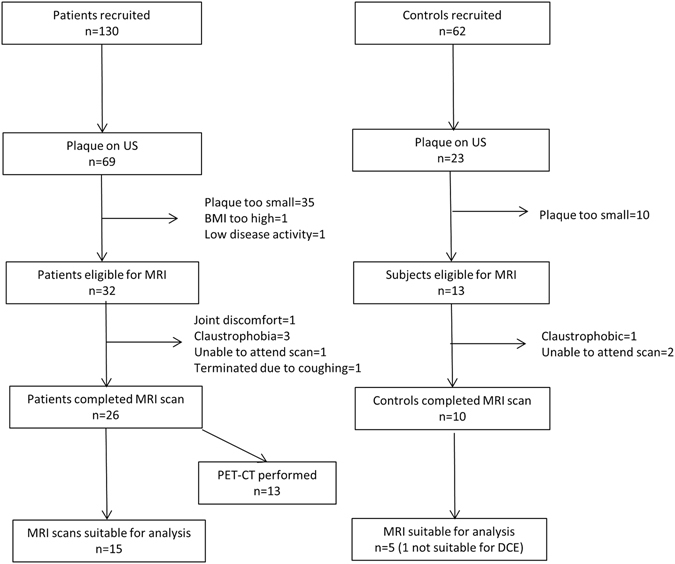
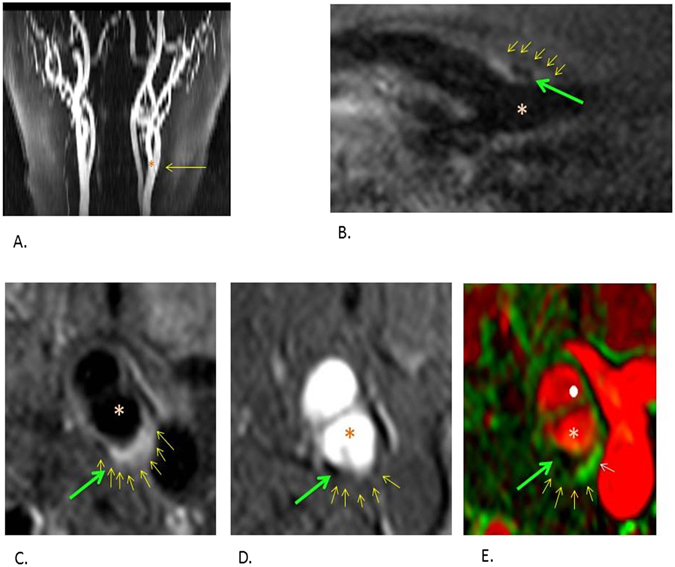
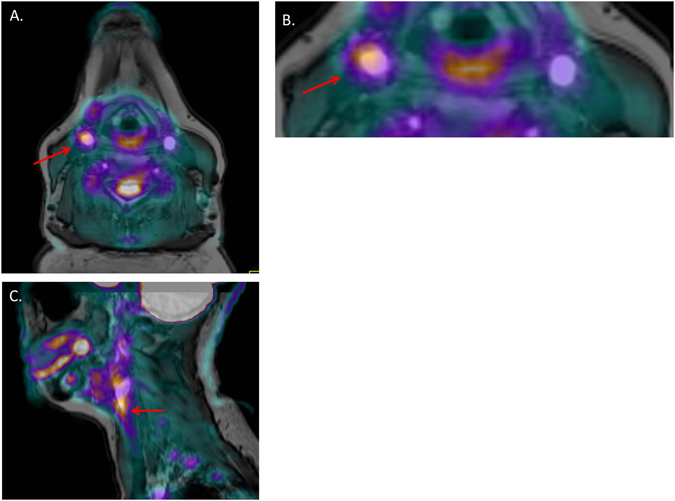
In rheumatoid arthritis (RA), chronic inflammation is thought to drive increased cardiovascular risk through accelerated atherosclerosis. It may also lead to a more high-risk plaque phenotype. We sought to investigate carotid plaque phenotype in RA patients using Dynamic Contrast-Enhanced MRI (DCE-MRI) and Fludeoxyglucose Positron Emission Tomography(FDG-PET). In this pilot study, RA patients and age/sex-matched controls were evaluated for cardiovascular risk factors and carotid plaque on ultrasound. Subjects with plaque >2 mm thick underwent DCE-MRI, and a subgroup of patients had FDG-PET. Comparison of MRI findings between groups and correlation between clinical, serological markers and imaging findings was undertaken. 130 patients and 62 controls were recruited. Plaque was more prevalent in the RA group (53.1% vs 37.0%, p = 0.038) and was independently associated with IL6 levels (HR[95%CI]: 2.03 [1.26, 3.26] per quartile). DCE-MRI data were available in 15 patients and 5 controls. Higher prevalence of plaque calcification was noted in RA, despite similar plaque size (73.3% vs 20%, p = 0.04). FDG-PET detected plaque inflammation in 12/13 patients scanned and degree of inflammation correlated with hs-CRP (r = 0.58, p = 0.04). This study confirms increased prevalence of atherosclerosis in RA and provides data to support the hypothesis that patients have a high-risk plaque phenotype.


Conflict of interest statement

Professor Yuan has received grants from Philips Healthcare and is a board member of Philips Radiology Advisory Board. Professor Hockings reports receiving a salary from Astra Zeneca and Arantos Medical, during the conduct of this study. Professor Waterton has received a salary from Astra Zeneca during the conduct of the study.

Figures

Figure 1
Figure 1
Identification of VOIs on PET-MRI. ROIs were drawn around the borders of plaque on each slice where plaque was seen (an example is seen in the axial image (A), yellow arrow points to VOI border). An equivalent number of ROIs are drawn around vessel wall on slices where no plaques are seen (an example is seen in (B)). An example of the ROIs on a sagittal section can be seen in (C) where each arrow points to the two defined ROIs, the superior one includes the atheromatous wall while the inferior ROI is of non-atheromatous wall.
Figure 2
Figure 2
Schematic flow of data collection in patients and controls recruited into the study.
Figure 3
Figure 3
Representative images acquired during MRI. The small yellow arrows correspond to the outer border of plaque, the green arrows highlight an area of calcification within plaque and *highlights the lumen in each sequence. (A) A 2D time of flight with the yellow arrow pointing towards the bifurcation. (B) A black blood sagittal oblique section through the bifurcation. (C) A corresponding cross sectional black blood imaging sequence through the common carotid artery bifurcation where plaque can be seen at the posterior aspect of the vessel wall. (D) A corresponding bright blood image at the same level. (E) A DCE parameter map of the cross sectional image. Ktrans is estimated using a Patlak model and a Ktrans map is generated. The Ktrans signal is shown in green. The boundaries of the plaque defined on the T1 weighted sequence are applied to this map to estimate the Ktrans measurement within the plaque. The white arrow highlights the Ktrans signal within the plaque area.
Figure 4
Figure 4
Provides an example of a carotid FDG-PET-MRI in an RA patient. (A) A cross sectional image at the level of the plaque. (B) Provides a more magnified image of the plaque on this slice which demonstrates increased uptake around the vessel wall where plaque has been identified (highlighted by the red arrow). (C) A coronal section in the same patient with the red arrow highlighting the area of increased uptake within the plaque in this view.

References

    1. Alamanos Y, Voulgari PV, Drosos AA. Incidence and prevalence of rheumatoid arthritis, based on the 1987 American College of Rheumatology criteria: a systematic review. Semin Arthritis Rheum. 2006;36:182–188. doi: 10.1016/j.semarthrit.2006.08.006. - DOI - PubMed
    1. Gabriel SE, et al. Survival in rheumatoid arthritis: a population-based analysis of trends over 40 years. Arthritis Rheum. 2003;48:54–58. doi: 10.1002/art.10705. - DOI - PubMed
    1. Peters MJ, et al. Does rheumatoid arthritis equal diabetes mellitus as an independent risk factor for cardiovascular disease? A prospective study. Arthritis Rheum. 2009;61(11):1571–9. doi: 10.1002/art.24836. - DOI - PubMed
    1. Goodson N, et al. Cardiovascular admissions and mortality in an inception cohort of patients with rheumatoid arthritis with onset in the 1980s and 1990s. Ann. Rheum. Dis. 2005;64:1595–1601. doi: 10.1136/ard.2004.034777. - DOI - PMC - PubMed
    1. Maradit-Kremers HH, et al. Increased unrecognized coronary heart disease and sudden deaths in rheumatoid arthritis: a population-based cohort study. Arthritis Rheum. 2005;52(2):402–11. doi: 10.1002/art.20853. - DOI - PubMed

Publication types

Substances