. 2017 Apr 11;7(1):826.
doi: 10.1038/s41598-017-00969-0.

Fish oil, lard and soybean oil differentially shape gut microbiota of middle-aged rats

Affiliations

Fish oil, lard and soybean oil differentially shape gut microbiota of middle-aged rats

He Li et al. Sci Rep. .

Erratum in

Abstract

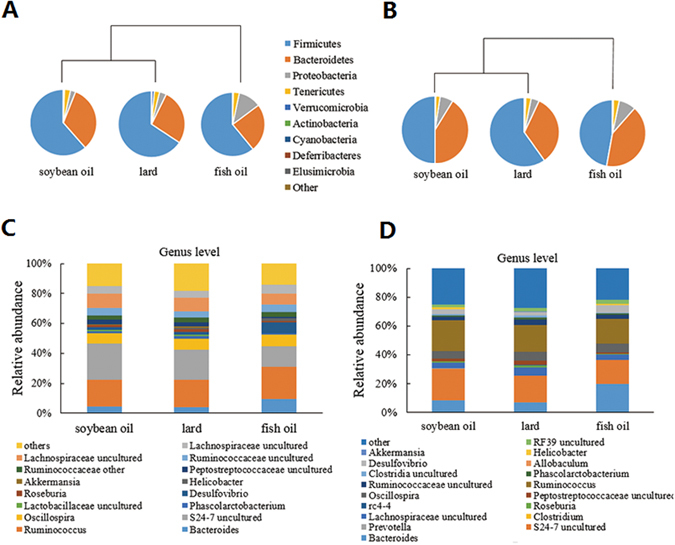
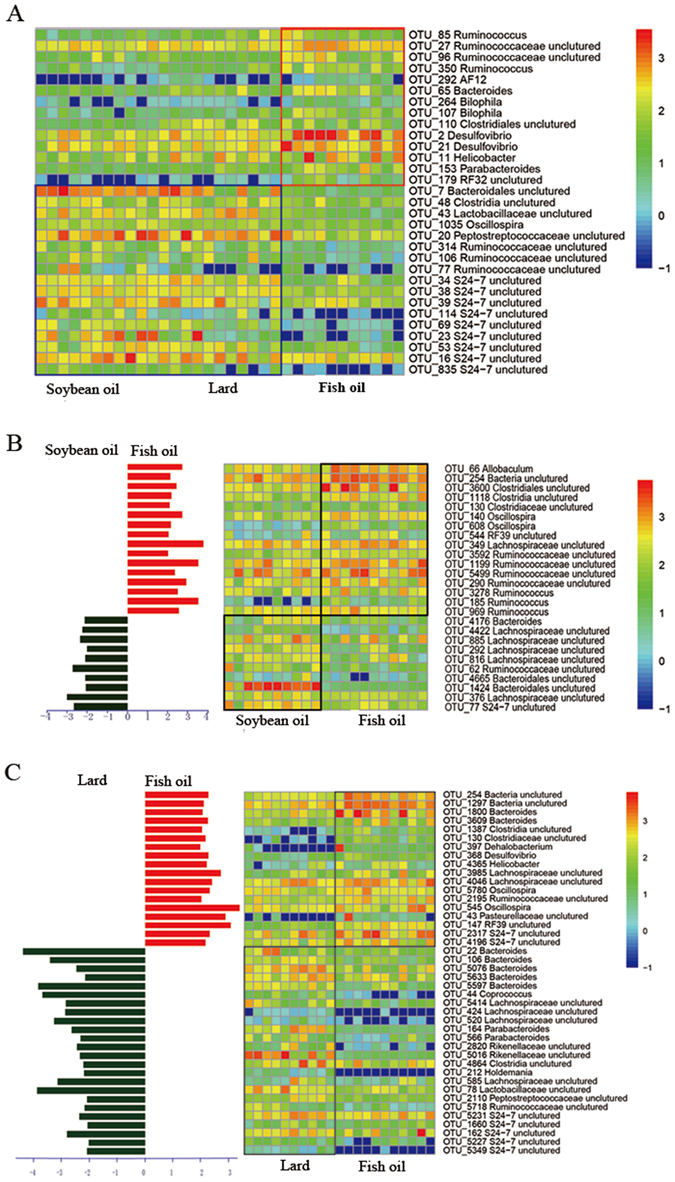
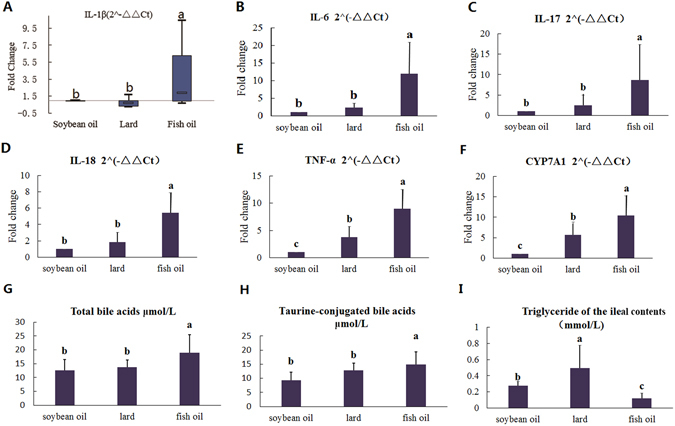
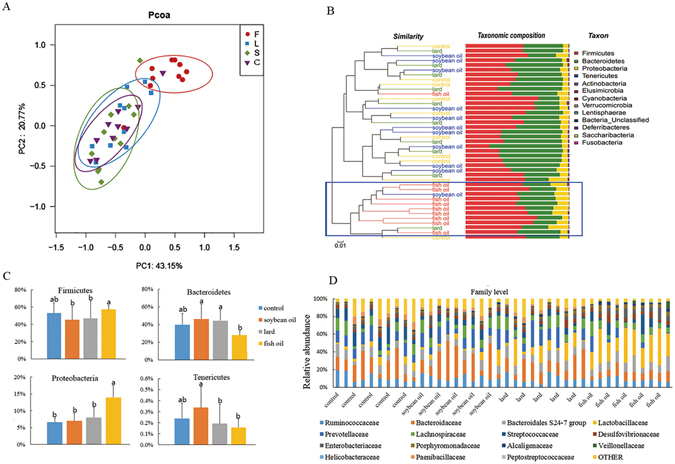
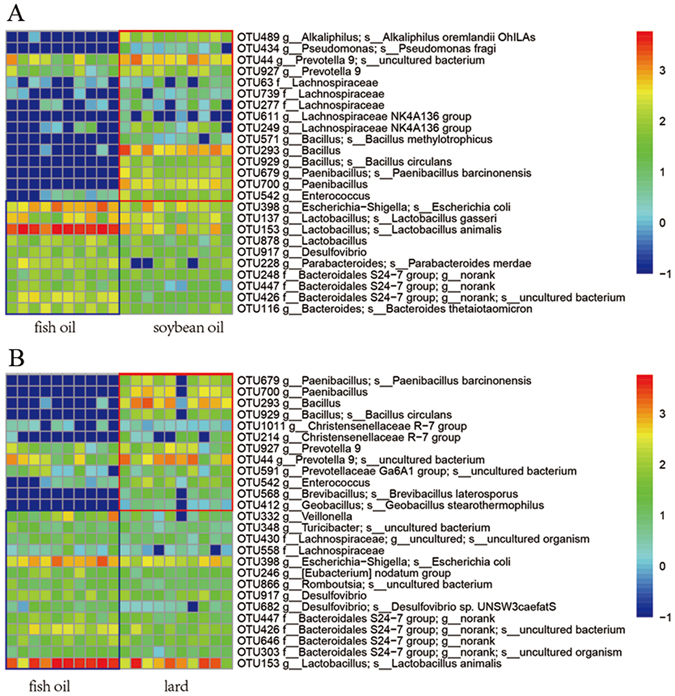
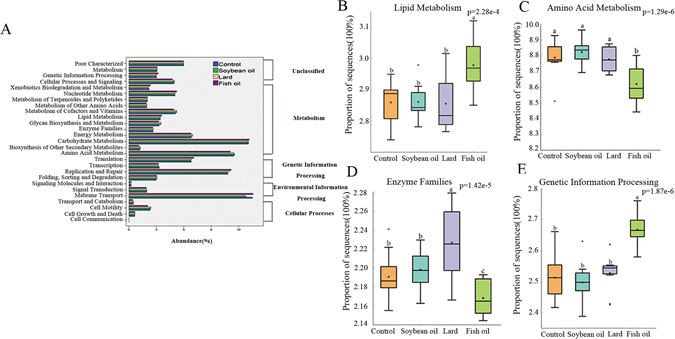
High-fat diets have been associated with overweight/obesity and increased mortality in middle-aged populations. However, it is still unclear how gut microbiota in middle-aged populations responds to dietary fats at a normal dose. In this study, we explored gut microbiota structure in middle-aged rats (aged 12 months) after feeding 4% (w/w) soybean oil, lard or fish oil for 3 months, respectively. The results showed that the gut microbiota structure in the fish oil group was substantially different from those of the soybean oil and lard groups in both in vitro and in vivo studies. The relative abundances of phylum Proteobacteria and genus Desulfovibrio in the caecal and colonic contents were the highest in the fish oil group (p < 0.05). The mRNA levels of biomarkers for inflammation in the colon, including IL-1β, IL-6, IL-17, IL-18 and TNF-α, were also the highest in the fish oil group (p < 0.05). Meanwhile, the fish oil group had the highest microbial DNA abundance of a predicted lipid metabolism. Our results gave a new insight into the potentially negative impact of fish oil diet on health of middle-aged populations by changing gut microbiota and inducing inflammation as compared to soybean oil and lard diets.


Conflict of interest statement

The authors declare that they have no competing interests.

Figures

Figure 1
Figure 1
Gut microbiota in response to dietary fats. (A) Relative abundance of caecel microbiota on the phylum level. (B) Relative abundance of colonic microbiota on the phylum level. (C) Relative abundance of caecal microbiota on the genus level. (D) Relative abundance of colonic microbiota on the genus level.
Figure 2
Figure 2
Comparisons of gut bacteria on OTU level using LefSe (A) caecal bacteria; (B) colonic bacteria between soybean oil and fish oil; (C) colonic bacteria between lard and fish oil. In B and C, the left histograms show the LDA scores computed for features on the OTU level. The middle heatmaps show the relative abundance of OTU (log 10 transformed). Each column represents one biological sample and each row represents the OTU corresponding to left one.
Figure 3
Figure 3
Diet-induced changes of physiological parameters of the rats. (A–E) The expression of inflammatory cytokines in the colon tissue, including IL-1β (A), IL-6 (B), IL-17 (C), IL-18 (D) and TNF-α (E). (F) The expression of gene CYP7A1 in the liver. (G) The amounts of total bile acids in the caecal contents. (H) The amounts of taurine-conjugated bile acids in the caecal contents. (I) The amounts of triglyceride in the ileal contents The data were analyzed by one-way analysis of variance and means were compared by the procedure of Duncan’s multiple-range comparison. a,b,c, means with different letters differed significantly (p < 0.05). Error bar means standard deviation.
Figure 4
Figure 4
Composition of microbiota in fermentation liquids. (A) Principal coordinate analysis of fermentation liquids on the OTU level. F, L, S and C represent fish oil, lard, soybean oil and control groups, respectively. (B) Relative abundance of microbial community at the phylum level in fermentation liquids in response to three dietary fats. (C) Changes of relative abundance of phyla with significant difference in fermentation liquids. Data were shown as means and standard deviation (bars). The data were analyzed by one-way analysis of variance and means were compared by the procedure of Duncan’s multiple-range comparison. a, b, means with different letters differed significantly (p < 0.05). (D) Relative abundance of microbial community in fermentation liquids on the family level.
Figure 5
Figure 5
Comparisons of bacteria in fermentation liquids using LefSe. (A) Between fish oil and soybean oil groups. (B) Between fish oil and lard groups. The left histograms show the LDA scores computed for features on the OTU level. The heatmaps shows the relative abundance of OTU (log 10 transformed). Each column represents one biological sample and each row represents the OTU corresponding to the right one.
Figure 6
Figure 6
PICRUSt recapitulates biological findings. (A) Abundances of KEGG pathways in level-2 functional prediction by PICRUSt. (B) Lipid metabolism. (C) Amino acid metabolism. (D) Enzyme families. (E) Genetic information processing. The data were analyzed by one-way analysis of variance and means were compared by the procedure of Duncan’s multiple-range comparison. a,b,c means with different letters differed significantly (p < 0.05).

Similar articles

Cited by

References

    1. Howarth NC, Huang TT, Roberts SB, McCrory MA. Dietary Fiber and Fat Are Associated with Excess Weight in Youngand Middle-Aged US Adults. J. Am. Diet Assoc. 2005;105(9):1365–1372. doi: 10.1016/j.jada.2005.06.001. - DOI - PubMed
    1. Martínez-González MA, et al. The Mediterranean diet is associated with a reduction in premature mortality among middle-aged adults. J. Nutr. 2012;142(9):1672–1678. doi: 10.3945/jn.112.162891. - DOI - PubMed
    1. Levinson DJ. A conception of adult development. Am.J. Psychol. 1986;41:3–13. doi: 10.1037/0003-066X.41.1.3. - DOI
    1. Flurkey, K., Currer, J. M. & Harrison, D. E. The Mouse in Biomedical Research, The Mouse in Biomedical Research (2nd Edition). 10.1016/B978-012369454-6/50074-1, 637–672 (2007).
    1. Lakka HM, et al. The metabolic syndrome and total and cardiovascular disease mortality in middleage men. J. A. M. A. 2002;288:2709–2716. doi: 10.1001/jama.288.21.2709. - DOI - PubMed

Publication types