

Edaravone protects against oxygen-glucose-serum deprivation/restoration-induced apoptosis in spinal cord astrocytes by inhibiting integrated stress response
- PMID: 28400812
- PMCID: PMC5361514
- DOI: 10.4103/1673-5374.199006
Edaravone protects against oxygen-glucose-serum deprivation/restoration-induced apoptosis in spinal cord astrocytes by inhibiting integrated stress response
Abstract
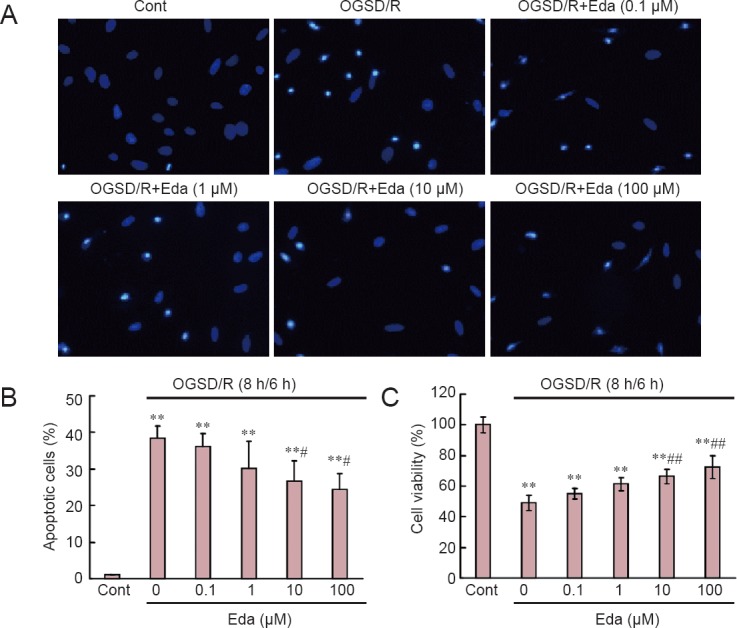
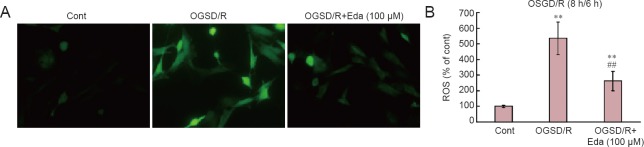
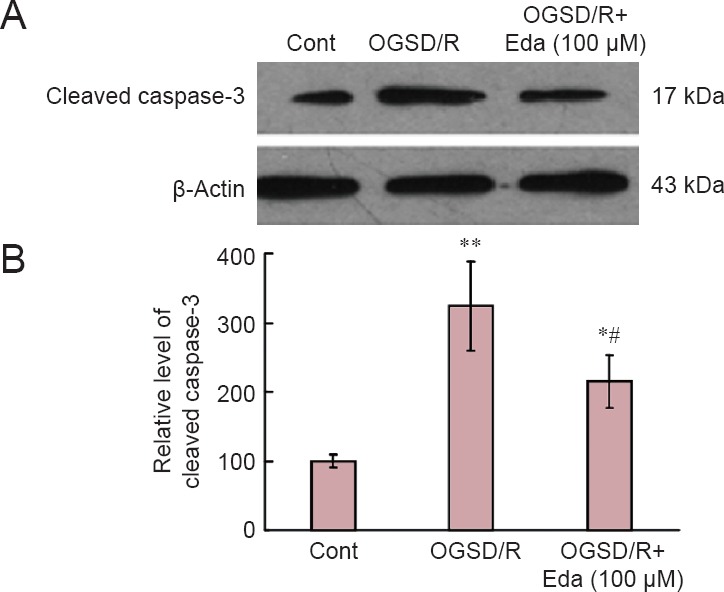
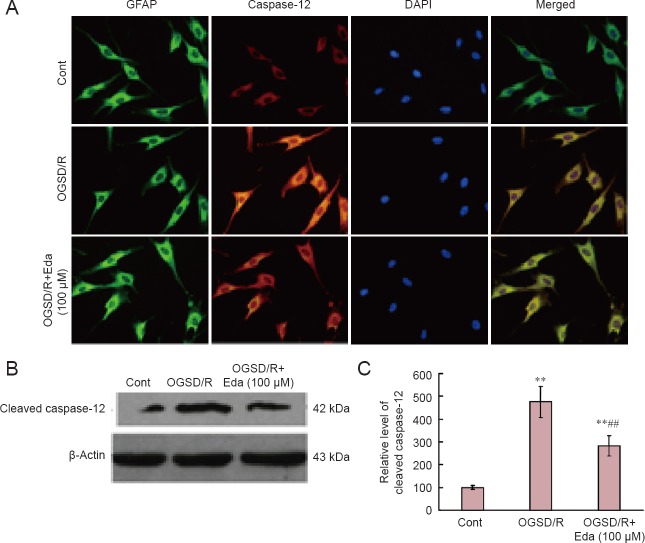
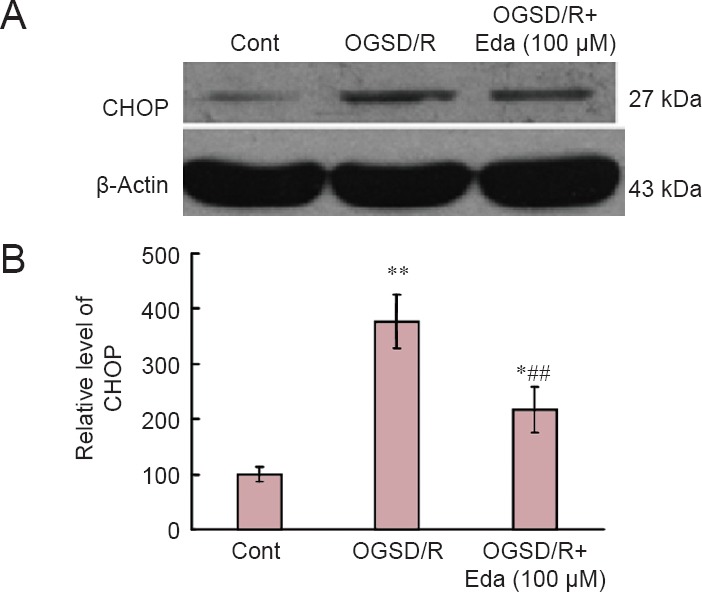
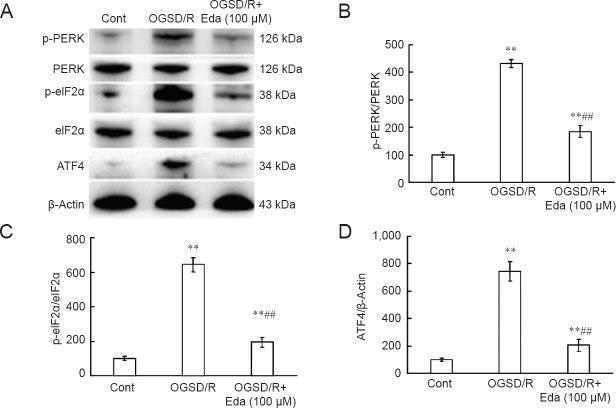
We previously found that oxygen-glucose-serum deprivation/restoration (OGSD/R) induces apoptosis of spinal cord astrocytes, possibly via caspase-12 and the integrated stress response, which involves protein kinase R-like endoplasmic reticulum kinase (PERK), eukaryotic initiation factor 2-alpha (eIF2α) and activating transcription factor 4 (ATF4). We hypothesized that edaravone, a low molecular weight, lipophilic free radical scavenger, would reduce OGSD/R-induced apoptosis of spinal cord astrocytes. To test this, we established primary cultures of rat astrocytes, and exposed them to 8 hours/6 hours of OGSD/R with or without edaravone (0.1, 1, 10, 100 μM) treatment. We found that 100 μM of edaravone significantly suppressed astrocyte apoptosis and inhibited the release of reactive oxygen species. It also inhibited the activation of caspase-12 and caspase-3, and reduced the expression of homologous CCAAT/enhancer binding protein, phosphorylated (p)-PERK, p-eIF2α, and ATF4. These results point to a new use of an established drug in the prevention of OGSD/R-mediated spinal cord astrocyte apoptosis via the integrated stress response.
Keywords: CCAAT/enhancer binding protein homologous protein; PERK; activating transcription factor 4; apoptosis; astrocytes; caspase-12; caspase-3; eIF2α; edaravone; integrated stress response; nerve regeneration; neural regeneration; reactive oxygen species.
Conflict of interest statement
Conflicts of interest: None declared.
Figures
Similar articles
-
EIF2alpha and caspase-12 activation are involved in oxygen-glucose-serum deprivation/restoration-induced apoptosis of spinal cord astrocytes.Neurosci Lett. 2010 Jun 30;478(1):32-6. doi: 10.1016/j.neulet.2010.04.062. Epub 2010 May 2. Neurosci Lett. 2010. PMID: 20444431
-
Tetrandrine protects against oxygen-glucose-serum deprivation/reoxygenation-induced injury via PI3K/AKT/NF-κB signaling pathway in rat spinal cord astrocytes.Biomed Pharmacother. 2016 Dec;84:925-930. doi: 10.1016/j.biopha.2016.10.007. Epub 2016 Oct 17. Biomed Pharmacother. 2016. PMID: 27764754
-
NFAT5 protects astrocytes against oxygen-glucose-serum deprivation/restoration damage via the SIRT1/Nrf2 pathway.J Mol Neurosci. 2017 Jan;61(1):96-104. doi: 10.1007/s12031-016-0849-x. Epub 2016 Nov 12. J Mol Neurosci. 2017. PMID: 27838821
-
Edaravone protects against glutamate-induced PERK/EIF2α/ATF4 integrated stress response and activation of caspase-12.Brain Res. 2013 Jun 26;1519:1-8. doi: 10.1016/j.brainres.2013.04.037. Epub 2013 May 3. Brain Res. 2013. PMID: 23648361
-
Pollen Typhae Total Flavone Inhibits Endoplasmic Reticulum Stress-Induced Apoptosis in Human Aortic-Vascular Smooth Muscle Cells through Down-Regulating PERK-eIF2α-ATF4-CHOP Pathway.Chin J Integr Med. 2019 Aug;25(8):604-612. doi: 10.1007/s11655-019-3052-4. Epub 2019 Feb 1. Chin J Integr Med. 2019. PMID: 30707413
Cited by
-
Neuroprotective Effect of Polyphenol Extracts from Terminalia chebula Retz. against Cerebral Ischemia-Reperfusion Injury.Molecules. 2022 Sep 30;27(19):6449. doi: 10.3390/molecules27196449. Molecules. 2022. PMID: 36234986 Free PMC article.
-
Lithium promotes recovery of neurological function after spinal cord injury by inducing autophagy.Neural Regen Res. 2018 Dec;13(12):2191-2199. doi: 10.4103/1673-5374.241473. Neural Regen Res. 2018. PMID: 30323152 Free PMC article.
-
Targeting Hsp90α to inhibit HMGB1-mediated renal inflammation and fibrosis.Cell Prolif. 2025 Mar;58(3):e13774. doi: 10.1111/cpr.13774. Epub 2024 Nov 20. Cell Prolif. 2025. PMID: 39566909 Free PMC article.
References
-
- Black JA, Sontheimer H, Waxman SG. Spinal cord astrocytes in vitro: phenotypic diversity and sodium channel immunoreactivity. Glia. 1993;7:272–285. - PubMed
-
- Chen H, Wang S, Ding JH, Hu G. Edaravone protects against MPP+ -induced cytotoxicity in rat primary cultured astrocytes via inhibition of mitochondrial apoptotic pathway. J Neurochem. 2008;106:2345–2352. - PubMed
LinkOut - more resources
Full Text Sources
Other Literature Sources
Research Materials
