. 2017:2017:5930639.
doi: 10.1155/2017/5930639. Epub 2017 Mar 16.

Impact on Autophagy and Ultraviolet B Induced Responses of Treatment with the MTOR Inhibitors Rapamycin, Everolimus, Torin 1, and pp242 in Human Keratinocytes

Affiliations

Impact on Autophagy and Ultraviolet B Induced Responses of Treatment with the MTOR Inhibitors Rapamycin, Everolimus, Torin 1, and pp242 in Human Keratinocytes

Song Xu et al. Oxid Med Cell Longev. 2017.

Abstract

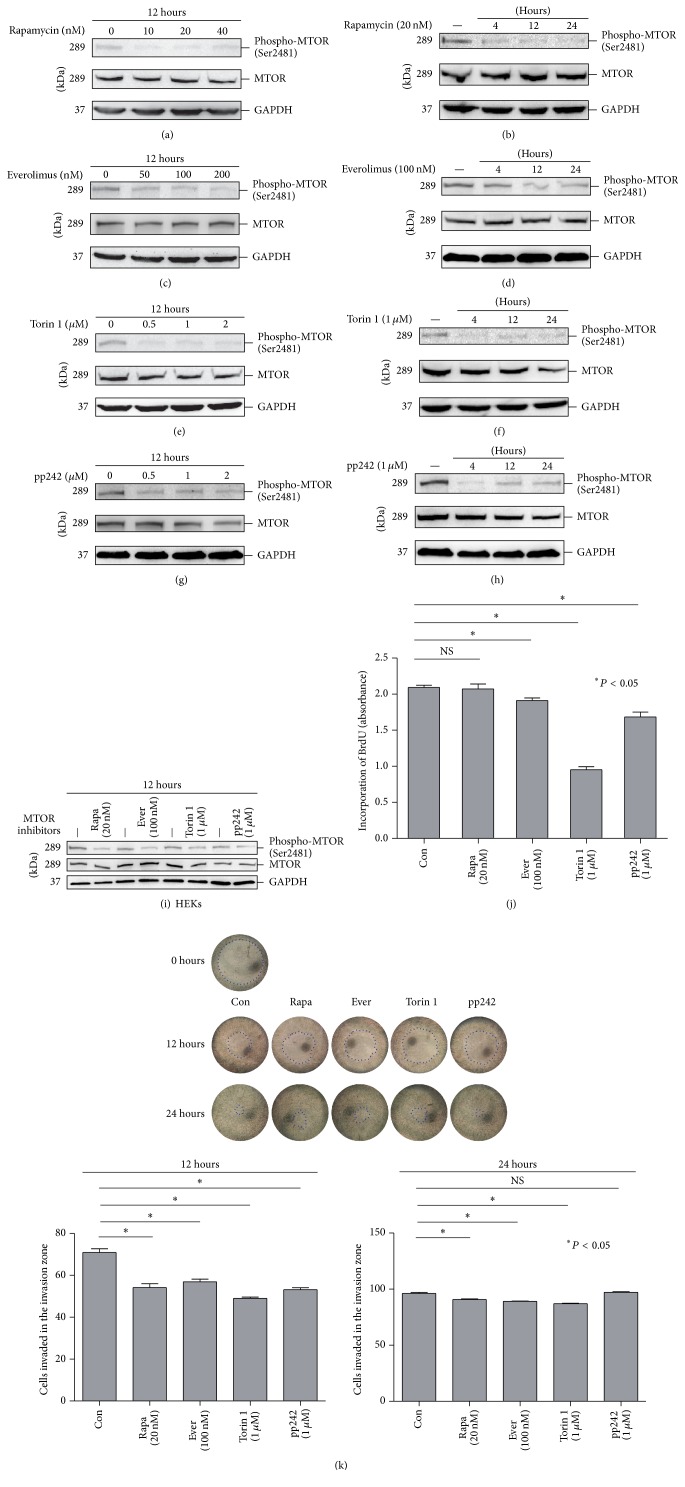
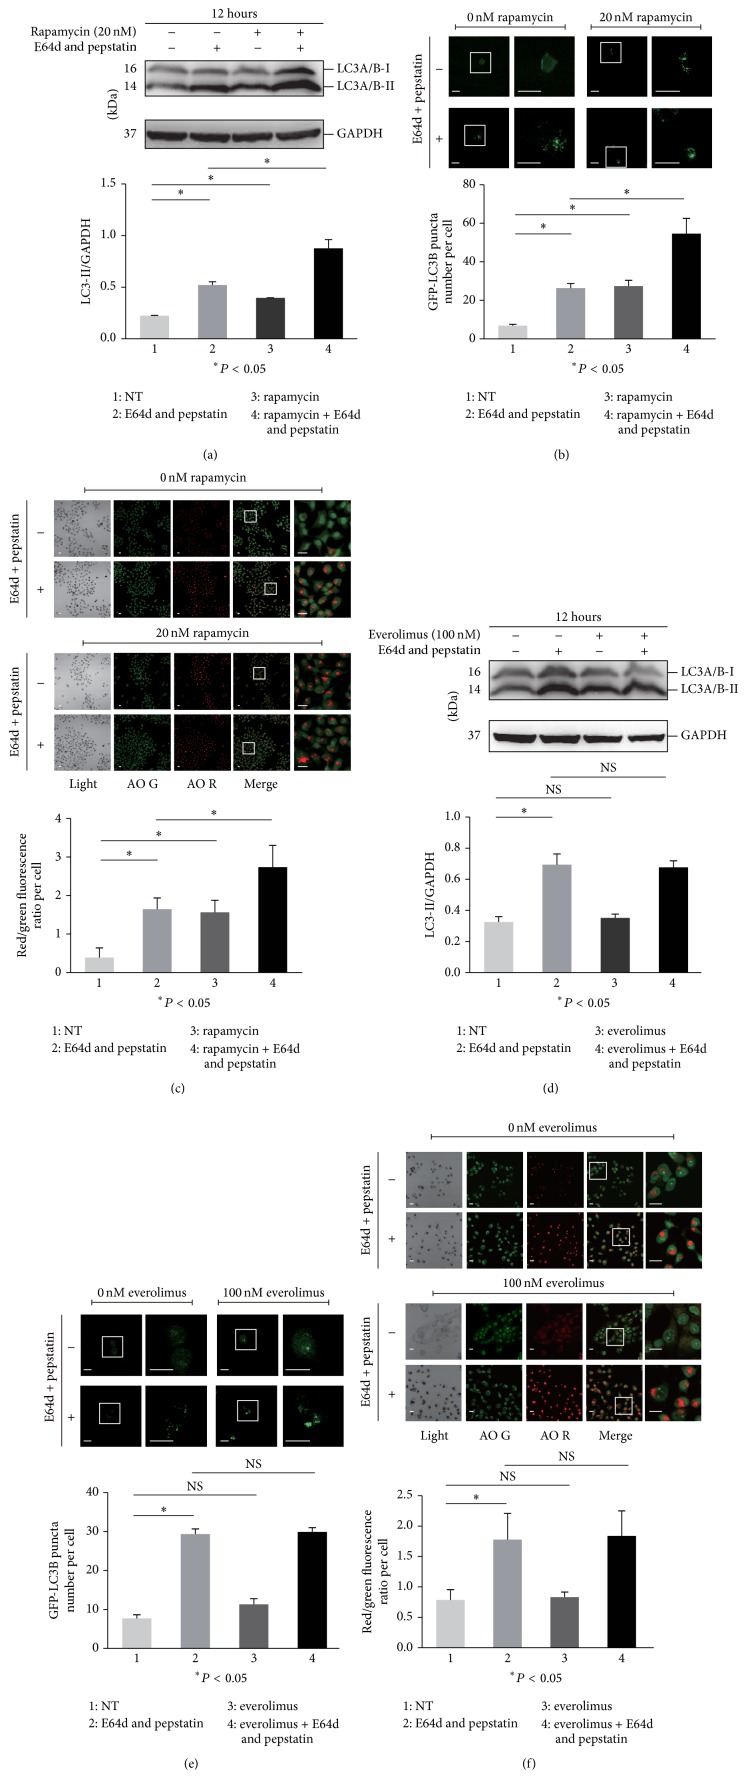
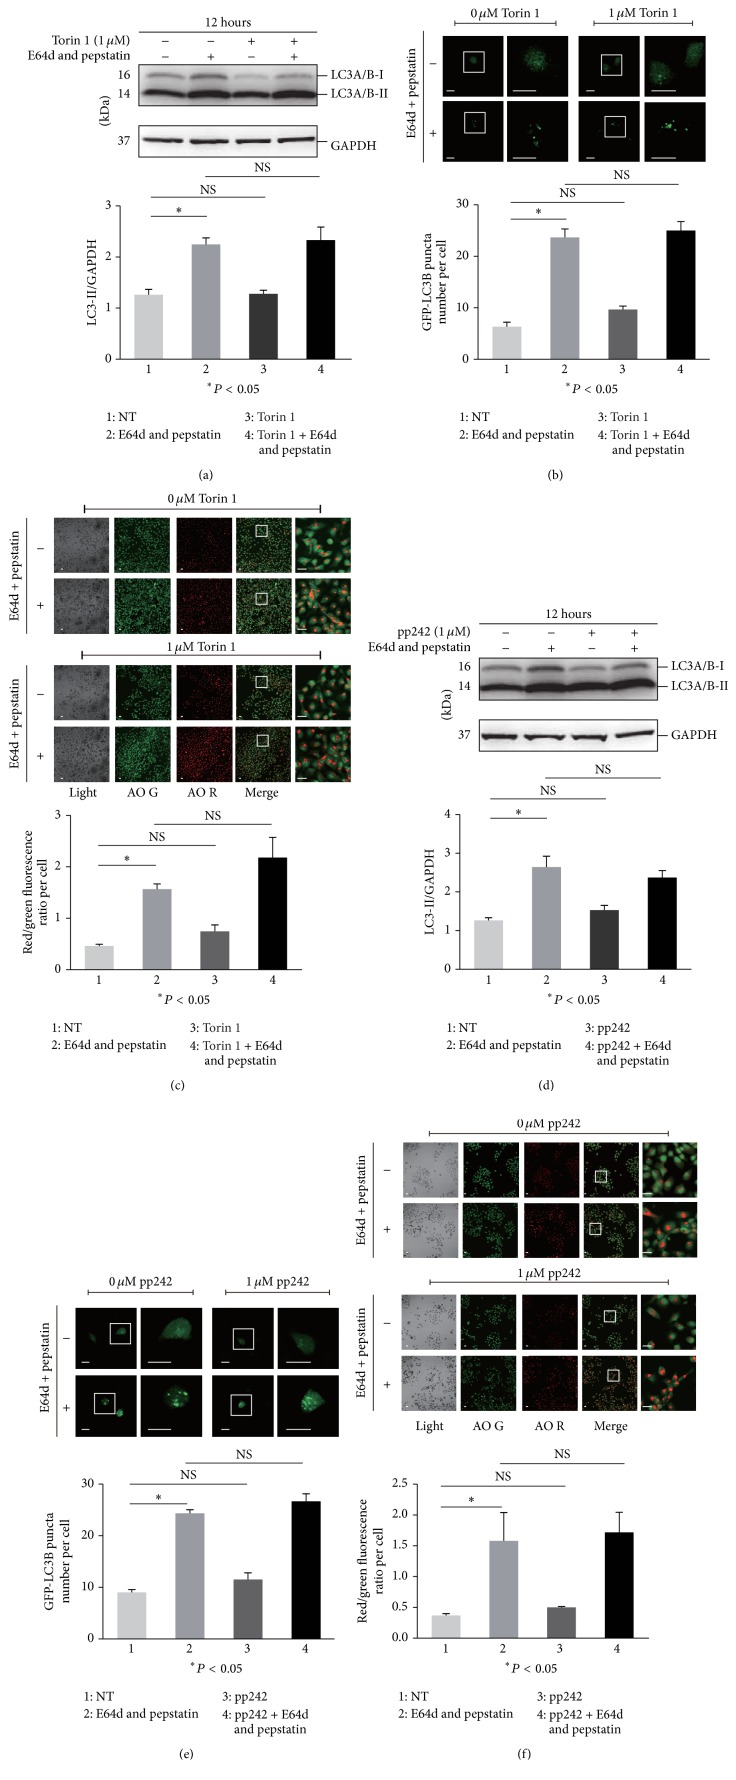
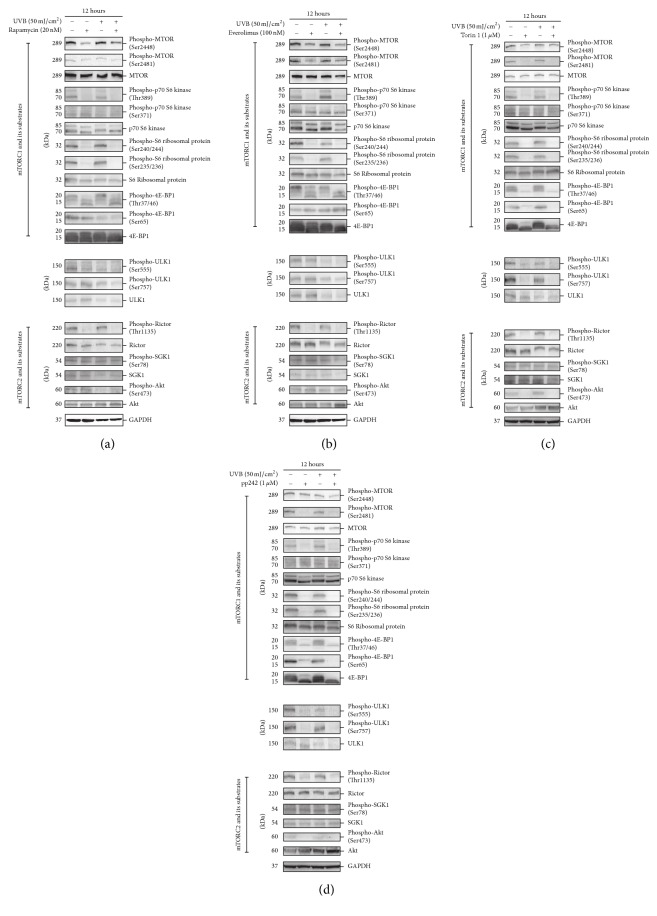
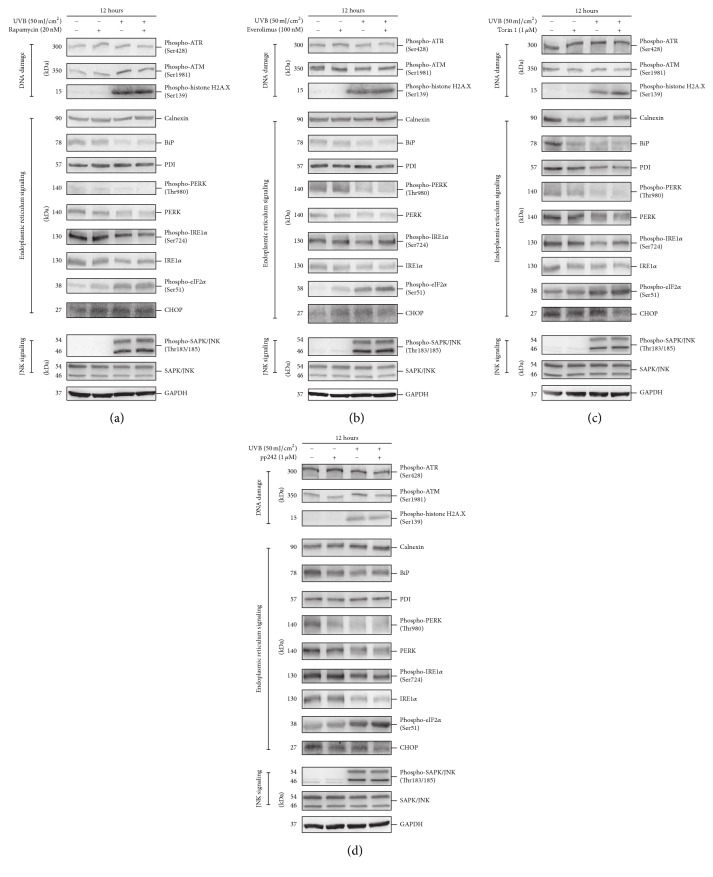
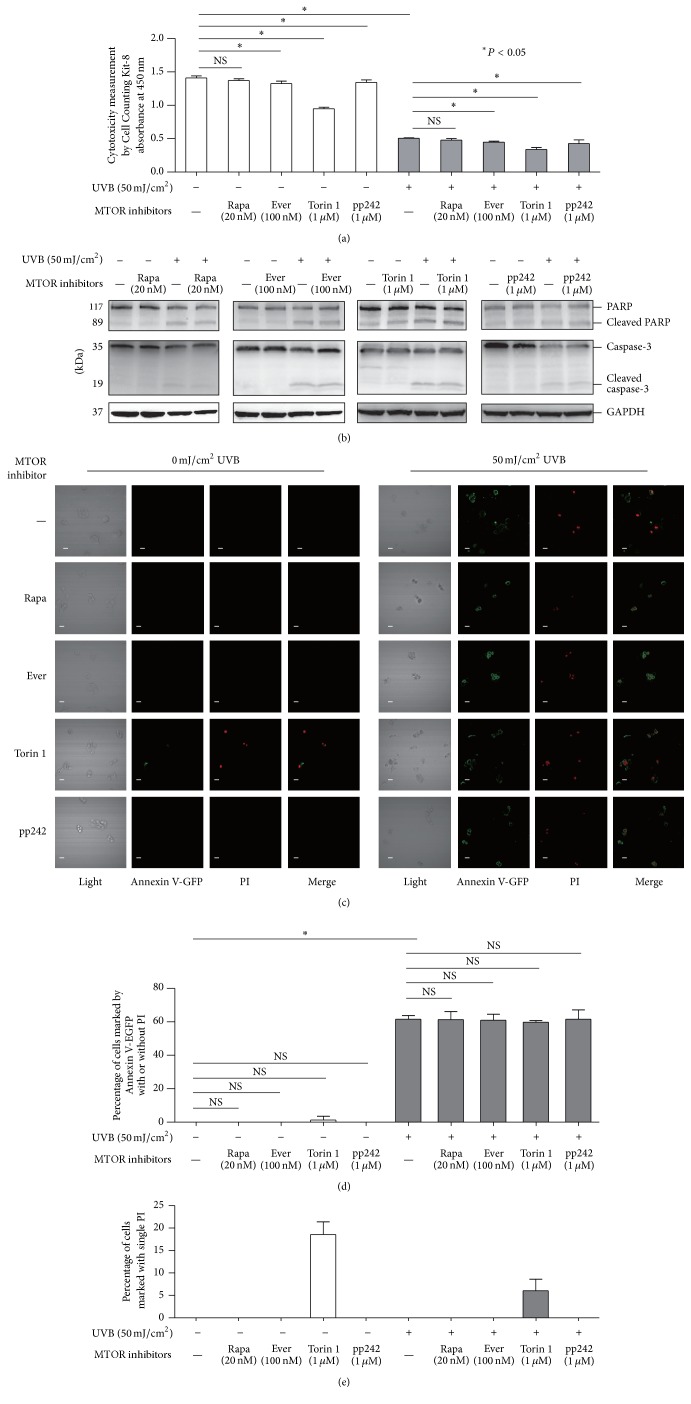
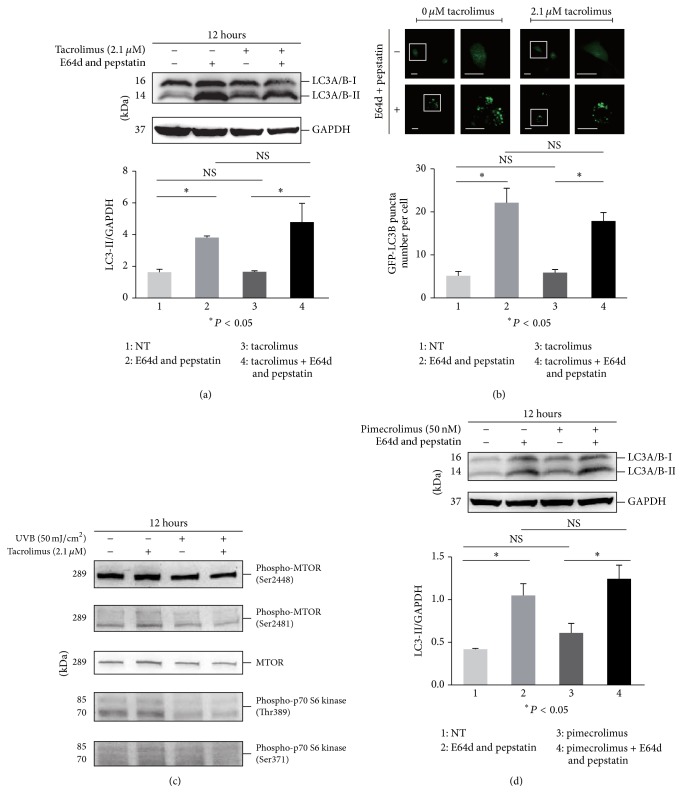
The mechanistic target of Rapamycin (MTOR) protein is a crucial signaling regulator in mammalian cells that is extensively involved in cellular biology. The function of MTOR signaling in keratinocytes remains unclear. In this study, we detected the MTOR signaling and autophagy response in the human keratinocyte cell line HaCaT and human epidermal keratinocytes treated with MTOR inhibitors. Moreover, we detected the impact of MTOR inhibitors on keratinocytes exposed to the common carcinogenic stressors ultraviolet B (UVB) and UVA radiation. As a result, keratinocytes were sensitive to the MTOR inhibitors Rapamycin, everolimus, Torin 1, and pp242, but the regulation of MTOR downstream signaling was distinct. Next, autophagy induction only was observed in HaCaT cells treated with Rapamycin. Furthermore, we found that MTOR signaling was insensitive to UVB but sensitive to UVA radiation. UVB treatment also had no impact on the inhibition of MTOR signaling by MTOR inhibitors. Finally, MTOR inhibition by Rapamycin, everolimus, or pp242 did not affect the series of biological events in keratinocytes exposed to UVB, including the downregulation of BiP and PERK, activation of Histone H2A and JNK, and cleavage of caspase-3 and PARP. Our study demonstrated that MTOR inhibition in keratinocytes cannot always induce autophagy, and the MTOR pathway does not play a central role in the UVB triggered cellular response.


Figures

Figure 1
Figure 1
HaCaT cells were treated with or without different doses of Rapamycin ((a) 10, 20, and 40 nM), everolimus ((c) 50, 100, and 200 nM), Torin 1 ((e) 0.5, 1, and 2 μM), or pp242 ((g) 0.5, 1, and 2 μM) for 12 hours. Then, the HaCaT cells were treated with Rapamycin ((b) 20 nM), everolimus ((d) 100 nM), Torin 1 ((f) 1 μM), or pp242 ((h) 1 μM) for 4, 12, or 24 hours. Western blotting analysis was performed using primary antibodies against MTOR and phospho-Ser2481 mTOR. GAPDH served as a loading control. (i) HEKs were treated with or without Rapamycin (20 nM), everolimus (100 nM), Torin 1 (1 μM), or pp242 (1 μM) for 12 hours. HaCaT cells were treated with Rapamycin (20 nM), everolimus (100 nM), Torin 1 (1 μM), or pp242 (1 μM) for BrdU incorporation assay (j) and cell migration assay (k). The data were presented as means ± SD from three independent experiments and the representative figures were shown. Rapa: Rapamycin; Ever: everolimus; NS: nonsense.
Figure 2
Figure 2
HaCaT cells were treated with or without 20 nM Rapamycin (a) or 100 nM everolimus (d) for 12 hours in the presence or absence of E64d (10 μg/mL) and pepstatin (10 μg/mL). Then, the cell lysate was subjected to determine the level of LC3 protein by western blotting. GAPDH served as a loading control. The ratios of LC3-II/GAPDH were calculated, and statistical differences between treatment and nontreatment (NT) were analyzed. HaCaT cells were pretreated with or without GFP-LC3B before Rapamycin (b) or everolimus (e) treatment for 12 hours in the presence or absence of E64d and pepstatin. HaCaT cells were treated with or without Rapamycin (c) or everolimus (f) for 12 hours in the presence or absence of E64d and pepstatin. Then, cells were incubated with AO. The cells (b, e, c, and f) were imaged by a laser scanning confocal microscope, and the means of GFP-LC3 puncta or red/green fluorescence ratios for individual cells were determined for statistical analysis. The data were shown as means ± SD from three independent experiments and the representative figures were shown. Bars = 20 μm. NS: nonsense.
Figure 3
Figure 3
HaCaT cells were treated with or without 1 μM Torin 1 (a) or 1 μM pp242 (d) for 12 hours in the presence or absence of E64d and pepstatin. Then, the cell lysate was subjected to determine the level of LC3 protein by western blotting. GAPDH served as a loading control. The ratios of LC3-II/GAPDH were calculated, and statistical differences between treatment and nontreatment (NT) were analyzed. HaCaT cells were pretreated with or without GFP-LC3B before Torin 1 (b) or pp242 (e) treatment for 12 hours in the presence or absence of E64d and pepstatin. HaCaT cells were treated with or without Torin 1 (c) or pp242 (f) for 12 hours in the presence or absence of E64d and pepstatin. Then, cells were incubated with AO. The cells (b, e, c, and f) were imaged by a laser scanning confocal microscope, and the means of GFP-LC3 puncta or red/green fluorescence ratios for individual cells were determined for statistical analysis. The data were shown as means ± SD from three independent experiments and the representative figures were shown. Bars = 20 μm. NS: nonsense.
Figure 4
Figure 4
HaCaT cells were treated with or without 50 mJ/cm2 UVB and then incubated in the presence or absence of 20 nM Rapamycin (a), 100 nM everolimus (b), 1 μM Torin 1 (c), or 1 μM pp242 (d) for 12 hours. Western blotting was performed using primary antibodies against MTOR, phospho-Ser2448 or Ser2481 MTOR, p70 S6 kinase, phospho-Thr389 or Ser371 p70 S6 kinase, S6 ribosomal protein, phospho-Ser240/244 or Ser235/236 S6 ribosomal protein, 4E-BP1, phospho-Thr37/46 or Ser65 4E-BP1, ULK1, phospho-Ser555 or Ser757 ULK1, Rictor, phospho-Thr1135 Rictor, SGK1, phospho-Ser78 SGK1, Akt, and phospho-Ser473 Akt. GAPDH served as a loading control. Representative figures were exhibited from three independent experiments.
Figure 5
Figure 5
HaCaT cells were treated with or without 50 mJ/cm2 UVB and then incubated in the presence or absence of 20 nM Rapamycin (a), 100 nM everolimus (b), 1 μM Torin 1 (c), or 1 μM pp242 (d) for 12 hours. Western blotting analysis was performed using primary antibodies against phospho-Ser428 ATR, phospho-Ser1981 ATM, phospho-Ser139 H2A X, Calnexin, BiP, PDI, phospho-Thr980 PERK, PERK, phospho-Ser724 IRE1α, IRE1α, phospho-Ser51 eIF2α, CHOP, phospho-Thr183/185 SAPK/JNK, and SAPK/JNK. GAPDH served as a loading control. Representative figures were exhibited from three independent experiments.
Figure 6
Figure 6
HaCaT cells were treated with or without 50 mJ/cm2 UVB and then incubated in the presence or absence of 20 nM Rapamycin, 100 nM everolimus, 1 μM Torin 1, or 1 μM pp242 for 12 hours. Cytotoxicity measurement was performed using Cell Counting Kit-8 (a). Western blotting analysis was performed using primary antibodies against PARP, cleaved PARP, caspase-3, and cleaved caspase-3 (b). GAPDH served as a loading control. The cells were imaged for Annexin V-EGFP apoptosis detection using a laser scanning confocal microscope (c). The percentages of cells marked by Annexin V-EGFP with or without PI (d) or single PI (e) were calculated. The individual experiment was performed three times, and the results were obtained for statistical analysis. Representative figures were shown from three independent experiments. Bars = 20 μm. Rapa: Rapamycin; Ever: everolimus. NS: nonsense. P < 0.05.
Figure 7
Figure 7
HaCaT cells were treated with or without 2.1 μM tacrolimus (a–c) or 50 nM pimecrolimus (d) for 12 hours in the presence or absence of E64d and pepstatin. Then, the cell lysate was subjected to determine the level of LC3 protein (a and d) and MTOR and p70 S6 kinase as well as their phosphorylation (c) by western blotting. GAPDH served as a loading control. HaCaT cells were pretreated with or without GFP-LC3B before tacrolimus (b) treatment for 12 hours in the presence or absence of E64d and pepstatin. The cells (b) were imaged by a laser scanning confocal microscope, and the means of GFP-LC3 puncta for individual cells were determined for statistical analysis. The data were shown as means ± SD from three independent experiments and the representative figures were exhibited. Bars = 20 μm. NS: nonsense.

Similar articles

Cited by

References

    1. Ding X., Bloch W., Iden S., et al. mTORC1 and mTORC2 regulate skin morphogenesis and epidermal barrier formation. Nature Communications. 2016;7, article 13226 doi: 10.1038/ncomms13226. - DOI - PMC - PubMed
    1. Jung C. H., Ro S.-H., Cao J., Otto N. M., Kim D.-H. MTOR regulation of autophagy. FEBS Letters. 2010;584(7):1287–1295. doi: 10.1016/j.febslet.2010.01.017. - DOI - PMC - PubMed
    1. Laplante M., Sabatini D. M. An emerging role of mTOR in lipid biosynthesis. Current Biology. 2009;19(22):R1046–R1052. doi: 10.1016/j.cub.2009.09.058. - DOI - PMC - PubMed
    1. Rosner M., Hengstschläger M. mTOR protein localization is cell cycle regulated. Cell Cycle. 2011;10(20):3608–3610. doi: 10.4161/cc.10.20.17855. - DOI - PubMed
    1. Laplante M., Sabatini D. M. MTOR signaling in growth control and disease. Cell. 2012;149(2):274–293. doi: 10.1016/j.cell.2012.03.017. - DOI - PMC - PubMed

MeSH terms

LinkOut - more resources