. 2017 Mar 1;7(3):433-447.
eCollection 2017.

Gpr110 deficiency decelerates carcinogen-induced hepatocarcinogenesis via activation of the IL-6/STAT3 pathway

Affiliations

Gpr110 deficiency decelerates carcinogen-induced hepatocarcinogenesis via activation of the IL-6/STAT3 pathway

Benting Ma et al. Am J Cancer Res. .

Abstract

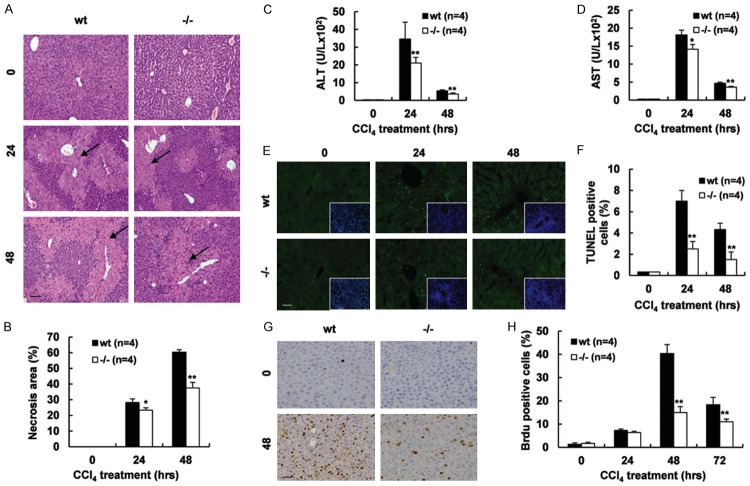
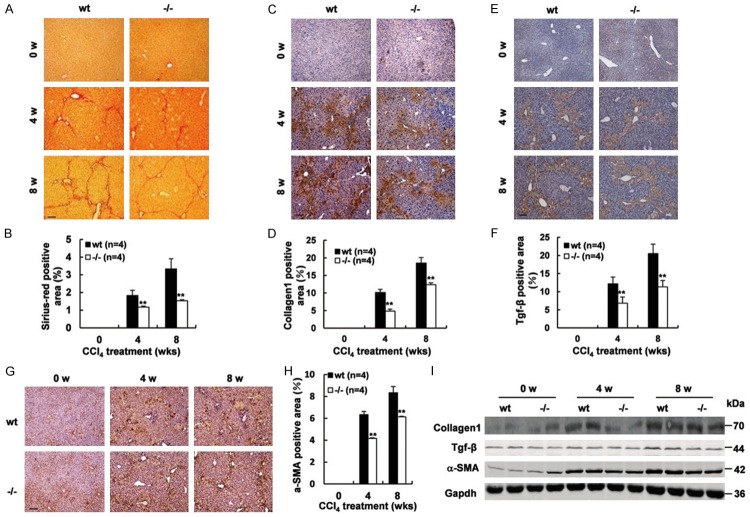
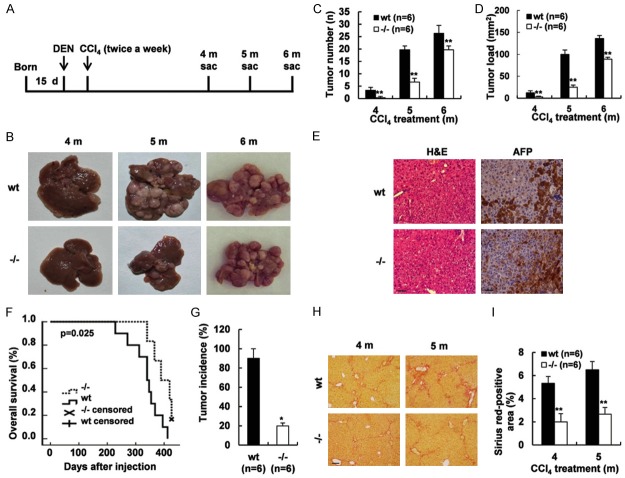
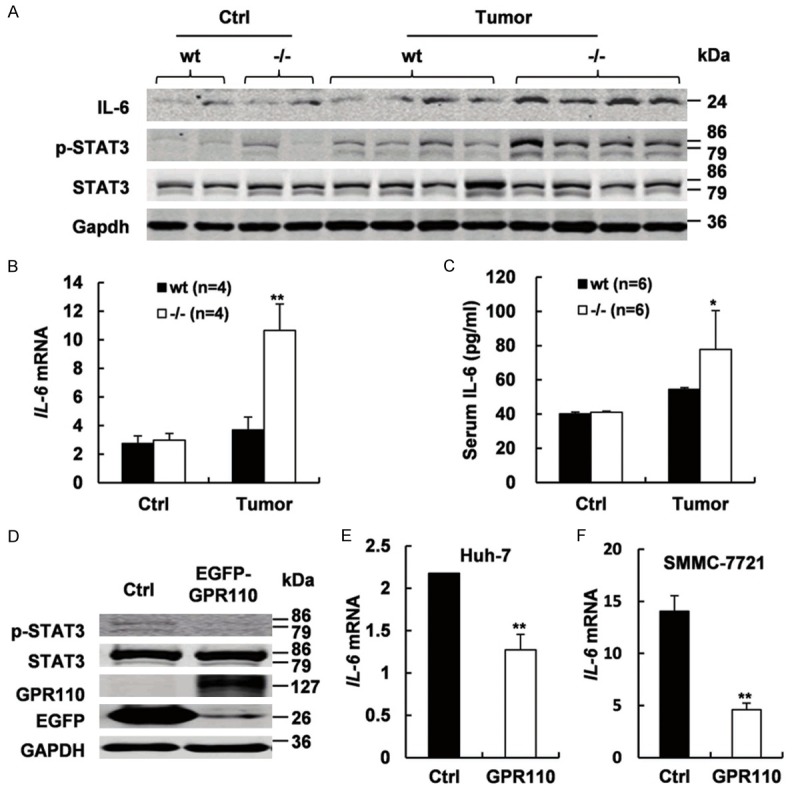
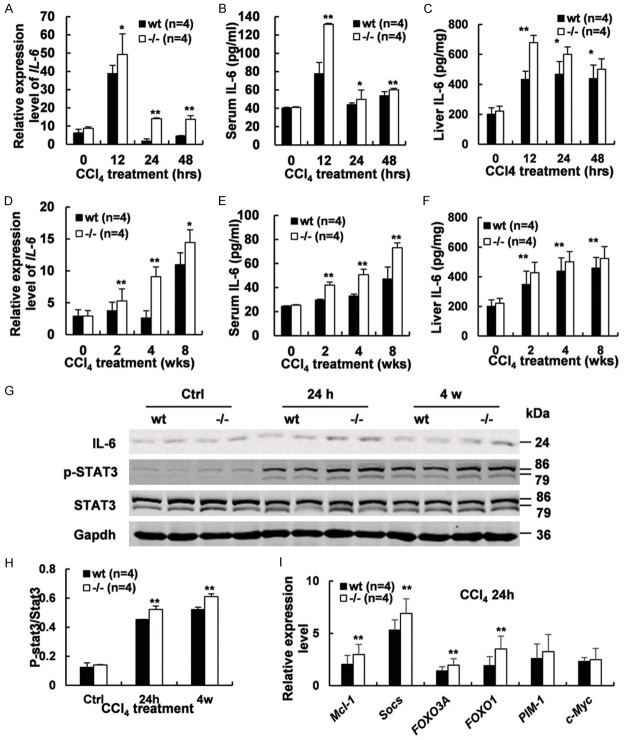
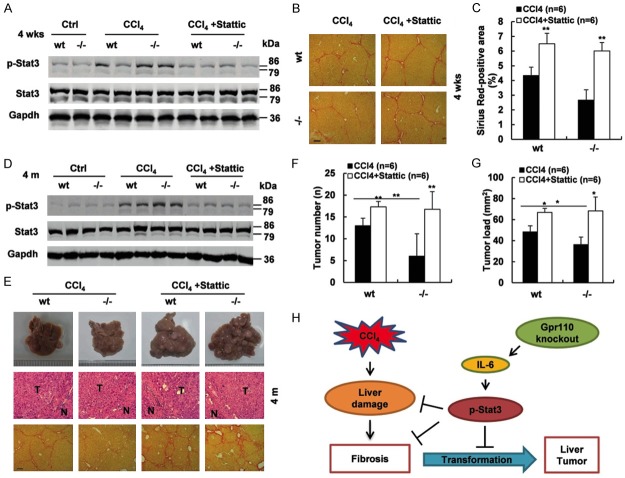
Hepatocarcinogenesis is a complex process that includes pronounced necroinflammation, unregulated hepatocyte damage, subsequent extensive fibrosis, and carcinogenesis. GPR110 was an adhesion G protein-coupled receptor. Analysis of the expression pattern of Gpr110 in mice displayed that Gpr110 was expressed highly in liver, implicating the tissue compartments where Gpr110 could execute its functions, the role of Gpr110 in the physiological and pathological state of liver remains unclear. Based on a Gpr110 knockout mouse model, we evaluated the role of Gpr110 in hepatocarcinogenesis by using a carbon tetrachloride (CCl4)-induced liver injury and fibrosis model, as well as diethylnitrosamine (DEN) plus CCl4-induced liver cancer model. In this study, we found subdued chronic liver injury, reduced compensatory proliferation, lower liver fibrosis, but enhanced inflammation occurred in Gpr110-/- mice during CCl4 challenge. In addition, Gpr110-/- mice were resistant to liver tumorigenesis induced by DEN plus CCl4 injection. Molecular mechanisms underlying these differences correlated with augmented activation of the IL-6/STAT3 pathway, which exerted hepatoprotective effects during liver damage, fibrosis, and oncogenesis in Gpr110-/- mice. Furthermore, pharmacological inhibition of the activation of the IL-6/STAT3 pathway enhanced hepatic fibrosis and promoted DEN plus CCl4-induced carcinogenesis in Gpr110-/- mice. In summary, absence of Gpr110 decelerates liver fibrosis/cirrhosis progressing into tumorigenesis, due to strengthening activation of the IL-6/STAT3 pathway, leading to a weaker liver injury and fibrosis microenvironment. It is indicated that targeting Gpr110 and activating the IL-6/STAT3 pathway may be considered to be preventive methods for some cirrhosis transition.

Keywords: CCl4; Gpr110; fibrosis; hepatocarcinogenesis; knockout mouse model.


Figures

Figure 1
Figure 1
Disruption of Gpr110 weakened CCl4-induced hepatic acute injury and hepatocyte compensatory proliferation. (A, B) H&E staining of sacrificed Gpr110-/- mice and wild-type littermate liver sections (100×), mice were treated CCl4 for 0-, 24- and 48 hours (A). Scalebar, 100 μm. Percentage of necrosis area were quantified with the ImageJ software and statistical analyzed (B). Values are presented as mean ± SD. *P<0.05; **P<0.01. (C, D) Serum ALT, AST levels were determined at 0, 24 and 48 hours after the CCl4 injection (n=4) and statistical analyzed. Values are presented as mean ± SD. *P<0.05; **P<0.01. (E, F) TUNEL staining of liver sections from 0-, 24- and 48 hours after the CCl4 injection-sacrificed Gpr110-/- mice and wild-type littermate mice liver (200×) (E). Scalebar, 50 μm. Quantified by statistical analyzing percentage of positive cells in 20 high-power fields (F). Values are presented as mean ± SD. *P<0.05; **P<0.01. (G, H) Representative immunohistochemical staining of BrdU, sections from 0- and 48 hours after the CCl4 injection-sacrificed Gpr110-/- mice and wild-type littermate mice liver (200×) (G). Scalebar, 50 μm. Quantified by statistical analyzing percentage of positive cells in 20 high-power fields (H). Values are presented as mean ± SD. *P<0.05; **P<0.01.
Figure 2
Figure 2
Deletion of Gpr110 caused less evident liver fibrosis and HSC activation upon chronic CCl4 challenges. (A, B) Mice were treated with CCl4 for 0, 4 and 8 weeks (n=6). Siriusred staining sections from 0-, 4- and 8 weeks after the CCl4 injection-sacrificed Gpr110-/- mice and wild-type littermate mice liver (100×) (A). Scalebar, 100 μm. Percentage of Sirius red positive area were quantified with the ImageJ software and statistical analyzed (B). Values are presented as mean ± SD. *P<0.05; **P<0.01. (C, D) Immunostaining of Collagen1, sections from 0-, 4- and 8 weeks after the CCl4 injection -sacrificed Gpr110-/- mice and wild-type littermate mice liver (100×) (C). Scalebar, 100 μm. Percentage of collagen1 positive area were quantified with the ImageJ software and statistical analyzed (D). Values are presented as mean ± SD. *P<0.05; **P<0.01. (E, F) Immunostaining of Tgf-β, sections from 0-, 4- and 8 weeks after the CCl4 injection-sacrificed Gpr110-/- mice and wild-type littermate mice liver (100×) (E). Scalebar, 100 μm. Percentage of Tgf-β positive area were quantified with the ImageJ software and statistical analyzed (F). Values are presented as mean ± SD. *P<0.05; **P<0.01. (G, H) Immunostaining of α-SMA, sections from 0-, 4- and 8 weeks after the CCl4 injection-sacrificed mice liver (100×) (G). Scalebar, 100 μm. Percentage of Tgf-β positive area were quantified with the ImageJ software and statistical analyzed (H). Values are presented as mean ± SD. *P<0.05; **P<0.01. (I) Western blot analysis of Collagen1, Tgf-β and α-SMA in 0-week, 4-week and 8-week CCl4-treated Gpr110-/- mice and wild-type littermate mice liver.
Figure 3
Figure 3
Deletion of Gpr110 decelerated hepatocarcinogenesis in chronically injured livers. (A) Schematic diagram of the progression of DEN plus CCl4-induced mouse HCC model. (B) Macroscopic liver appearance of Gpr110-/- mice and wild-type littermates injected with DEN plus CCl4 at different time points (n=6). (C, D) Statistical analysis of Tumor number and Tumor load about Gpr110-/- mice and wild-type littermates injected with DEN plus CCl4 at different time points (n=6) Values are presented as mean ± SD. *P<0.05; **P<0.01. (E) H&E staining and immunohistochemical staining of AFP in tumor area about liver sections from Gpr110-/- mice and wild-type littermates injected with DEN plus CCl4 after 5 months. Scalebar, 50 μm. (F) The survival curves of Gpr110-/- mice (n=10) and control littermates (n=7) (P<0.05) after DEN+CCl4 treated. (G) After 4 months CCl4 treated Gpr110-/- mice (n=6) and control littermates (n=6), Tumor incidence was determined and statistical analyzed (P<0.05). (H, I) Liver sections from (b) were collected for Sirius red staining (100×) (H). Scalebar, 100 μm. Quantified and statistical analyzed (I). Values are presented as mean ± SD. *P<0.05; **P<0.01.
Figure 4
Figure 4
Gpr110-/- mice exhibited sustained increased IL-6/STAT3 pathway activation in liver tumors. A. Immunoblot staining analysis of IL-6, p-STAT3, and total STAT3 in olive oil and DEN plus CCl4-treated 5 month Gpr110-/- mice and wild-type littermate mice liver (n=6). B. qRT-PCR analysis of IL-6 expression in olive oil and DEN plus CCl4-treated 5 months Gpr110-/- mice and wild-type littermate mice livers (n=4). Values are presented as mean ± SD from three independent experiments. *P<0.05; **P<0.01. C. ELISA analysis of serum levels of IL-6 in olive oil and DEN plus CCl4-treated 5 months Gpr110-/- mice and wild-type littermate mice livers (n=4). Values are presented as mean ± SD. *P<0.05; **P<0.01. D. Western blot analysis of GFP, p-STAT3, and total STAT3 in Huh-7 and SMMC-7721 cells after instantaneous overexpression of GPR110. E, F. qRT-PCR analysis of IL-6 expression in Huh-7 and SMMC-7721 cells after instantaneous overexpression of GPR110. Values are presented as mean ± SD from three independent experiments. *P<0.05; **P<0.01.
Figure 5
Figure 5
Enhanced IL-6/STAT3 pathway activation was detected in Gpr110-/- mice during liver injury and fibrosis. (A-C) qRT-PCR, ELISA analysis of serum levels of IL-6 and ELISA analysis of liver levels of IL-6 expression in Gpr110-/- mice and wild-type littermates treated with CCl4 for 0, 12, 24, and 48 hours (n=4). Values are presented as mean ± SD from three independent experiments. *P<0.05; **P<0.01. (D-F) qRT-PCR, ELISA analysis of serum levels of IL-6 and ELISA analysis of liver levels of IL-6 expression in Gpr110-/- mice and wild-type littermates treated with CCl4 for 0, 2, 4, and 8 weeks (n=4). Values are presented as mean ± SD from three independent experiments. *P<0.05; **P<0.01. (G) Immunoblot staining analysis of IL-6, p-STAT3, and total STAT3 in Gpr110-/- mice and wild-type littermate liver treated with CCl4 for 0 h, 24 h and four weeks. (H) Quantification and statistical analysis of STAT3 activation detected by Immunoblot staining in (G). Values are presented as mean ± SD. *P<0.05; **P<0.01. (I) qRT-PCR analysis of classical STAT3 target genes, Mcl-1, Socs, FOXO3A, FOXO1, Pim-1 and c-Myc in Gpr110-/- mice and wild-type littermate liver treated with CCl4 for 24 h. Values are presented as mean ± SD from three independent experiments. *P<0.05; **P<0.01.
Figure 6
Figure 6
p-STAT3 inhibitor promoted liver fibrosis and carcinogenesis in Gpr110-/- mice after CCl4 exposure. (A) Immunoblot staining analysis of p-STAT3 and total STAT3 in Gpr110-/- mice and wild-type littermate liver. Mice were treated with CCl4 and CCl4 plus Stattic for four weeks (n=6). (B, C) Sirius red staining of liver sections from (a) (100×) (B). Scalebar, 100 μm. Quantifications and statistical analysis (C). Values are presented as mean ± SD. *P<0.05; **P<0.01. (D) Immunoblot staining analysis of p-STAT3 and total STAT3 in DEN plus CCl4 and DEN plus CCl4 plus Stattic-treated Gpr110-/- mice and wild-type mice livers (n=6). (E) Macroscopic liver appearance of Gpr110-/- mice and wild-type littermates. H&E (200×). Scalebar, 50 μm. Sirius red staining (100×) of mice treated with CCl4 or CCl4 plus Stattic for four months. Scalebar, 100 μm. (F, G) Tumor number and Tumor load from (E) were quantified and statistical analyzed (n=6). Values are presented as mean ± SD. *P<0.05; **P<0.01. (H) Schematic representation of the function and potential mechanism of Gpr110 in liver malignant transformation.

Similar articles

Cited by

References

    1. Llovet JM, Burroughs A, Bruix J. Hepatocellular carcinoma. Lancet. 2003;362:1907–1917. - PubMed
    1. Mu X, Espanol-Suner R, Mederacke I, Affo S, Manco R, Sempoux C, Lemaigre FP, Adili A, Yuan D, Weber A, Unger K, Heikenwalder M, Leclercq IA, Schwabe RF. Hepatocellular carcinoma originates from hepatocytes and not from the progenitor/biliary compartment. J Clin Invest. 2015;125:3891–3903. - PMC - PubMed
    1. El-Serag HB, Rudolph KL. Hepatocellular carcinoma: epidemiology and molecular carcinogenesis. Gastroenterology. 2007;132:2557–2576. - PubMed
    1. Friedman SL. Evolving challenges in hepatic fibrosis. Nat Rev Gastroenterol Hepatol. 2010;7:425–436. - PubMed
    1. Bjarnadottir TK, Fredriksson R, Hoglund PJ, Gloriam DE, Lagerstrom MC, Schioth HB. The human and mouse repertoire of the adhesion family of G-protein-coupled receptors. Genomics. 2004;84:23–33. - PubMed

LinkOut - more resources