Inhibition of STAT3 signaling blocks obesity-induced mammary hyperplasia in a mouse model
- PMID: 28401024
- PMCID: PMC5385655
Inhibition of STAT3 signaling blocks obesity-induced mammary hyperplasia in a mouse model
Abstract
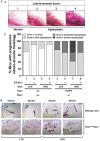
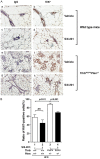
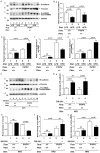
Compelling epidemiologic evidence indicates that obesity is a risk factor for human cancers, including breast. However, molecular mechanisms by which obesity could contribute to the development of breast cancer remain unclear. To understand the impact of obesity on breast cancer development, we used a mutant mouse that expresses a mutated thyroid hormone receptor β (denoted as PV) with haplodeficiency of the Pten gene (ThrbPV/PVPten+/- mice). We previously showed that adult nulliparous female ThrbPV/PVPten+/- mice developed extensive mammary hyperplasia and breast tumors. In this study, we induced obesity in ThrbPV/PVPten+/- mice by feeding them a high fat diet (HFD). We found HFD exacerbated the extent of mammary hyperplasia in ThrbPV/PVPten+/- mice. HFD elevated serum leptin levels but had no effect on the levels of serum thyroid stimulating hormone, thyroid hormones, and estrogens. Molecular analysis showed that the obesity-induced hyperplasia was mediated by the leptin/leptin receptor-JAK1-STAT3 pathway to increase key cell cycle regulators to stimulate mammary epithelial cell proliferation. Activated STAT3 signaling led to altered expression in the key regulators of epithelial-mesenchymal-transition (EMT) to augment invasiveness and migration of mammary proliferating epithelial cells. Moreover, treatment of HFD-ThrbPV/PVPten+/- mice with a STAT3 inhibitor, S3I-201, markedly reversed the obesity-induced mammary hyperplasia and reduced EMT signals to lessen cell invasiveness and migration. Our studies not only elucidated how obesity could contribute to mammary hyperplasia at the molecular level, but also, importantly, demonstrated that inhibition of the STAT3 activity could be a novel treatment strategy for obesity-induced breast cancer progression.
Keywords: JAK2-STAT3 signaling; Mammary carcinogenesis; STAT3 inhibitor; obesity; preclinical mouse model; thyroid hormone receptor β mutant.
Figures


Similar articles
-
Inhibition of STAT3 activity delays obesity-induced thyroid carcinogenesis in a mouse model.Endocr Relat Cancer. 2016 Jan;23(1):53-63. doi: 10.1530/ERC-15-0417. Epub 2015 Nov 9. Endocr Relat Cancer. 2016. PMID: 26552408 Free PMC article.
-
Diet-induced obesity increases tumor growth and promotes anaplastic change in thyroid cancer in a mouse model.Endocrinology. 2013 Aug;154(8):2936-47. doi: 10.1210/en.2013-1128. Epub 2013 Jun 7. Endocrinology. 2013. PMID: 23748362 Free PMC article.
-
Metformin and JQ1 synergistically inhibit obesity-activated thyroid cancer.Endocr Relat Cancer. 2018 Oct;25(10):865-877. doi: 10.1530/ERC-18-0071. Epub 2018 Jun 18. Endocr Relat Cancer. 2018. PMID: 29914872 Free PMC article.
-
Extranuclear signaling of mutated thyroid hormone receptors in promoting metastatic spread in thyroid carcinogenesis.Steroids. 2011 Aug;76(9):885-91. doi: 10.1016/j.steroids.2011.03.016. Epub 2011 Apr 5. Steroids. 2011. PMID: 21473875 Free PMC article. Review.
-
Role of hormones in mammary cancer initiation and progression.J Mammary Gland Biol Neoplasia. 1998 Jan;3(1):49-61. doi: 10.1023/a:1018770218022. J Mammary Gland Biol Neoplasia. 1998. PMID: 10819504 Review.
Cited by
-
Lipids and cancer: Emerging roles in pathogenesis, diagnosis and therapeutic intervention.Adv Drug Deliv Rev. 2020;159:245-293. doi: 10.1016/j.addr.2020.07.013. Epub 2020 Jul 23. Adv Drug Deliv Rev. 2020. PMID: 32711004 Free PMC article. Review.
-
Adipokines and epithelial-mesenchymal transition (EMT) in cancer.Mol Cell Biochem. 2023 Nov;478(11):2419-2433. doi: 10.1007/s11010-023-04670-x. Epub 2023 Jan 30. Mol Cell Biochem. 2023. PMID: 36715963 Review.
-
Advances in the Prevention and Treatment of Obesity-Driven Effects in Breast Cancers.Front Oncol. 2022 Jun 22;12:820968. doi: 10.3389/fonc.2022.820968. eCollection 2022. Front Oncol. 2022. PMID: 35814391 Free PMC article.
-
Leptin Regulation of Cancer Stem Cells in Breast and Gynecologic Cancer.Endocrinology. 2018 Aug 1;159(8):3069-3080. doi: 10.1210/en.2018-00379. Endocrinology. 2018. PMID: 29955847 Free PMC article. Review.
-
Obesity and Androgen Receptor Signaling: Associations and Potential Crosstalk in Breast Cancer Cells.Cancers (Basel). 2021 May 6;13(9):2218. doi: 10.3390/cancers13092218. Cancers (Basel). 2021. PMID: 34066328 Free PMC article. Review.
References
-
- Siegel R, Naishadham D, Jemal A. Cancer statistics, 2013. CA Cancer J Clin. 2013;63:11–30. - PubMed
-
- Rose DP, Vona-Davis L. Influence of obesity on breast cancer receptor status and prognosis. Expert Rev Anticancer Ther. 2009;9:1091–1101. - PubMed
-
- Vrieling A, Buck K, Kaaks R, Chang-Claude J. Adult weight gain in relation to breast cancer risk by estrogen and progesterone receptor status: a meta-analysis. Breast Cancer Res Treat. 2010;123:641–649. - PubMed
-
- Renehan AG, Tyson M, Egger M, Heller RF, Zwahlen M. Body-mass index and incidence of cancer: a systematic review and meta-analysis of prospective observational studies. Lancet. 2008;371:569–578. - PubMed
-
- Neuhouser ML, Aragaki AK, Prentice RL, Manson JE, Chlebowski R, Carty CL, Ochs-Balcom HM, Thomson CA, Caan BJ, Tinker LF, Urrutia RP, Knudtson J, Anderson GL. Overweight, Obesity, and Postmenopausal Invasive Breast Cancer Risk: A Secondary Analysis of the Women’s Health Initiative Randomized Clinical Trials. JAMA Oncol. 2015;1:611–621. - PMC - PubMed
LinkOut - more resources
Full Text Sources
Research Materials
Miscellaneous
