. 2017 May;8(5):365-378.
doi: 10.1007/s13238-017-0397-3. Epub 2017 Apr 11.

CRISPR/Cas9-mediated targeted gene correction in amyotrophic lateral sclerosis patient iPSCs

Affiliations

CRISPR/Cas9-mediated targeted gene correction in amyotrophic lateral sclerosis patient iPSCs

Lixia Wang et al. Protein Cell. 2017 May.

Abstract

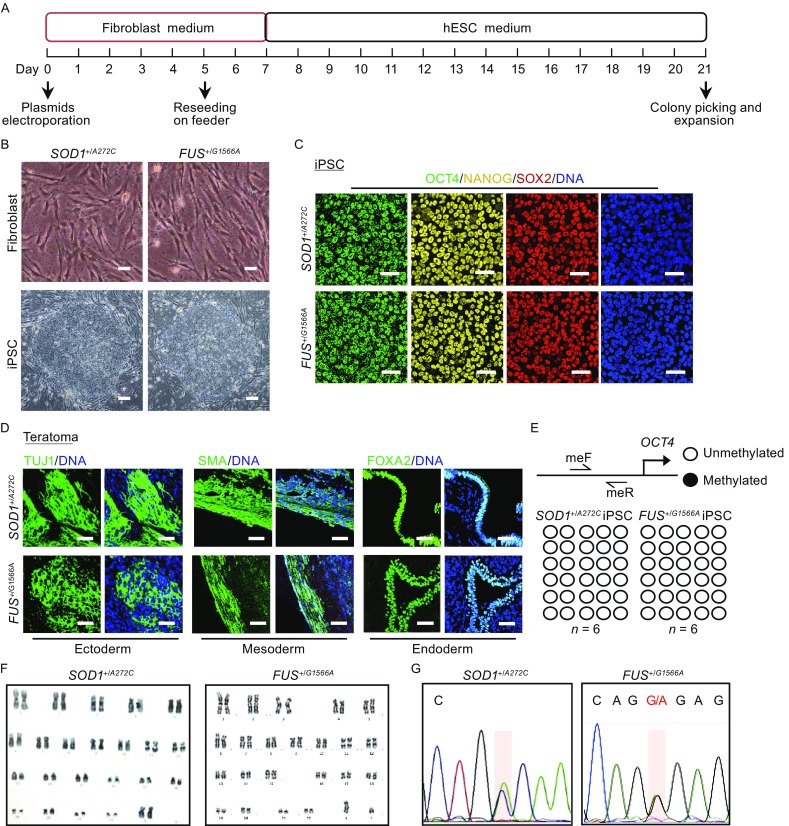
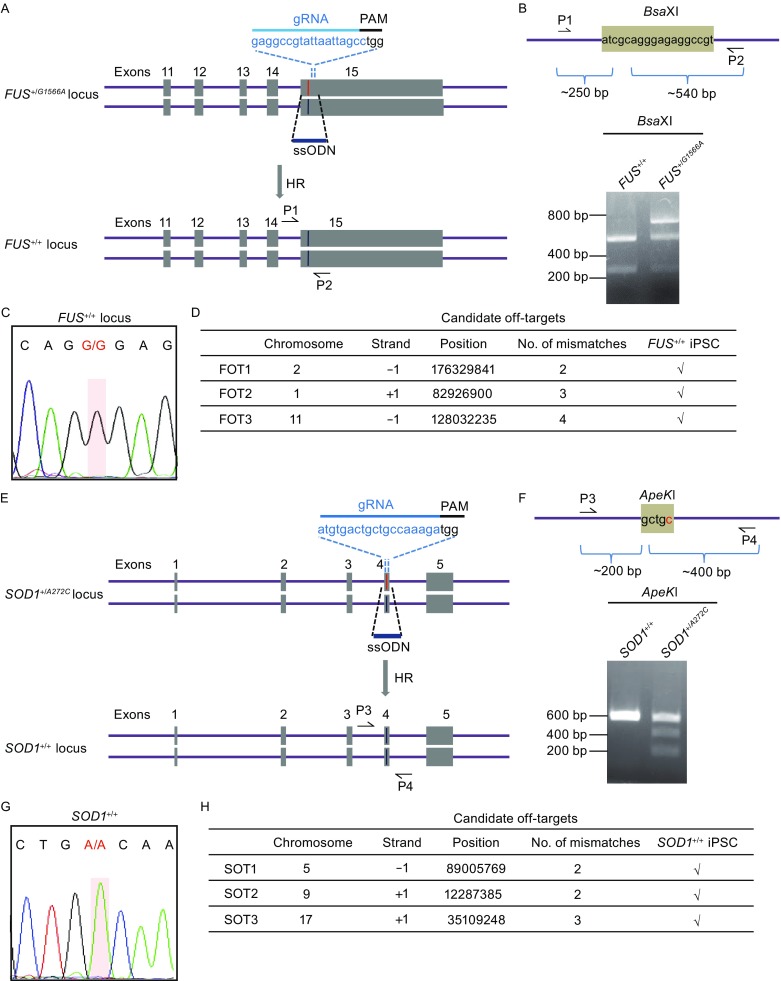
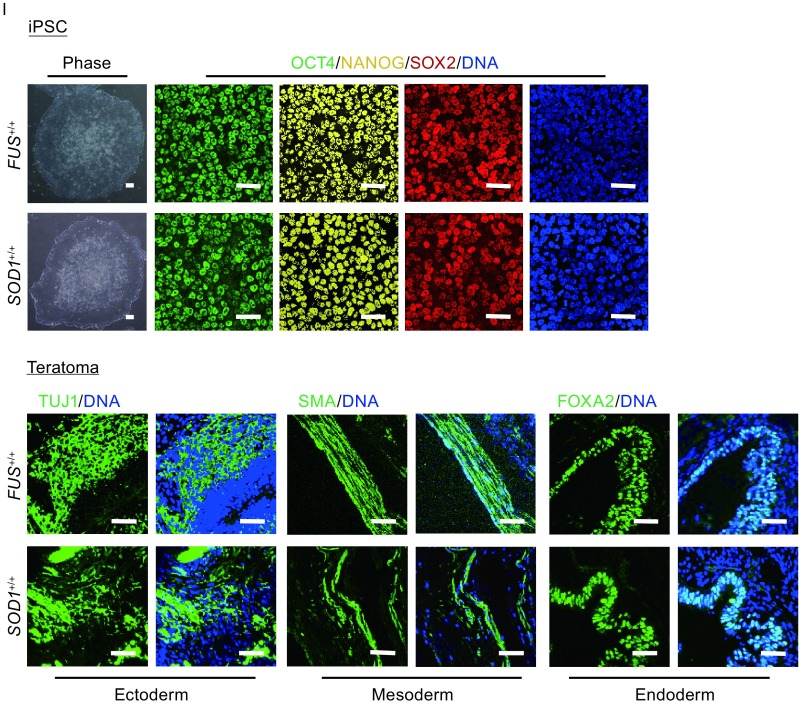
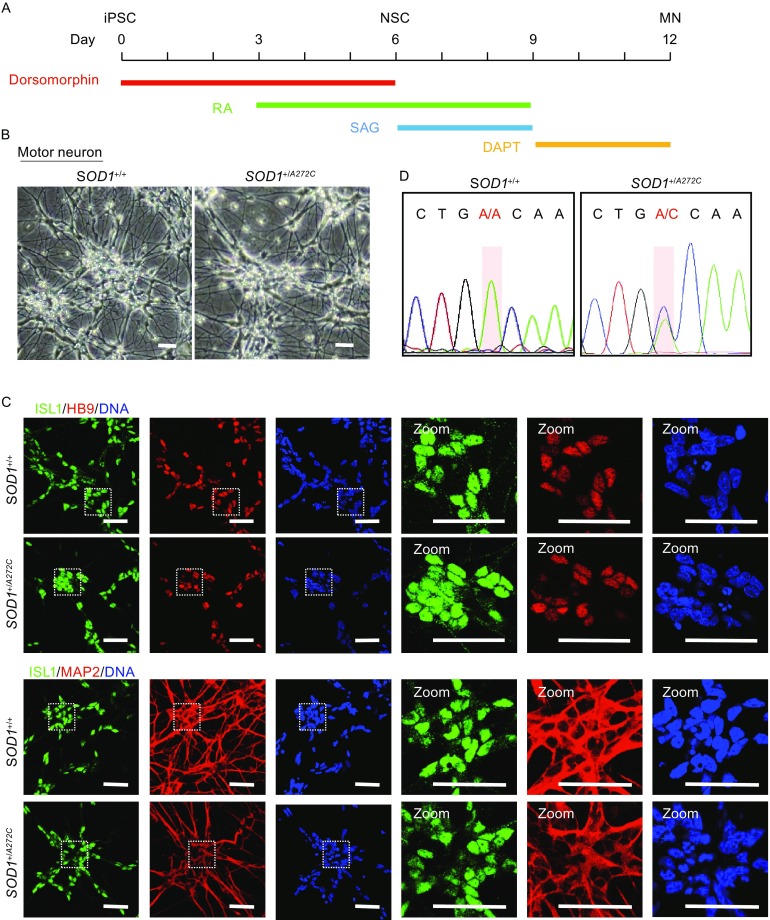
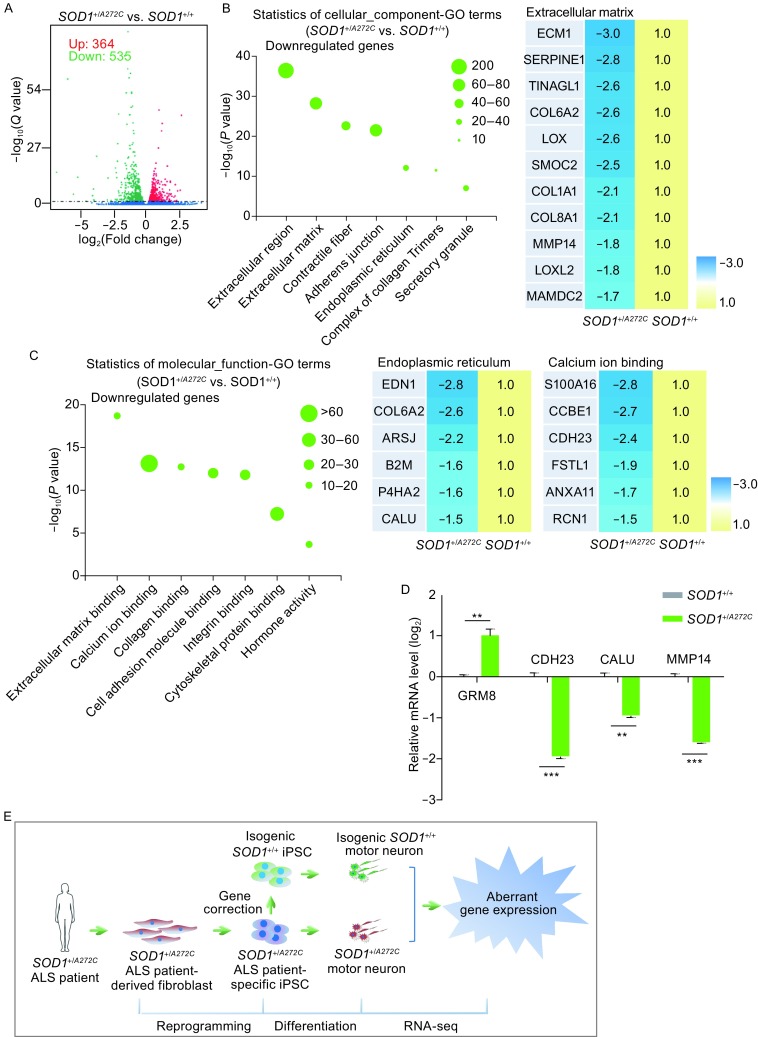
Amyotrophic lateral sclerosis (ALS) is a complex neurodegenerative disease with cellular and molecular mechanisms yet to be fully described. Mutations in a number of genes including SOD1 and FUS are associated with familial ALS. Here we report the generation of induced pluripotent stem cells (iPSCs) from fibroblasts of familial ALS patients bearing SOD1 +/A272C and FUS +/G1566A mutations, respectively. We further generated gene corrected ALS iPSCs using CRISPR/Cas9 system. Genome-wide RNA sequencing (RNA-seq) analysis of motor neurons derived from SOD1 +/A272C and corrected iPSCs revealed 899 aberrant transcripts. Our work may shed light on discovery of early biomarkers and pathways dysregulated in ALS, as well as provide a basis for novel therapeutic strategies to treat ALS.

Keywords: ALS; CRISPR/Cas9; gene correction; iPSC disease modeling.


Figures

Figure 1
Figure 1
Establishment of SOD1 +/A272C iPSCs and FUS +/G1566A iPSCs. (A) Schematic procedure of generating iPSCs from ALS patient fibroblasts. (B) Phase-contrast images of ALS patient fibroblasts (top panels) and iPSCs (bottom panels). Scale bars = 25 µm (top bottom) and 100 μm (bottom panels). (C) Immunofluorescent staining of pluripotency markers, OCT4, NANOG, and SOX2. Nuclei were stained with Hoechst 33342 (blue). Scale bars = 50 μm. (D) Immunofluorescent staining of TUJ1 (ectoderm), SMA (mesoderm), and FOXA2 (endoderm) in teratomas derived from ALS iPSCs in vivo. Nuclei were stained with Hoechst 33342 (blue). Scale bars = 50 μm. (E) DNA methylation analysis of the OCT4 promoter in ALS iPSCs. A pair of primers used is shown as arrows. Open and closed circles indicate unmethylated and methylated CpG dinucleotides respectively, as indicated. (F) Karyotyping analysis of ALS patient iPSCs. (G) Confirmation of the heterozygous mutation of SOD1 +/A272C and FUS +/G1566A in ALS iPSCs by DNA sequencing
Figure 2
Figure 2
Targeted gene correction of FUS and SOD1 mutations. (A) Strategy of correcting FUS +/G1566A mutation. The sequence of gRNA is shown with the PAM sequence. Red line represents the mutant allele, and blue line represents the wildtype allele. HR, homologous recombination. ssODN, single-stranded oligodeoxynucleotide. (B) BsaXI restriction digestion of PCR product before and after gene correction. The red letter highlights the corrected base. The mutation G>A eliminates BsaXI restriction site that is present in the corrected line. Primers used are shown as arrows in Fig. 2A (P1, P2). (C) DNA sequencing demonstrates the correction of FUS +/G1566A mutation. The red shadow highlights the corrected base. (D) DNA sequencing of the top 3 potential off-target sites. The off-target sites were predicated at http://crispr.genome-engineering.org/. Sequencing of PCR product shows no off-targets found. FOT, potential off-target site at gRNA targeted FUS gene. +1, plus strand. −1, minus strand. √, no off targets. (E) Strategy of correcting SOD1 +/A272C mutation. The sequence of gRNA is shown with the PAM sequence. Red line represents the mutant allele, and blue line represents the wildtype allele. HR, homologous recombination. ssODN, single-stranded oligodeoxynucleotide. (F) ApeKI restriction digestion of PCR product before and after gene correction. The red letter highlights the mutant base. The mutation A>C creates ApeKI restriction site that is absent in the corrected line. Primers used are shown as arrows in Fig. 2E (P3, P4). (G) DNA sequencing demonstrates the correction of SOD1 +/A272C mutation. The red shadow highlights the corrected base. (H) DNA sequencing of the top 3 potential off-target sites. The off-target sites were predicated at http://crispr.genome-engineering.org/. Sequencing of PCR product shows no off-targets found. SOT, potential off-target site at gRNA targeted SOD1 gene. +1, plus strand. −1, minus strand. √, no off targets. (I) Immunofluorescent images of pluripotency markers, OCT4, NANOG, and SOX2 incorrected clone in vitro and three-layer markers, TUJ1 (ectoderm), SMA (mesoderm), and FOXA2 (endoderm) in teratomas derived from corrected iPSCs in vivo. Nuclei were stained with Hoechst 33342 (blue). Scale bars = 50 μm
Figure 2
Figure 2
Targeted gene correction of FUS and SOD1 mutations. (A) Strategy of correcting FUS +/G1566A mutation. The sequence of gRNA is shown with the PAM sequence. Red line represents the mutant allele, and blue line represents the wildtype allele. HR, homologous recombination. ssODN, single-stranded oligodeoxynucleotide. (B) BsaXI restriction digestion of PCR product before and after gene correction. The red letter highlights the corrected base. The mutation G>A eliminates BsaXI restriction site that is present in the corrected line. Primers used are shown as arrows in Fig. 2A (P1, P2). (C) DNA sequencing demonstrates the correction of FUS +/G1566A mutation. The red shadow highlights the corrected base. (D) DNA sequencing of the top 3 potential off-target sites. The off-target sites were predicated at http://crispr.genome-engineering.org/. Sequencing of PCR product shows no off-targets found. FOT, potential off-target site at gRNA targeted FUS gene. +1, plus strand. −1, minus strand. √, no off targets. (E) Strategy of correcting SOD1 +/A272C mutation. The sequence of gRNA is shown with the PAM sequence. Red line represents the mutant allele, and blue line represents the wildtype allele. HR, homologous recombination. ssODN, single-stranded oligodeoxynucleotide. (F) ApeKI restriction digestion of PCR product before and after gene correction. The red letter highlights the mutant base. The mutation A>C creates ApeKI restriction site that is absent in the corrected line. Primers used are shown as arrows in Fig. 2E (P3, P4). (G) DNA sequencing demonstrates the correction of SOD1 +/A272C mutation. The red shadow highlights the corrected base. (H) DNA sequencing of the top 3 potential off-target sites. The off-target sites were predicated at http://crispr.genome-engineering.org/. Sequencing of PCR product shows no off-targets found. SOT, potential off-target site at gRNA targeted SOD1 gene. +1, plus strand. −1, minus strand. √, no off targets. (I) Immunofluorescent images of pluripotency markers, OCT4, NANOG, and SOX2 incorrected clone in vitro and three-layer markers, TUJ1 (ectoderm), SMA (mesoderm), and FOXA2 (endoderm) in teratomas derived from corrected iPSCs in vivo. Nuclei were stained with Hoechst 33342 (blue). Scale bars = 50 μm
Figure 3
Figure 3
Directed motor neuron differentiation from isogenic pair of iPSC lines. (A) Schematic overview of motor neuron differentiation from iPSCs. Compounds are added at different time points as indicated. NSC, neural stem cell. MN, motor neuron. (B) Phase contrast images of motor neurons derived from SOD1 +/A272C iPSCs and its isogenic control iPSCs at day 12. Scale bars = 75 μm. (C) Immunofluorescent images of motor neuron markers (ISL1, HB9) and other neural marker (MAP2) at day 12. Nuclei were stained with Hoechst 33342 (blue). Scale bars = 50 μm. (D) DNA Sequencing confirming SOD1 genotype in motor neurons derived from SOD1 +/A272C iPSCs and its isogenic control iPSCs at day 12
Figure 4
Figure 4
RNA-seq revealed SOD1 +/A272C-affected early pathways in human motor neurons. (A) Volcano plot analysis showing significantly altered genes (q value < 0.05) between SOD1 +/A272C and its isogenic control motor neurons. 535 downregulated genes (green) and 364 upregulated genes (red) were found in SOD1 +/A272C motor neurons compared with its isogenic control motor neurons. (B and C) GO terms based cellular_component and molecular_function enrichment analysis of the significantly downregulated gene sets in SOD1 +/A272C motor neurons. Heatmap of dysregulated genes between SOD1 +/A272C motor neurons and its isogenic control motor neurons. Number of altered genes in each GO term is indicated by size of the bubble. (D) RT-qPCR analysis of dysregulated genes in SOD1 +/A272C motor neurons and its isogenic control motor neurons. Values were normalized against GAPDH. Data were presented as mean ± SEM, n = 4, *P < 0.05, **P < 0.01, ***P < 0.001. (E) A proposed strategy generating ALS disease model using iPSC, gene editing, and cell differentiation approaches. Fibroblasts are obtained from ALS patient bearing SOD1 +/A272C mutation and reprogrammed to iPSCs. Isogenic control is created via gene editing. RNA-seq is performed in motor neurons to uncover SOD1 +/A272C-affected early events underlying ALS pathogenesis. RNA-seq analysis shows SOD1 +/A272C mutation induces aberrant gene expression

Similar articles

Cited by

References

    1. Al-Chalabi A, Hardiman O. The epidemiology of ALS: a conspiracy of genes, environment and time. Nat Rev Neurol. 2013;9:617–623. doi: 10.1038/nrneurol.2013.203. - DOI - PubMed
    1. Alexianu ME, Ho BK, Mohamed AH, La Bella V, Smith RG, Appel SH (1994) The role of calcium-binding proteins in selective motoneuron vulnerability in amyotrophic lateral sclerosis. Ann Neurol 36:846–858 - PubMed
    1. Anders S, Huber W. Differential expression analysis for sequence count data. Genome Biol. 2010;11:1–12. doi: 10.1186/gb-2010-11-10-r106. - DOI - PMC - PubMed
    1. Aronica E, Catania MV, Geurts J, Yankaya B, Troost D (2001) Immunohistochemical localization of group I and II metabotropic glutamate receptors in control and amyotrophic lateral sclerosis human spinal cord: upregulation in reactive astrocytes. Neuroscience 105:509–520 - PubMed
    1. Baechtold H, Kuroda M, Sok J, Ron D, , Lopez BS, Akhmedov AT (1999) Human 75-kDa DNA-pairing protein is identical to the pro-oncoprotein TLS/FUS and is able to promote D-loop formation. J Biol Chem 274:34337–34342 - PubMed

Publication types

MeSH terms