. 2017 May 2;51(9):4792-4802.
doi: 10.1021/acs.est.7b00012. Epub 2017 Apr 12.

Expanded Target-Chemical Analysis Reveals Extensive Mixed-Organic-Contaminant Exposure in U.S. Streams

Affiliations

Expanded Target-Chemical Analysis Reveals Extensive Mixed-Organic-Contaminant Exposure in U.S. Streams

Paul M Bradley et al. Environ Sci Technol. .

Abstract

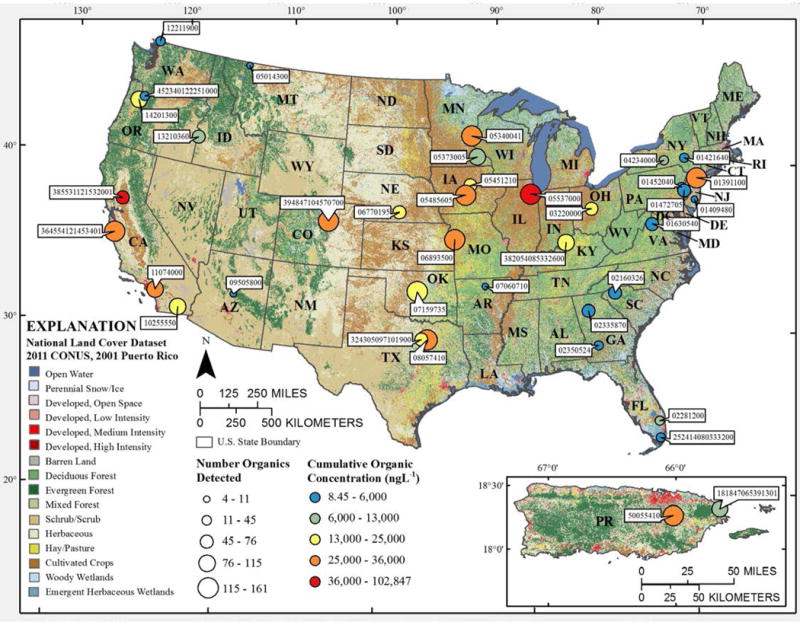
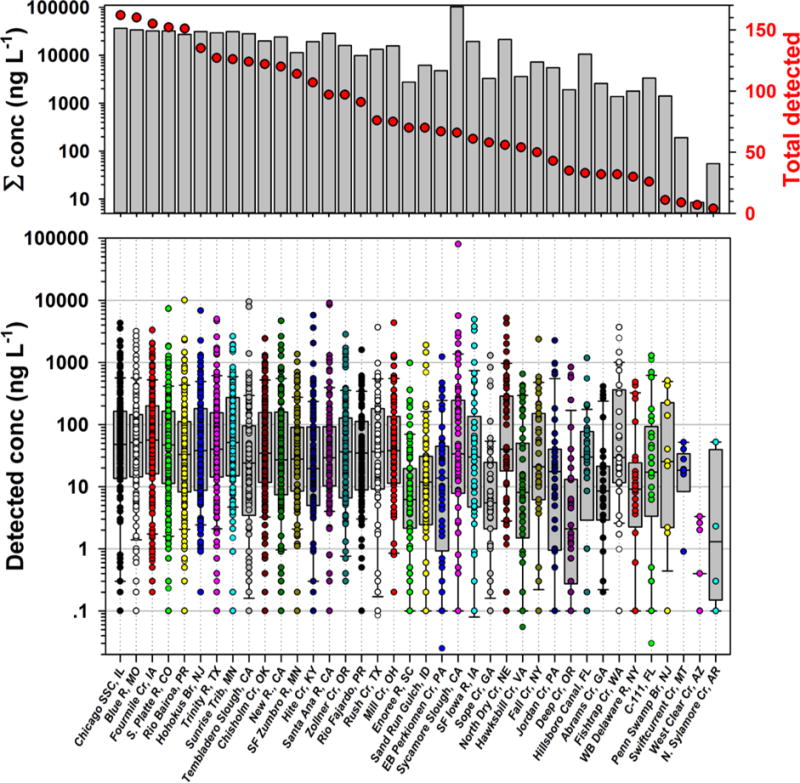
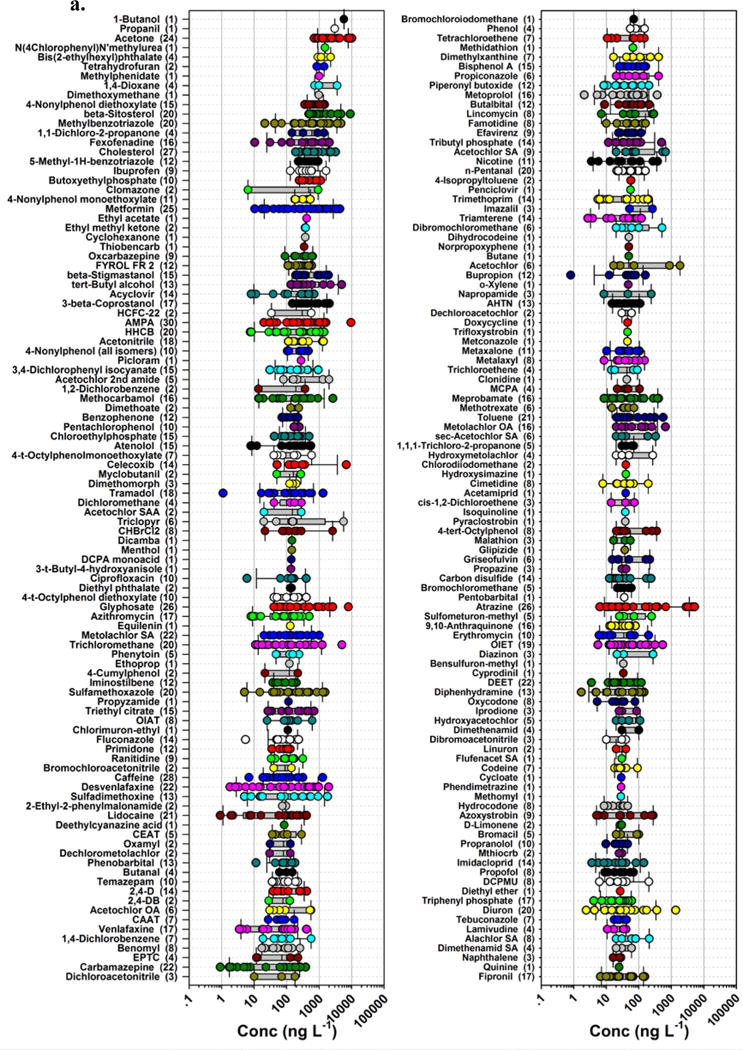
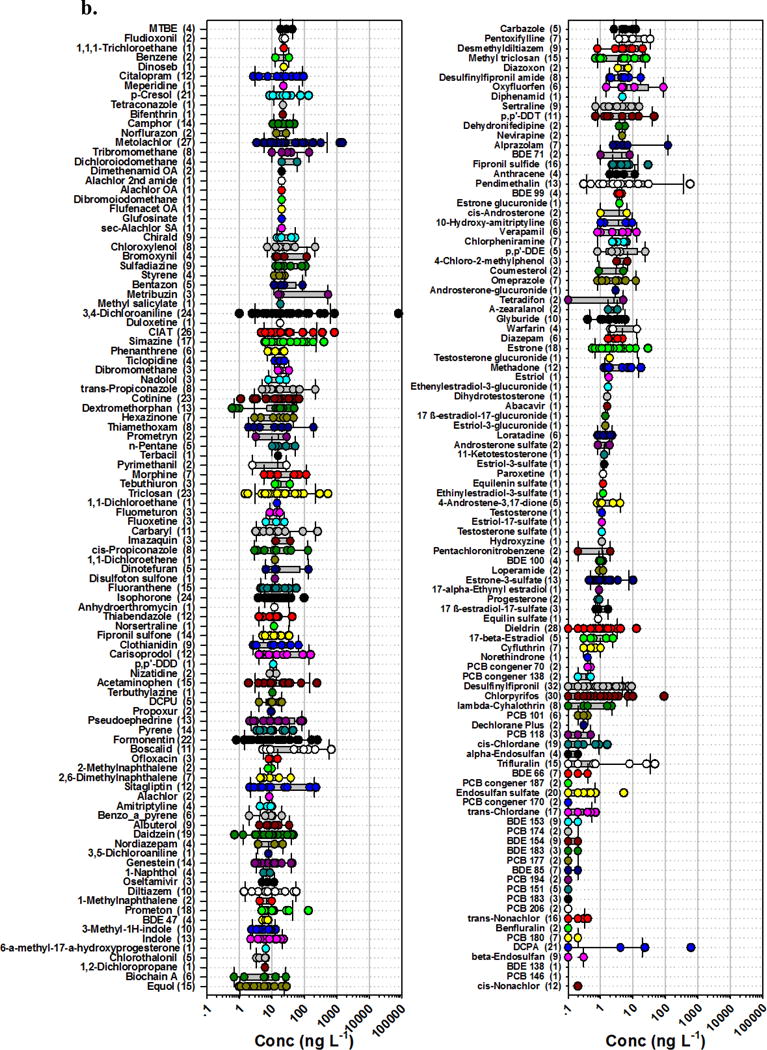
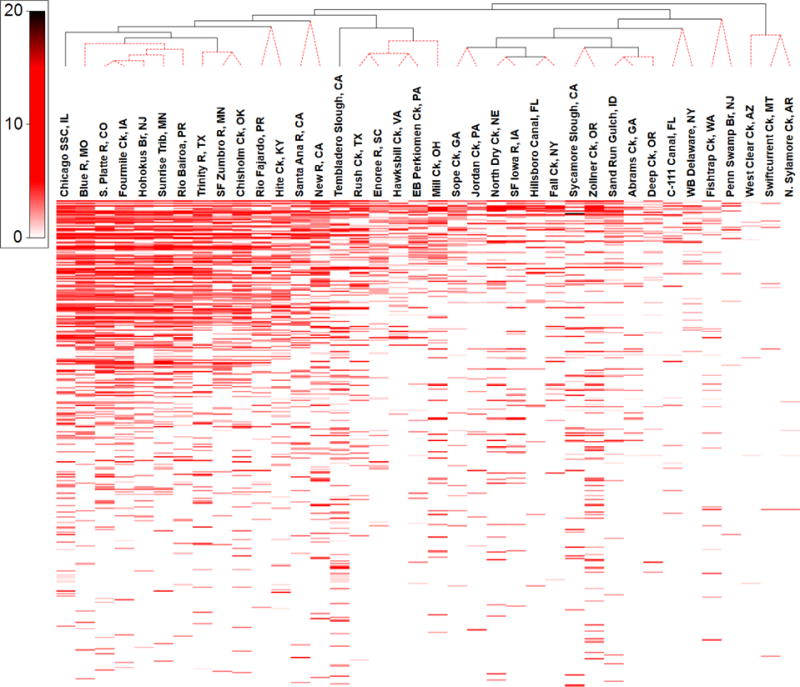
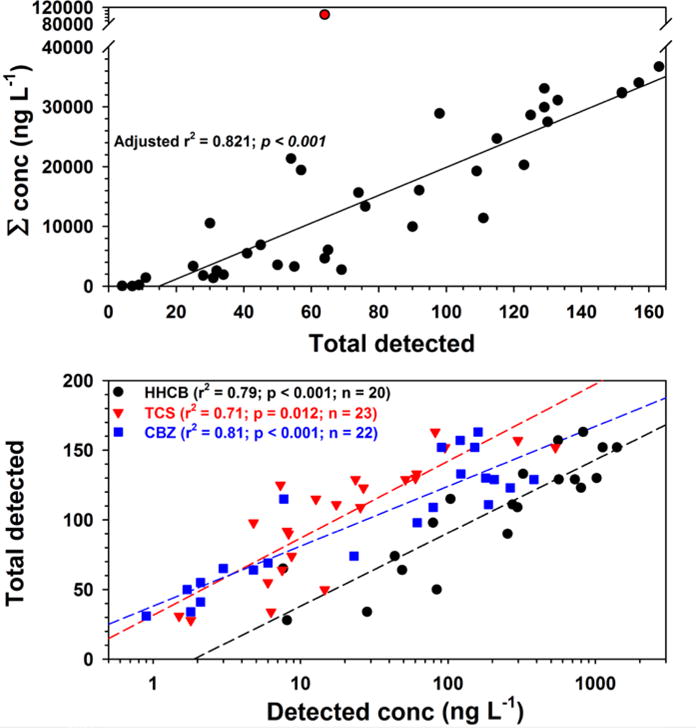
Surface water from 38 streams nationwide was assessed using 14 target-organic methods (719 compounds). Designed-bioactive anthropogenic contaminants (biocides, pharmaceuticals) comprised 57% of 406 organics detected at least once. The 10 most-frequently detected anthropogenic-organics included eight pesticides (desulfinylfipronil, AMPA, chlorpyrifos, dieldrin, metolachlor, atrazine, CIAT, glyphosate) and two pharmaceuticals (caffeine, metformin) with detection frequencies ranging 66-84% of all sites. Detected contaminant concentrations varied from less than 1 ng L-1 to greater than 10 μg L-1, with 77 and 278 having median detected concentrations greater than 100 ng L-1 and 10 ng L-1, respectively. Cumulative detections and concentrations ranged 4-161 compounds (median 70) and 8.5-102 847 ng L-1, respectively, and correlated significantly with wastewater discharge, watershed development, and toxic release inventory metrics. Log10 concentrations of widely monitored HHCB, triclosan, and carbamazepine explained 71-82% of the variability in the total number of compounds detected (linear regression; p-values: < 0.001-0.012), providing a statistical inference tool for unmonitored contaminants. Due to multiple modes of action, high bioactivity, biorecalcitrance, and direct environment application (pesticides), designed-bioactive organics (median 41 per site at μg L-1 cumulative concentrations) in developed watersheds present aquatic health concerns, given their acknowledged potential for sublethal effects to sensitive species and lifecycle stages at low ng L-1.


Figures

Figure 1
Figure 1
Total numbers and cumulative concentrations (ng L−1) of organic analytes detected in water during 2012–2014 sampling of 38 stream sites (Table S1) across the nation. Numeric labels indicate USGS NWIS stream station IDs.
Figure 2
Figure 2
Top: Total numbers (red circles) and cumulative concentrations (ng L−1; bars) of organic analytes detected in water by site during 2012–2014 sampling of 38 streams across the nation. Bottom: Concentrations (ng L−1, circles) of individual organics detected. Boxes, centerlines, and whiskers indicate interquartile range, median, and 5th and 95th percentiles, respectively.
Figure 3
Figure 3
Detected concentrations (circles, ng L−1) and number of sites (in parentheses) for 389 organic analytes (in order of decreasing median detected concentration, top to bottom left to right: 3a. 1–200; 3b. 201–389) in water samples during 2012–2014 sampling of 38 streams across the nation. Circles are data for individual samples. Boxes, centerlines, and whiskers indicate interquartile range, median, and 5th and 95th percentiles, respectively.
Figure 3
Figure 3
Detected concentrations (circles, ng L−1) and number of sites (in parentheses) for 389 organic analytes (in order of decreasing median detected concentration, top to bottom left to right: 3a. 1–200; 3b. 201–389) in water samples during 2012–2014 sampling of 38 streams across the nation. Circles are data for individual samples. Boxes, centerlines, and whiskers indicate interquartile range, median, and 5th and 95th percentiles, respectively.
Figure 4
Figure 4
Shadeplot of concentrations (scale in μg L−1) of 406 detected organic analytes (unlabeled, top to bottom in order of decreasing median detected concentration) in water from 38 stream sites, clustered (UncTree) by mixture pattern. White indicates less than MDL (minimum detection limit). Dashed-red dendrogram lines indicate sites not statistically different (SimProf; α = 0.05).
Figure 5
Figure 5
Top: Simple linear regression (line) of cumulative concentration and total number of detected organic analytes (black circles) in water from 37 streams across the nation (not including Sycamore Slough, red circle). Bottom: Simple linear regressions (lines) of total number of detected organic analytes and concentrations of HHCB (black circles), triclosan (TCS, red triangles), and carbamazepine (CBZ, blue squares).

References

    1. Schäfer RB, Kühn B, Malaj E, König A, Gergs R. Contribution of organic toxicants to multiple stress in river ecosystems. Freshwater Biol. 2016;61(12):2116–2128.
    1. Malaj E, von der Ohe PC, Grote M, Kühne R, Mondy CP, Usseglio-Polatera P, Brack W, Schäfer RB. Organic chemicals jeopardize the health of freshwater ecosystems on the continental scale. Proc Natl Acad Sci. 2014;111(26):9549–9554. - PMC - PubMed
    1. Doyle E, Biales A, Focazio M, Griffin D, Loftin K, Wilson V. Effect-Based Screening Methods for Water Quality Characterization Will Augment Conventional Analyte-by-Analyte Chemical Methods in Research As Well As Regulatory Monitoring. Environ Sci Technol. 2014;49(24):13906–13907. - PubMed
    1. Carlin DJ, Rider CV, Woychik R, Birnbaum LS. Unraveling the health effects of environmental mixtures: an NIEHS priority. Environ Health Perspect. 2013;121(1):a6–a8. - PMC - PubMed
    1. Bright PR, Buxton HT, Balistrieri LS, Barber LB, Chapelle FH, Cross PC, Krabbenhoft DP, Plumlee GS, Sleeman JM, Tillitt DE, Toccalino P, Winton J. US Geological Survey environmental health science strategy: providing environmental health science for a changing world. US Geological Survey Circular 1383–E; 2013