. 2017 Apr 12:8:14923.
doi: 10.1038/ncomms14923.

Anisotropic forces from spatially constrained focal adhesions mediate contact guidance directed cell migration

Affiliations

Anisotropic forces from spatially constrained focal adhesions mediate contact guidance directed cell migration

Arja Ray et al. Nat Commun. .

Abstract

Directed migration by contact guidance is a poorly understood yet vital phenomenon, particularly for carcinoma cell invasion on aligned collagen fibres. We demonstrate that for single cells, aligned architectures providing contact guidance cues induce constrained focal adhesion maturation and associated F-actin alignment, consequently orchestrating anisotropic traction stresses that drive cell orientation and directional migration. Consistent with this understanding, relaxing spatial constraints to adhesion maturation either through reduction in substrate alignment density or reduction in adhesion size diminishes the contact guidance response. While such interactions allow single mesenchymal-like cells to spontaneously 'sense' and follow topographic alignment, intercellular interactions within epithelial clusters temper anisotropic cell-substratum forces, resulting in substantially lower directional response. Overall, these results point to the control of contact guidance by a balance of cell-substratum and cell-cell interactions, modulated by cell phenotype-specific cytoskeletal arrangements. Thus, our findings elucidate how phenotypically diverse cells perceive ECM alignment at the molecular level.


Conflict of interest statement

A.R., O.L., Z.W., R.M.E., P.W.A. and P.P.P. declare no competing financial interests. D.-H.K. is a co-founder and scientific board member of a start-up company, NanoSurface Biomedical that aims to commercialize nanopatterned polymeric cultureware.

Figures

Figure 1
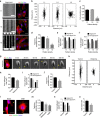
Figure 1. Nanopatterned substrates mimic aligned collagen architectures in breast and pancreas cancer.
(a) Combined multiphoton excitation (MPE) and SHG image from live mammary carcinoma adapted from Provenzano et al., with permission, demonstrating the distinct cell–ECM interactions present during carcinoma cell invasion into regions of aligned stromal collagen. Asterisks signify single cells that have migrated past the tumour boundary along aligned collagen fibres. Scale bar, 25 μm. (b) SEM image of collagen fibrils within mammary collagen fibres and line scan data demonstrating the spacing between fibril bundles. (c) Quantification of the mean and full range (bars) of spacings between fibril bundles. (d) Combined MPE and SHG imaging showing aligned collagen patterns (grey) interacting with ZsGreen expressing PDA cells (green) within a pancreas tumour. Scale bar, 50μm. (e) Angular histogram of orientation of collagen and carcinoma cells from the image in d showing cell elongation in the direction of collagen alignment. (f) Step-wise methodology for nanofabrication of substrates to model ECM alignment. (g) Scanning electron micrograph of the standard aligned substrate possessing ridge and groove widths of 800 nm and ridges that are 600 nm in depth and a micrograph showing a typical MDA-MB-231 cell on a typical aligned substrate oriented along the direction of ECM alignment. Scale bar, 20 μm.
Figure 2
Figure 2. Stable membrane protrusions highly constrained to the direction of ECM alignment are associated with contact guidance-directed migration.
(a) Migration trajectory map of MDA-MB-231 cells on flat and topographically aligned substrates. (b,c) Cell orientation (b) and Trajectory orientation (c) indices for MDA-MB-231 cells on flat versus nanopatterned substrates showing significantly greater directed migration due to contact guidance (n>75 cells per group). (d) Persistence time of MDA-MB-231 cells on flat and aligned substrates (n>85 cell per group). (e) Timelapse montage of lamellipodia dynamics over time for MDA-MB-231 cells on flat versus aligned substrates. Arrowheads highlight protrusion stability on aligned ECM or frequent change in direction for cells on flat substrates. Scale bar, 50 μm. (f) Wind-rose plot of MDA-MB-231 lamellipodia protrusion orientations showing highly directed protrusion dynamics for cells on aligned ECM (n>400 lamellipodia per group). (g,h) Lamellipodia lifetime (g) and Angular spread (h) for MDA-MB-231 cells on flat versus aligned substrates demonstrating significantly greater protrusion stability and directionality for cells on aligned ECM (g: n>75 per group; h: n=28 per group). Data in bd,fh are mean±s.e.m. **P<0.0001, *P<0.01, #P<0.001 (unpaired t-test with Welch's correction: bd,g; Mann–Whitney test: h).
Figure 3
Figure 3. Spatial constraints from aligned topographies direct focal adhesion orientation as well as elongation and biased distribution.
(a) Representative fluorescence micrograph showing a typical MDA-MB-231 cell aligned on a nanopatterned substrate stained for actin (red), Vinculin (green) and nucleus (blue); scale bar, 20 μm. (inset-1 for top box) Magnified region demonstrating high FA alignment and magnified side region (inset-2 from side box) showing non-aligned Vinculin-stained FA complexes (green) overlaid on the nanopatterns from bright-field image (grey). (b) Schematic diagram showing the projection length of an ellipsoidal FA complex confined within a nanopattern ridge or groove and analysis of FA complexes on patterns of varying ridge and groove widths, where the ridge and groove width dimensions are equal for each condition (that is, 1:1 ratio), demonstrating that the vast majority of FAs have projection lengths less than the corresponding pattern dimensions. (c) Overlaid bright-field micrographs of nanopatterns (grey) and fluorescence micrographs of Vinculin (green) showing typical adhesion complex distribution on patterns with 1:1 ridge=groove width (for example, 400 nm:400 nm on the left and 800 nm:800 nm on the right) with average line intensities for each along the corresponding abscissa demonstrating FA confinement to individual ridges and grooves. (d) Widths of large, aligned FA complexes at the leading edge of cells on aligned substrates increase with increasing pattern widths and are higher still on flat substrates (n>65 per group). (e) Peak-to-peak distances or spacing between adjacent FAs as a function of pattern width/spacing highlighting the discrete arrangement of FA positions. Pink and blue highlighted regions respectively denote pattern width ranges where adjacent FAs form on consecutive ridges only and on both ridges and grooves, as inferred from the slope of their linear relationship to the pattern widths. Data are median with 10–90th percentile range (d) and mean±s.d. (e). #P<0.05, *P<0.001, NS=no significance (ANOVA).
Figure 4
Figure 4. Laterally constrained adhesion growth promotes orientation and anisotropic distribution of focal adhesions and traction forces.
(a) Fluorescence micrograph of the leading edge of a typical MDA-MB-231 cell on an aligned substrate stained for F-actin (red) vinculin (green) and nucleus (blue). Magnified Box 1 and 2 show aligned FAs connected to long stress fibre-like F-actin cables, contrary to non-aligned FAs. Scale bar, 20 μm. (b) Normalized FA aspect ratio of MDA-MB-231 cells (on flat and aligned substrates) and MIA-PaCa-2 cells (on aligned) as a function of the corresponding FA orientations. Data are mean ±s.e.m., aligned FA: ≤20° deviation from substrate alignment (pink region) and non-aligned FA (white region); (see Methods for additional details). (c,d) Aspect ratio (c) and area (d) of aligned and non-aligned FAs in MDA-MB-231 and MIA-PaCa-2 cells on aligned versus flat control substrates showing increased elongation and size of FAs oriented in the direction of topographic alignment (n>400 adhesions per cell line). (e) Length of F-actin fibres connected to aligned and non-aligned FAs at the cell periphery (n>180 fibres per group). (f) Normalized F-actin fibre length as a function of fibre orientations in MDA-MB-231 cells on aligned and flat substrates; data are mean ±s.e.m.; aligned F-actin: ≤20° deviation from substrate alignment (pink region) and non-aligned F-actin (white region); (see methods for additional details). (g) Aligned F-actin fibres are longer than non-aligned F-actin fibres in MDA-MB-231 cells on aligned but not on flat substrates (n>500 actin fibres per group). (h) Bright-field, fluorescence micrographs and traction stress maps (n≥7 cells per condition) of MDA-MB-231 cells patterned on ECM-coated islands in polyacrylamide gels with increasing aspect ratios (AR) of 1, 2 and 5. Scale bar, 20μm. (i) Focal adhesion and actin fibre orientation indices showing increasing alignment with aspect ratio (n>100 adhesions per condition; *P<0.0001 between AR=5 and AR=1 or AR=2 groups; and n>400 fibres per condition, #P<0.0001 between AR=5 and AR=1 or AR=2 and #P<0.01 between AR=1 and AR=2 groups by ANOVA). (j) Force anisotropy in long axis (y) versus lateral (x) directions with increasing aspect ratio (n>7 per condition; **P<0.01 for each pairwise comparison by Kruskal–Wallis test). Data in ce,g,i,j are mean±s.e.m., *P<0.0001, NS: no significance (unpaired t-test).
Figure 5
Figure 5. Relaxing constraints of focal adhesion growth or perturbing the focal adhesion-actin linkage diminishes contact guidance.
(a) Nanopatterned substrates with 550 nm ridge width but varying groove widths either equal (1:1), twice (1:2) or five (1:5) times that of the ridge (scale bar, 5 μm); fluorescence micrographs showing F-actin (red), vinculin (green) and nuclei stained MDA-MB-231 cells on the corresponding patterns (scale bar, 20 μm). (b) Migration trajectory maps of MDA-MB-231 cells on nanopatterned substrates showing a profound decrease in directed migration with decreasing pattern density. (c,d) Cell (c) and trajectory (d) orientation indices for MDA-MB-231 cells on nanopatterned substrates with varying pattern density (c: n>100 per group; d: n>130 per group; *P<0.0001 between 1:1, 1:5 and 1:2, 1:5; #P<0.05 between 1:1 and 1:2 by Kruskal–Wallis test). (e,f) FA size anisotropy quantified by elongation (e) and area (f) showing a reduction in the orientation-dependent FA distribution as the pattern density decreases (n>700 per group). (g) Fluorescence micrograph of a typical Rotenone-treated MDA-MB-231 cell on an aligned substrate and a timelapse montage of a similar cell showing unconstrained membrane protrusions, indicated by yellow arrowheads (scale bars, 20 μm). (h) FA size of 10 μM Rotenone-treated MDA-MB-231 cells is lower than the control on aligned substrates (n>350 per group). (i) FA aspect ratio showing a reversal of alignment-dependent FA elongation in Rotenone-treated MDA-MB-231 cells (n>350 per group). (j,k) Trajectory orientation indices (j) and trajectory maps (k) of MDA-MB-231 cells migrating on nanopatterned substrates with or without Rotenone treatment (n>90 per group). (l) Fluorescence micrographs of MDA-MB-231 cells on aligned substrates stained for F-actin (red), Vinculin (green) and nuclei (blue) showing shifts in phenotype with treatment (50 μM Blebbistatin and 10 μg ml−1 AIIB2) to disrupt cell traction force; yellow arrowheads indicate lateral membrane protrusions. Scale bar, 20μm. (m) Quantification of trajectory orientations for control, Blebbistatin and AIIB2-treated MDA-MB-231 cells (n>100 per group; *P<0.0001 between each group and the control by Kruskal–Wallis test). (n) FA aspect ratio of control and AIIB2-treated groups demonstrate similar orientation-dependent size distribution (n>400 per group). (o) Aspect ratio of control versus AIIB2-treated cells (n>40 per group, *P<0.0001). Bar graphs represent mean±s.e.m. *P<0.001, NS: no significance (unpaired t-test with Welch's correction for e,f,h,i,n; Mann–Whitney test for j,o).
Figure 6
Figure 6. Phenotypically diverse carcinoma cells respond differently to nanoscale contact guidance cues.
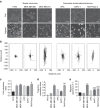
(a) Morphology of breast and pancreatic carcinoma cell lines on flat (Top) substrates showing the baseline epithelial phenotypes of T47D, MDA-MB-468, KPC, and AsPC-1 cells in contrast to the strong EMT phenotype of MDA-MB-231 and MIA-PaCa-2 cells. (Bottom) On aligned substrates, cells respond readily by aligning along the contact guidance cues. Scale bar, 50 μm. (b) Cell trajectory plots mapping migration path over time on aligned ECM demonstrate responsiveness to contact guidance and the cell line specific heterogeneity of the response. (c,d) Cell (c) and Trajectory (d) orientation indices demonstrating responsiveness to contact guidance for all cell lines and a more robust response in cells with an EMT phenotype (for c: n=70–120 cells per group; *P<0.0001 for T47D versus MDA-MB-468 and MDA-MB-231 cells; #P<0.001 for KPC and AsPC-1 versus MIA-PaCa-2 cells; for d: n=90–220 cells per group; **P<0.0001 for T47D and MDA-MB-468 versus MDA-MB-231 cells; ##P<0.0001 for KPC versus AsPC-1 and MIA-PaCa-2 cells). (e) Migration speed of each cell line on aligned topography determined from the PRWM showing the highest speed in cells with an EMT phenotype (n=50–100 cell per group; ***P<0.0001 for T47D and MDA-MB-468 versus MDA-MB-231; ###P<0.0001 for KPC versus AsPC-1 and MIA-PaCa-2 cells). Data in ce are mean±s.e.m., all comparisons by the Kruskal–Wallis test.
Figure 7
Figure 7. Cell–cell interactions or the amoeboid migration mode diminish directional guidance from nanopatterned cues.
(a) Phase contrast images of KPC cells on patterned substrates show aligned single cells (yellow arrowhead) and randomly oriented clustered cells (red circle), while KPC cells treated with 2 mM EDTA or TGF-β switched to the single-cell phenotype (b) Trajectory maps of cells in clusters, single cells and those treated with EDTA and TGF-β. (c,d) Trajectory (c) and cell (d) orientation indices of the groups in a,b. (n=30–115 per group, symbols on top of columns represent comparison with the cell cluster group). (e) Fluorescence micrographs of KPC cells engaged in cell–cell clusters, EDTA and TGF-β-treated KPC cells on nanopatterned substrates stained for F-actin (red), Vinculin (green) and nuclei (blue) showing distinct phenotypes for single versus collective cells. (f) Orientation-dependent F-actin length distribution is enhanced by inducing a single-cell or EMT phenotype (n>1,000 per group), so are (g) focal adhesion (n>400 per group) and (h) actin fibre alignment (n>1,000 per group). (i) Phase contrast images of IgG control and 5 μM SHE787-treated T47D cells on aligned substrates showing clustered to single-cell phenotype shift. (j) Trajectory maps showing increased aligned migration in the SHE787-treated group. (k,l) Trajectory (k) and cell (l) orientation indices of the groups in i,j (n>70 per group). (m) Fluorescence micrographs of IgG control and SHE787-treated T47D cells on nanopatterned substrates stained for F-actin (red), Vinculin (green), E-cadherin (grey) and nuclei (blue). (n) Orientation-dependent FA elongation is enhanced by disrupting cell–cell junctions (n>300 per group), so is (o) focal adhesion alignment (n>700 per group). (p) Representative phase contrast micrograph of AsPC-1 cells on an aligned substrate showing elongated mesenchymal-like (red arrowhead) and rounded, amoeboid-like cells (yellow arrowhead). (q) Migration trajectory maps of the two sub-groups. (r,s) Cell (r) and trajectory (s) orientation indices of the corresponding groups in p,q (n>30 per group). (t) Fluorescence micrographs of AsPC-1 cells on nanopatterned substrates showing typical mesenchymal and amoeboid (yellow arrowhead) morphologies with staining for F-actin (red), Vinculin (green) and nuclei (blue). Scale bars, 20 μm. *P<0.001, #P<0.05, NS: no significance (Kruskal–Wallis test: c,d; unpaired t-test: f,l,n,o; ANOVA: g,h; Mann–Whitney test: k,r,s).
Figure 8
Figure 8. Contact guidance is driven by constrained focal adhesion growth and modulated by cell phenotype.
Schematic diagram showing how disparate cell phenotypes (left most column) differ in the levels of key determinants of contact guidance response (right most column), akin to a tuning model of cell migration. The relative magnitude of each parameter for a given cell type, approximated from our experimental results, is represented by color-coded dots and connected by partially blended lines as a visual aid. Each key parameter may be altered within and across different cell types (as shown in this study) by targeting intracellular and/or extracellular targets. The cumulative findings presented in this figure provide a biophysical roadmap of tunable parameters to interpret, understand and disrupt contact-guided directed migration across diverse carcinoma cell phenotypes.

References

    1. Daley W. P. & Yamada K. M. ECM-modulated cellular dynamics as a driving force for tissue morphogenesis. Curr. Opin. Genet. Dev. 23, 408–414 (2013). - PMC - PubMed
    1. Rose D. M., Alon R. & Ginsberg M. H. Integrin modulation and signaling in leukocyte adhesion and migration. Immunol. Rev. 218, 126–134 (2007). - PubMed
    1. Yamaguchi H., Wyckoff J. & Condeelis J. Cell migration in tumors. Curr. Opin. Cell Biol. 17, 559–564 (2005). - PubMed
    1. Provenzano P. P., Eliceiri K. W. & Keely P. J. Shining new light on 3D cell motility and the metastatic process. Trends Cell Biol. 19, 638–648 (2009). - PMC - PubMed
    1. Friedl P. & Alexander S. Cancer invasion and the microenvironment: plasticity and reciprocity. Cell 147, 992–1009 (2011). - PubMed

Publication types